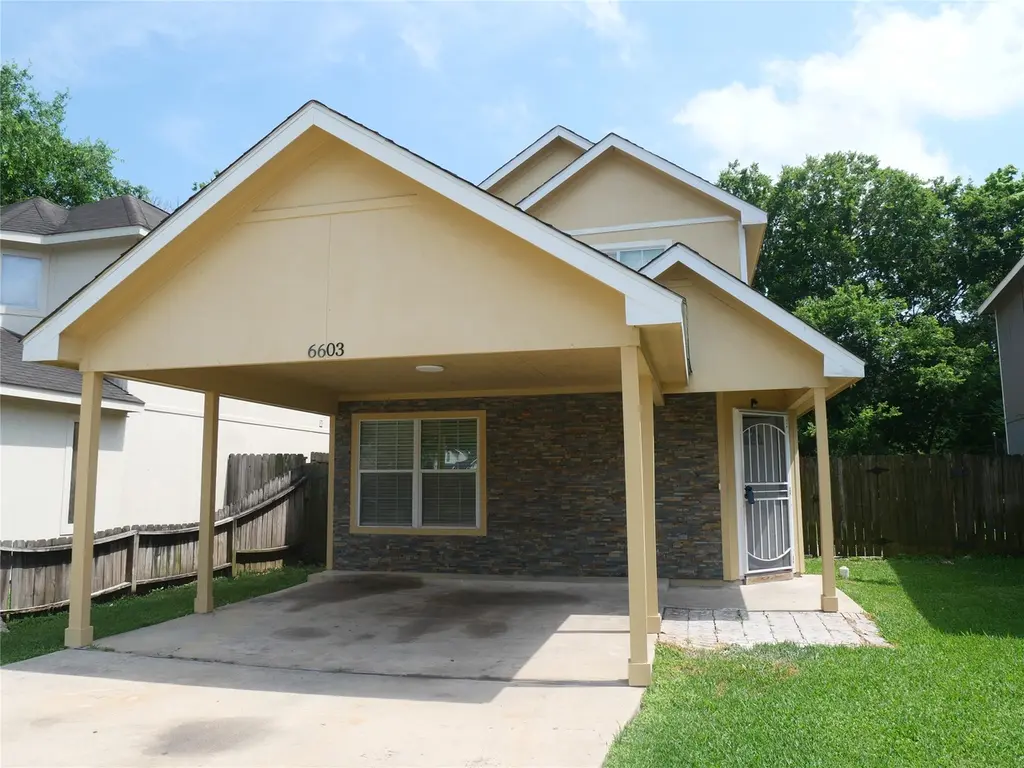
6603 Schambray St · Houston, TX
Flood risk 1/10 · Minimal
- FEMA flood zone
- X (unshaded)
- Chance of flooding over 30 yrs
- 0.0%
- Est. flood insurance / yr
- $507 – $1,088
Fire risk 2/10 · Minimal
- Est. fire insurance / yr
- $1,222 – $2,270
Heat risk 9/10 · Severe
- Hot days now (above 110°F)
- 7 days/yr
- Hot days in 30 yrs
- 23 days/yr
Wind risk 9/10 · Severe
- Chance of severe wind over 30 yrs
- 99.0%
Air-quality risk 3/10 · Minor
- Unhealthy air days now
- 2 days/yr
- Unhealthy air days in 30 yrs
- 3 days/yr
Risk factors via First Street. Map © Google.
Why this score? — see what drove the C- grade
The composite is a weighted blend of 9 inputs, each scored 0–100. Each bar is that input's sub-score; the figure is the points it added to the 100-point composite (weight × sub-score).
- Cash flow +13.9/30.0
- ARV discount +10.3/15.0
- Schools +4.5/10.0
- Appreciation +4.4/10.0
- DSCR +4.2/10.0
- 1% rule +3.8/10.0
- Livability +3.7/5.0
- Rent growth +2.9/5.0
- Condition / age +2.5/5.0
$199,900
🖨 Deal sheet 📄 Offer letter ✓ Due diligence
Listing remarks
Great starter home with 3 bedrooms and 2 bathrooms. Primary room is downstairs, and 2 guest room are upstairs. Newer 30-year roof in 2 years and new inside paint throughout. Many upgrades including fans and light fixtures, high quality 20mm vinyl plank flooring for stairs and all bedroom downstairs / upstairs, and 2 vanities/mirrors. HVAC and water heater in Dec 2020. Big backyard for family and BBQ events. Very low tax rate about 1.9%. The house is located next to major freeway such as Beltway 8, and Fort Bend Tollway, so very easy access to medical center, and Pearland.
Key facts
- Big backyard
- Newer 30-year roof
- 4,120 sq ft lot
Tags
Property features AI
Exterior
- Parking: Attached carport with 1 carport space
- Utilities: Public water; Public sewer
- Home design: Residential property; Built in 2004; Slab foundation; Composition roof
- Construction: Cement siding construction
- Exterior features: Subdivision lot
Interior
- Bedrooms: Primary bedroom on the first floor; Two additional bedrooms on the second floor
- Bathrooms: 2 full bathrooms
- Heating & cooling: Central heating (electric); Central air conditioning (electric)
- Interior features: Living room
Neighborhood map
What this means for you Summary
Snapshot
- This is a 3-bed/2.0-bath single-family listed at $200k.
Deal economics
- At list price, monthly cash flow is $23 ($278/yr) — positive.
- The deal already cash-flows at list — no discount required.
- To meet the 1% rule (rent ≥ 1% of price), the offer needs to be $176k (12.0% below list).
- Recommended offer: $176k (12.0% below list) — sets the bar for 1% rule.
- Cap rate 6.4% vs local median 3.2% in Houston — top-decile yield for the area; either an underpriced asset or a hidden risk that comps aren't pricing in. Stress-test before assuming the spread holds.
Location & tenants
- Location reads 74/100 on livability (#184 in TX, #4,771 nationally) — a middle-class / working-renter tenant base. Strengths: amenities A+, cost of living A+, housing A+; Watch: crime F.
- Fort Bend ISD (suburban): math 44% / reading 53% proficiency, ranked #140 of 826 in TX (top 17%) — families likely to look elsewhere, expect single-tenant / working-renter base with shorter leases.
- Zoned schools: Blue Ridge El (math 8% / reading 17%, grade F, #4,180 of 4,322 statewide, top 97%, 263 students, 89% FRL); Christa Mcauliffe Middle (math 9% / reading 20%, grade F, #1,583 of 1,662 statewide, top 96%, 835 students, 94% FRL); Willowridge H S (math 12% / reading 29%, grade F, #1,389 of 1,632 statewide, top 86%, 1,319 students, 87% FRL) — zoned schools average 90% FRL vs 35% district-wide (55 pts higher); higher-poverty schools than district average — tighter screening recommended.
- Zoned-school proficiency averages 16% at this address vs 48% district-wide (-33 pts) — the specific schools serving this property underperform the Fort Bend ISD average; the district grade overstates school quality for this exact location.
- Market conditions: Rents rising (+1.5%/yr); 37 active listings in the ZIP; 19 comparable units currently listed for rent nearby; rentals leasing fast (median 11d on market — plan ~1-2 weeks tenant-placement turnaround); 12,093 units permitted in Fort Bend County in 2024 (815 in 5+ unit buildings).
- This rent runs 31% of the median local income ($68k/yr) — at the standard rent-burdened threshold; future hikes will face affordability resistance.
Forward outlook
- Local home prices are declining (-1.2%/yr); year-one equity from $1k of loan paydown is wiped out by about $2k of value loss. Plan a longer hold.
- Fort Bend County population projected at +75% by 2050 — long-run rental-demand tailwind backs the buy-and-hold thesis.
Negotiation context
- It's been on market 52 days — a 3% lower offer ($194k) is reasonable based on typical stale-listing flexibility.
- 10 sale attempts since 18y ago with the ask held roughly flat each time — persistent listings suggest the price (not the market) is what's stuck; bring a comps-based counter.
Risks & watch-outs
- Climate carrying-cost: severe wind risk, 99% chance of damaging wind over 30y; extreme-heat days projected 7→23/yr by 2055 (HVAC capex compounding) — expect insurance premiums to compound above CPI over the hold.
Questions for the listing agent
- It's been on market 52 days. Have you received any prior offers? Is the seller open to a 12% concession, seller financing, or rate buy-down credit?
- Is there a deadline driving the sale (1031 exchange, divorce, estate, relocation)? That informs how much negotiation room exists.
- Schools are D-rated, which usually means shorter tenancies and higher turnover. Who's the typical renter profile here, and what's been the actual vacancy rate?
- Crime grade is F in this area — have there been break-ins, vandalism, or insurance claims at this property in the last 3 years? What carrier currently insures it and at what premium?
- What's the average days-on-market for RENTAL listings here right now (not sales)? A rising rental-DOM trend means longer vacancies and softer asking-rent achievability than the comps imply.
- What's the recent tenant-quality profile in this submarket — average credit score on applications, eviction rate, late-payment / NSF rate, and stable-employment percentage? A property-management company in the area should have these aggregated.
- How much new for-sale + rental construction is in the pipeline within 1–3 miles? Heavy new supply typically softens prices + rents 12–24 months out; constrained supply supports both.
Investment metrics
- 1% rule
- 0.88% ✗
- Cap rate
- 6.43%
- Cash-on-cash
- 0.50%
- DSCR
- 1.02
- GRM
- 9.5
CMA / ARV
- ARV (median comp)
- $213,400
- List price
- $199,900
- Delta
- -6.33%
- Verdict
- FAIR
- Comps
- 20 within 1.0 mi
Show comp detail 11 sales within ~0.75 mi
| Address | Dist | Beds/Ba | Sqft | Sold | Price | $/sf | Match |
|---|---|---|---|---|---|---|---|
| 15615 Raven Trl | 0.50mi | 3/2.0 | 1,268 (+0%) | 5mo | $229,999 | $181 | 72 |
| 6647 Villarreal Dr | 0.71mi | 3/2.0 | 1,268 (+0%) | 0mo | $194,800 | $154 | 66 |
| 6913 Chasewood Dr | 0.60mi | 3/2.0 | 1,312 (+4%) | 4mo | $99,000 | $75 | 62 |
| 6706 Castleview Ln | 0.51mi | 3/2.0 | 1,364 (+8%) | 2mo | $195,000 | $143 | 61 |
| 6631 Indian Falls Dr | 0.59mi | 3/2.0 | 1,310 (+4%) | 8mo | $191,500 | $146 | 59 |
| 15431 Indian Woods Dr | 0.40mi | 3/2.0 | 1,357 (+8%) | 12mo | $214,900 | $158 | 59 |
| 15522 Briar Spring Ct | 0.58mi | 3/2.0 | 1,357 (+8%) | 14mo | $237,500 | $175 | 49 |
| 15439 Indian Woods Dr | 0.43mi | 4/2.0 (+1) | 1,428 (+13%) | 9mo | $268,000 | $188 | 46 |
| 15515 Fall Briar Dr | 0.71mi | 3/2.0 | 1,357 (+8%) | 13mo | $195,000 | $144 | 43 |
| 6638 Villarreal Dr | 0.68mi | 4/2.0 (+1) | 1,379 (+9%) | 14mo | $189,900 | $138 | 36 |
| 6731 Briargate Dr | 0.48mi | 3/2.0 | 1,450 (+15%) | 20mo | $213,750 | $147 | 36 |
Match score weights: distance 35% · size 25% · config 20% · recency 20%. Top-matched comps best support the ARV.
Projected returns pro-forma
-1.21% appreciation · 1.54% rent growth · sell at horizon
- IRR
- -7.6%
- Equity multiple
- 0.68×
- Total profit
- $-18,039
- Equity at exit
- $46,199
- IRR
- -2.0%
- Equity multiple
- 0.83×
- Total profit
- $-9,580
- Equity at exit
- $46,783
Cash invested: $55,972 (down + closing). Projections, not guarantees.
Landlord ↔ Tenant lean methodology
- Overall (STATE)
- 87 Strongly Landlord-Friendly
- State Texas
- 87 Strongly Landlord-Friendly · R+5
- County
- — inherits STATE
- City
- — inherits STATE
ZIP-level market 77085
- Home prices YoY
- -0.5%
- Rents YoY
- 1.5%
- Active inventory
- 37
- Price-to-rent
- 9.5×
Monthly cashflow live
- Estimated rent
- $1,760 high interval (Pro) →
- Mortgage (P&I)
- −$1,048
- Tax from tax record
- −$235 /mo · $2,824/yr
- Insurance
- −$83
- HOA
- −$0
- Vacancy / Maint / Mgmt
- −$370
- Net cashflow
- $23
Break-even live
UW: 25.0% down · 7.5% · 30yr · 1.5% tax · 5.0% vac · 8.0% maint · 8.0% mgmt
Financing live
Cash to close
- Down payment
- $49,975
- Closing costs
- $5,997
- Reserves months
- —
- Total cash needed
- —
Loan-product check · same deal, 3 products live
Conventional
25% down · 7.5% · 30yr
- Down + closing
- —
- Monthly P&I
- —
- Monthly cashflow
- —
- DSCR
- —
- Eligible?
- —
Personal DTI + credit; lowest rate.
DSCR
20% down · 8.5% · 30yr
- Down + closing
- —
- Monthly P&I
- —
- Monthly cashflow
- —
- DSCR
- —
- Eligible?
- —
No personal income docs; deal must DSCR.
Hard money
10% down · 12.0% · 12mo
- Down + closing
- —
- Monthly P&I
- —
- Monthly cashflow
- —
- DSCR
- —
- Eligible?
- —
Short-term bridge; refi at stabilization.
Rent comps 19 comps
| Address | Beds | Baths | Sqft | Rent | $/sqft | DOM | Units | Dist |
|---|---|---|---|---|---|---|---|---|
| 6610 Rowell Ct Missouri City, TX | 3.0 | 2.0 | 1753 | $2,056 | $1.17 | 5d | 1 | 0.40mi |
| 6406 Summer Ridge Dr Missouri City, TX | 3.0 | 2.0 | 1624 | $1,958 | $1.21 | 3d | 1 | 0.49mi |
| 13960 Hillcroft St Unit 425 Houston, TX | 2.0 | 2.0 | 1332 | $1,540 | $1.16 | 8d | 1 | 0.98mi |
| 13960 Hillcroft St Unit 14017 Houston, TX | 2.0 | 2.0 | 1332 | $1,540 | $1.16 | 16d | 1 | 0.98mi |
| 13960 Hillcroft St Unit 2174 Houston, TX | 2.0 | 2.0 | 1332 | $1,532 | $1.15 | 3d | 1 | 0.98mi |
| 5721 Melanite Ave Houston, TX | 3.0 | 1.5 | 1634 | $1,481 | $0.91 | 20d | 1 | 1.07mi |
| 13939 Hillcroft Ave Houston, TX | 1.0–3.0 | 1.0–2.0 | 985 | $2,254 | $2.29 | 3d | 22 | 1.14mi |
| 13939 Hillcroft Ave Unit 13976 Houston, TX | 2.0 | 2.0 | 1089 | $1,703 | $1.56 | 21d | 1 | 1.14mi |
| 13939 Hillcroft Ave Unit 13972 Houston, TX | 3.0 | 2.0 | 1404 | $2,164 | $1.54 | 21d | 1 | 1.14mi |
| 16211 Corsair Rd Houston, TX | 3.0 | 2.0 | 1139 | $1,813 | $1.59 | 24d | 1 | 1.15mi |
| 15703 Baybriar Dr Missouri City, TX | 3.0 | 2.0 | 1252 | $1,615 | $1.29 | 20d | 1 | 1.16mi |
| 15823 Baybriar Dr Missouri City, TX | 3.0 | 2.0 | 1335 | $1,641 | $1.23 | 5d | 1 | 1.31mi |
| 16432 Chimney Rock Rd Unit 2174 Houston, TX | 2.0 | 2.0 | 1026 | $1,327 | $1.29 | 10d | 1 | 1.46mi |
| 16432 Chimney Rock Rd Unit 16489 Houston, TX | 2.0 | 2.0 | 1026 | $1,317 | $1.28 | 44d | 1 | 1.46mi |
| 16432 Chimney Rock Rd Unit 2112 Houston, TX | 2.0 | 2.0 | 1026 | $1,284 | $1.25 | 3d | 1 | 1.46mi |
| 16432 Chimney Rock Rd Unit 3174 Houston, TX | 3.0 | 2.0 | 1349 | $1,513 | $1.12 | 10d | 1 | 1.46mi |
| 16432 Chimney Rock Rd Apt 424 Houston, TX | 2.0 | 2.0 | 1026 | $1,292 | $1.26 | 5d | 1 | 1.46mi |
| 16432 Chimney Rock Rd Unit 3112 Houston, TX | 3.0 | 2.0 | 1349 | $1,481 | $1.10 | 3d | 1 | 1.46mi |
| 16432 Chimney Rock Rd Unit 16465 Houston, TX | 3.0 | 2.0 | 1349 | $1,524 | $1.13 | 44d | 1 | 1.46mi |
Listing history 42 events
-
2026-06-18days on market $199,900 Active 52 DOM
-
2026-06-17days on market $199,900 Active 51 DOM
-
2026-06-16days on market $199,900 Active 50 DOM
-
2026-06-15days on market $199,900 Active 49 DOM
-
2026-06-13days on market $199,900 Active 47 DOM
-
2026-06-09days on market $199,900 Active 43 DOM
-
2026-06-07days on market $199,900 Active 41 DOM
-
2026-06-04days on market $199,900 Active 38 DOM
-
2026-06-03days on market $199,900 Active 37 DOM
-
2026-06-02days on market $199,900 Active 36 DOM
-
2026-06-01pricedays on market $199,900 Active 35 DOM
-
2026-05-31days on market $202,000 Active 34 DOM
-
2026-04-27$205,000 Active 583-char remark
-
2025-04-02historical $1,650
-
2025-04-01historical
-
2025-03-25price $1,650
-
2025-03-19$188,000 Active
-
2025-03-19historical
-
2025-03-04price $1,699
-
2025-03-01status Active
-
2025-02-28historical
-
2025-02-19price $1,700
-
2025-02-19price $190,000
-
2025-02-09$1,725
-
2025-01-24price $192,000
-
2025-01-13price $195,000
-
2024-12-19$198,000 Active
-
2021-01-15soldstatus Sold
-
2020-12-28status Pending
-
2020-12-27status Active
-
2020-12-27status Pending
-
2020-12-26$119,000 Active
-
2019-01-25soldstatus Sold
-
2019-01-25soldstatus
-
2018-12-26status Pending
-
2018-12-17status Option Pending
-
2018-12-12$115,000 Active
-
2010-07-12historical
-
2010-07-11$950
-
2009-06-22historical
-
2008-12-10$76,000
-
2005-01-06soldstatus
ⓘ Source: listings_history table (triggers on properties + properties_extension) + one-shot
backfill from property_details.listing_events for pre-trigger history.
Tax reassessment forecast TX · Resets to sale price
- Current annual tax
- $2,824 · $235/mo
- Projected year-2 tax
- $3,658 · $305/mo
- Expected delta
- +$834/yr (+$70/mo · 29.5%)
ⓘ Screening estimate from a state-policy table — verify with the county assessor before closing.
Climate risk First Street
- Flood 1/10 Low FEMA zone X (unshaded) · 0% chance over 30 yrs
- Wildfire 2/10 Low
- Heat 9/10 Extreme 7 d/yr ≥110°F today · 23 d/yr by 30 yrs out
- Wind 9/10 Extreme 99% chance of damaging wind over 30 yrs
- Air quality 3/10 Moderate 2 unhealthy d/yr today · 3 by 30 yrs out
Nearby sold comps map
Loading sold comps map…
Walkable amenities ~0.75 mi
Loading nearby amenities…
Taxation est. · year 1
- Rental income
- $21,115
- − Mortgage interest
- −$11,198
- − Property taxes
- −$2,824
- − Insurance
- −$1,000
- − Repairs & maintenance
- −$1,689
- − Management
- −$1,689
- − Depreciation
- −$5,815
- Taxable loss
- −$3,100
- Est. tax savings @ 24.0%
- +$744
- After-tax cash flow
- $1,022/yr
For passive investors: Depreciation is non-cash, so a rental often shows a tax loss while cash-flowing — sheltering income. Rental losses are passive: they offset passive income freely, and up to $25,000/yr can offset ordinary (W-2) income if you actively participate and your MAGI is under $100k (phasing out to $0 by $150k); unused losses carry forward. On sale, claimed depreciation is recaptured at up to 25%, and gains may owe capital-gains tax (a 1031 exchange can defer both). Figures are a year-1 estimate at your 24.0% rate — not tax advice; consult a CPA.
Schools (NCES district)
- District
- Fort Bend ISD
- NCES district ID
- 4819650
- Math proficiency
- 44% ▼ -15.00%
- Reading proficiency
- 53% ▼ -4.00%
- Median HH income
- $82,360
- Composite
- 44.61/100
- National rank
- #2779
- State rank
- #140 of 826 in TX
Livability — Houston
- Score
- 74/100
- State rank
- #184
- US rank
- #4771
Category grades
Schools grade is shown separately in the Schools card above.
Census & demographics
- Census place
- Houston, TX
- County
- Harris County · 4,702,590 people
- City population
- 3,226,434
- Metro
- Houston-The Woodlands-Sugar Land, TX
- Population (ZIP)
- 16,513
- Household income
- $68,470
- Rent vs Own
- Severe rent burden
- 519.0
Population outlook (Fort Bend County) Hauer SSP2
- Today (2025)
- 1,004,526 people
- By 2030
- 1,153,104 · +14.8%
- By 2040
- 1,453,718 · +44.7%
- By 2050
- 1,753,781 · +74.6%
- By 2075
- 2,455,772 · +144.5%
- By 2100
- 2,930,528 · +191.7%
Race, ethnicity, and origin ACS 2023
- Neighborhood character
- Majority Hispanic (64%)
- Race & ethnicity
- Hispanic / Latino 64% Black 28% Two or more races 19% Native American 6% White 5% Asian 2%
- Hispanic origin (detail)
- Mexican 41%
- Common ancestry
- Italian 1%
- Foreign-born
- 32% · Canada, Vietnam, Dominican Republic
- Languages at home
- 38% English-only · Spanish 57% Other Indo-European 1% Vietnamese 1%
Political lean MEDSL · Fort Bend
- 2024 margin
- Toss-up / Even · D 49.5% · R 47.9% · Other 2.6%
- 2008→2024 swing
- +4.0pp toward D · 2008: -2.4pp · 2024: 1.6pp
- All cycles
- 2024: D+1.6 2020: D+10.6 2016: D+6.6 2012: R+6.8 2008: R+2.4
Not yet ingested
- Civics
- —
Market trends
- HPI YoY
- ▼ -1.21%
- Current HPI
- 254.3084
- Rent YoY
- ▲ 1.54%
- Metro
- Houston-The Woodlands-Sugar Land, TX
- State GDP YoY
- ▲ 3.95%
- F500 in state
- 110
Industry mix (Fortune 500 HQ in TX)
| Industry | F500 HQs | Revenue |
|---|---|---|
| Energy | 16 | $1,198B |
|
||
| Technology | 5 | $198B |
|
||
| Engineering / Construction | 4 | $72B |
|
||
| Energy Services | 3 | $60B |
|
||
| Utilities | 3 | $41B |
|
||
| Healthcare | 2 | $330B |
|
||
Price history
+163.0% since first listed32 events — show timeline
- 2026-06-01 Price Changed $199,900 HARMLS
- 2026-05-20 Price Changed $202,000 HARMLS
- 2026-04-27 Listed $205,000 HARMLS
- 2025-04-02 Rental Removed $1,650 HARMLS
- 2025-04-01 Listing Removed — HARMLS
- 2025-03-25 Price Changed $1,650 HARMLS
- 2025-03-19 Listing Removed — HARMLS
- 2025-03-19 Listed $188,000 HARMLS
- 2025-03-04 Price Changed $1,699 HARMLS
- 2025-03-01 Relisted — HARMLS
- 2025-02-28 Listing Removed — HARMLS
- 2025-02-19 Price Changed $1,700 HARMLS
- 2025-02-19 Price Changed $190,000 HARMLS
- 2025-02-09 Listed for Rent $1,725 HARMLS
- 2025-01-24 Price Changed $192,000 HARMLS
- 2025-01-13 Price Changed $195,000 HARMLS
- 2024-12-19 Listed $198,000 HARMLS
- 2021-01-15 Sold (MLS) — HARMLS
- 2020-12-28 Pending — HARMLS
- 2020-12-27 Relisted — HARMLS
- 2020-12-27 Pending — HARMLS
- 2020-12-26 Listed $119,000 HARMLS
- 2019-01-25 Sold (Public Records) — Public Records
- 2019-01-25 Sold (MLS) — HARMLS
- 2018-12-26 Pending — HARMLS
- 2018-12-17 Pending — HARMLS
- 2018-12-12 Listed $115,000 HARMLS
- 2010-07-12 Listing Removed — HARMLS
- 2010-07-11 Listed $950 HARMLS
- 2009-06-22 Listing Removed — HARMLS
- 2008-12-10 Listed $76,000 HARMLS
- 2005-01-06 Sold (Public Records) — Public Records
Property tax history
+1.7%/yrLatest (2025): $2,824 · +6.3% YoY. Source: county tax records.
Cash-flow waterfall
monthlySold comps — $/sqft
last 12 mo · ≤1 miLoading sold comps…