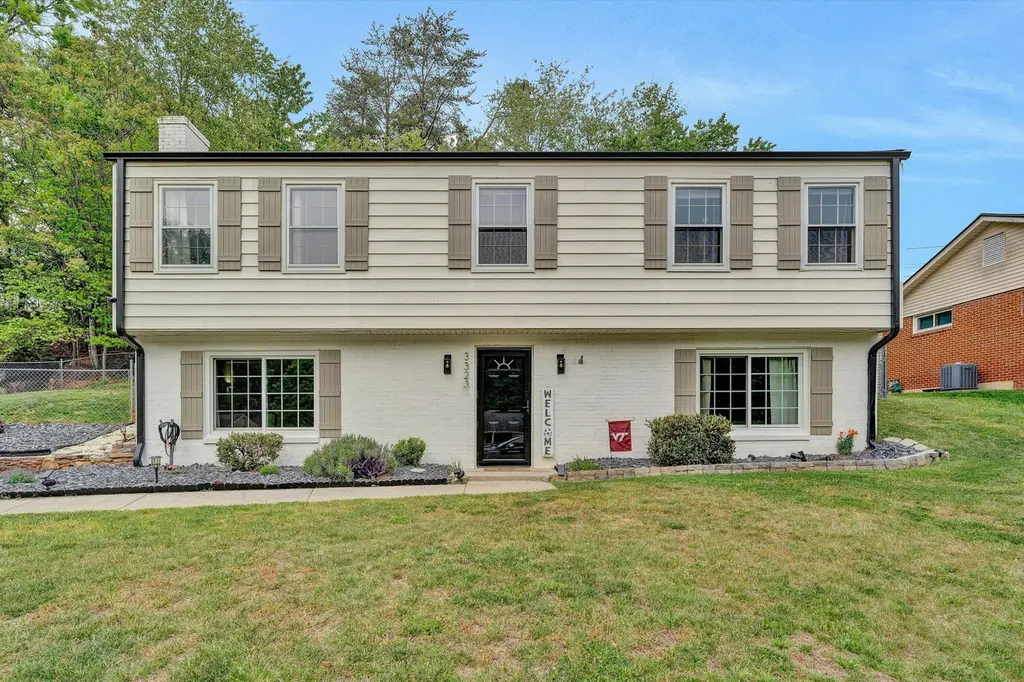
3323 Longhorn Rd · Cave Spring, VA
Flood risk 1/10 · Minimal
- FEMA flood zone
- X (unshaded)
- Chance of flooding over 30 yrs
- 0.0%
- Est. flood insurance / yr
- $473 – $860
Fire risk 2/10 · Minimal
- Est. fire insurance / yr
- $666 – $1,236
Heat risk 5/10 · Moderate
- Hot days now (above 98°F)
- 7 days/yr
- Hot days in 30 yrs
- 19 days/yr
Wind risk 2/10 · Minimal
- Chance of severe wind over 30 yrs
- 1.0%
Air-quality risk 2/10 · Minimal
- Unhealthy air days now
- 0 days/yr
- Unhealthy air days in 30 yrs
- 1 days/yr
Risk factors via First Street. Map © Google.
Why this score? — see what drove the D- grade
The composite is a weighted blend of 9 inputs, each scored 0–100. Each bar is that input's sub-score; the figure is the points it added to the 100-point composite (weight × sub-score).
- Cash flow +9.5/30.0
- ARV discount +7.9/15.0
- Schools +6.4/10.0
- Livability +3.8/5.0
- Rent growth +3.2/5.0
- DSCR +2.7/10.0
- Condition / age +2.5/5.0
- 1% rule +2.2/10.0
- Appreciation +0.0/10.0
$325,000
🖨 Deal sheet (PDF) 📄 Offer letter ✓ Due diligence
Listing remarks MLS
ABSOLUTELY BEAUTIFUL! THIS HOME IS IMMACULATE. MANY NEW FEATURES. NEW CARPET, FRESH PAINT, NEW DRAWER & CABINET PULLS, NEW FAUCETS, NEW KITCHEN SINK, NEW PLEATED SHADES, NEW FRONT DOOR
Key facts
- Quiet cul-de-sac
- Outdoor entertaining
- 0.3 acre lot
Tags
Property features AI
Exterior
- Home design: Residential property; Built in 1976
- Construction: Year built 1976
- Exterior features: Lot approximately 0.3 acres (13,068 sq ft); Community restaurant nearby
Interior
- Kitchen: Built-in microwave
- Bedrooms: 4 bedrooms total; 2 main-level bedrooms
- Flooring: Carpet
- Bathrooms: 2 full bathrooms; 1 main-level bathroom
- Heating & cooling: Heat pump electric heating; Heat pump electric cooling; Has heating and cooling
- Interior features: Built-in microwave oven; Storage; Carpet flooring; Has fireplace (1 total)
Neighborhood map
What this means for you Summary
Snapshot
- This is a 3-bed/2.0-bath single-family listed at $325k.
Deal economics
- At list price, monthly cash flow is $-223 ($-3k/yr) — negative.
- To cash-flow at today's rent, offer at most $286k (12.1% below list).
- To meet the 1% rule (rent ≥ 1% of price), the offer needs to be $235k (27.7% below list).
- Recommended offer: $235k (27.7% below list) — sets the bar for 1% rule.
- Cap rate 5.5% vs local median 3.4% in Cave Spring — top-decile yield for the area; either an underpriced asset or a hidden risk that comps aren't pricing in. Stress-test before assuming the spread holds.
Location & tenants
- Location reads 76/100 on livability (#113 in VA, #3,513 nationally) — a middle-class / working-renter tenant base. Strengths: housing A+, health & safety A+, cost of living A-; Watch: amenities F, commute F.
- Roanoke County Public School District (suburban): math 71% / reading 78% proficiency, ranked #9 of 131 in VA (top 7%) — strong family-tenant draw, lease renewals of 3-5y typical.
- Zoned schools: Oak Grove Elementary (math 77% / reading 77%, grade A, #171 of 1,108 statewide, top 17%, 415 students, 38% FRL); Hidden Valley Middle (math 76% / reading 83%, grade A+, #28 of 342 statewide, top 8%, 578 students, 26% FRL); Hidden Valley High (math 90% / reading 92%, grade A+, #5 of 319 statewide, top 1%, 830 students, 24% FRL).
- Market conditions: Rents rising (+2.9%/yr); 339 active listings in the ZIP; 2 comparable units currently listed for rent nearby; solid renter incomes; 360 units permitted in Roanoke County in 2024 (228 in 5+ unit buildings).
- This rent runs 31% of the median local income ($91k/yr) — at the standard rent-burdened threshold; future hikes will face affordability resistance.
Forward outlook
- Local home prices are declining (-3.0%/yr); year-one equity from $2k of loan paydown is wiped out by about $10k of value loss. Plan a longer hold.
- Roanoke County population projected at +5% by 2050 — modest demand growth; plan on rents tracking national, not racing it.
Negotiation context
- It's been on market 36 days — a 3% lower offer ($315k) is reasonable based on typical stale-listing flexibility.
- 2 sale attempts since 26y ago with the ask held roughly flat each time — persistent listings suggest the price (not the market) is what's stuck; bring a comps-based counter.
- Current owner paid $213k; list at $325k implies a 53% gain — meaningful room to come down on a strong offer.
Risks & watch-outs
- Climate carrying-cost: extreme-heat days projected 7→19/yr by 2055 (HVAC capex compounding) — expect insurance premiums to compound above CPI over the hold.
Questions for the listing agent
- What do current leases actually rent for vs. the listed asking? Can we see a recent rent roll and the last 12 months of T-12 income?
- It's been on market 36 days. Have you received any prior offers? Is the seller open to a 28% concession, seller financing, or rate buy-down credit?
- Built in 1976 — when were the roof, HVAC, electrical panel, plumbing, and water heater last replaced?
- Is there a deadline driving the sale (1031 exchange, divorce, estate, relocation)? That informs how much negotiation room exists.
- Schools are A-rated — typically a magnet for longer-tenancy family renters. What's the average tenant stay here, and is there a school-zone premium baked into asking?
- The area grade is low — what's the realistic commute time and amenity access for the typical tenant pool here? Any planned neighborhood developments (good or bad) we should know about?
- What's the average days-on-market for RENTAL listings here right now (not sales)? A rising rental-DOM trend means longer vacancies and softer asking-rent achievability than the comps imply.
- What's the recent tenant-quality profile in this submarket — average credit score on applications, eviction rate, late-payment / NSF rate, and stable-employment percentage? A property-management company in the area should have these aggregated.
- How much new for-sale + rental construction is in the pipeline within 1–3 miles? Heavy new supply typically softens prices + rents 12–24 months out; constrained supply supports both.
Investment metrics
- 1% rule
- 0.72% ✗
- Cap rate
- 5.47%
- Cash-on-cash
- -2.94%
- DSCR
- 0.87
- GRM
- 11.5
CMA / ARV
- ARV (median comp)
- $327,927
- List price
- $325,000
- Delta
- -0.89%
- Verdict
- FAIR
- Comps
- 20 within 1.0 mi
Show comp detail 12 sales within ~0.75 mi
| Address | Dist | Beds/Ba | Sqft | Sold | Price | $/sf | Match |
|---|---|---|---|---|---|---|---|
| 5712 Littlehorn Dr | 0.22mi | 3/2.0 | 1,680 (-14%) | 2mo | $260,000 | $155 | 64 |
| 3153 Shorthorn Dr SW | 0.40mi | 3/2.0 | 2,108 (+7%) | 9mo | $250,000 | $119 | 62 |
| 2540 Mcvitty Rd SW | 0.68mi | 4/2.0 (+1) | 1,929 (-2%) | 2mo | $300,000 | $156 | 59 |
| 3138 Galloway Dr | 0.30mi | 4/2.0 (+1) | 2,244 (+14%) | 2mo | $339,000 | $151 | 56 |
| 5217 Lipps Rd | 0.69mi | 3/2.0 | 2,092 (+6%) | 7mo | $350,000 | $167 | 51 |
| 5365 Gieser Rd | 0.54mi | 3/2.5 | 2,141 (+9%) | 12mo | $369,950 | $173 | 48 |
| 6560 Forest View Rd | 0.63mi | 3/2.5 | 2,113 (+8%) | 18mo | $315,000 | $149 | 41 |
| 2762 Mcvitty Rd | 0.69mi | 3/3.5 | 2,152 (+10%) | 9mo | $530,000 | $246 | 39 |
| 4602 Cresthill Dr | 0.68mi | 3/2.0 | 2,200 (+12%) | 13mo | $350,000 | $159 | 38 |
| 2604 Mcvitty Rd | 0.66mi | 4/2.0 (+1) | 1,738 (-12%) | 11mo | $373,000 | $215 | 36 |
| 5220 Lipps Rd | 0.71mi | 2/3.0 (-1) | 2,040 (+4%) | 20mo | $310,000 | $152 | 35 |
| 2768 Mcvitty Rd | 0.72mi | 3/3.5 | 2,152 (+10%) | 15mo | $499,950 | $232 | 32 |
Match score weights: distance 35% · size 25% · config 20% · recency 20%. Top-matched comps best support the ARV.
Projected returns pro-forma
-3.0% appreciation · 2.88% rent growth · sell at horizon
- IRR
- -21.4%
- Equity multiple
- 0.26×
- Total profit
- $-67,233
- Equity at exit
- $48,459
- IRR
- -15.3%
- Equity multiple
- 0.14×
- Total profit
- $-78,287
- Equity at exit
- $28,100
Cash invested: $91,000 (down + closing). Projections, not guarantees.
Landlord ↔ Tenant lean methodology
- Overall (STATE)
- 55 Moderately Landlord-Leaning
- State Virginia
- 55 Moderately Landlord-Leaning · D+2
- County
- — inherits STATE
- City
- — inherits STATE
ZIP-level market 24018
- Rents YoY
- 2.9%
- Active inventory
- 339
- Price-to-rent
- 11.5×
Monthly cashflow live
- Estimated rent
- $2,349 medium interval (Pro) →
- Mortgage (P&I)
- −$1,704
- Tax from tax record
- −$239 /mo · $2,866/yr
- Insurance
- −$135
- HOA
- −$0
- Vacancy / Maint / Mgmt
- −$493
- Net cashflow
- $-223
Break-even live
Sensitivity live
| Price | -10% $-39 | -5% $-131 | +0% $-223 | +5% $-315 | +10% $-407 |
|---|---|---|---|---|---|
| Rent | -10% $-409 | -5% $-316 | +0% $-223 | +5% $-130 | +10% $-38 |
| Rate | -1.0pp $-60 | -0.5pp $-141 | base $-223 | +0.5pp $-307 | +1.0pp $-393 |
UW: 25.0% down · 7.5% · 30yr · 1.5% tax · 5.0% vac · 8.0% maint · 8.0% mgmt
Financing live
Cash to close
- Down payment
- $81,250
- Closing costs
- $9,750
- Reserves months
- —
- Total cash needed
- —
Loan-product check · same deal, 3 products live
Conventional
25% down · 7.5% · 30yr
- Down + closing
- —
- Monthly P&I
- —
- Monthly cashflow
- —
- DSCR
- —
- Eligible?
- —
Personal DTI + credit; lowest rate.
DSCR
20% down · 8.5% · 30yr
- Down + closing
- —
- Monthly P&I
- —
- Monthly cashflow
- —
- DSCR
- —
- Eligible?
- —
No personal income docs; deal must DSCR.
Hard money
10% down · 12.0% · 12mo
- Down + closing
- —
- Monthly P&I
- —
- Monthly cashflow
- —
- DSCR
- —
- Eligible?
- —
Short-term bridge; refi at stabilization.
Rent comps 2 comps
| Address | Beds | Baths | Sqft | Rent | $/sqft | DOM | Units | Dist |
|---|---|---|---|---|---|---|---|---|
| 5220 Lakeland Dr Roanoke, VA | 3.0 | 2.5 | 2000 | $2,695 | $1.35 | 46d | 1 | 0.75mi |
| 5204 Lakeland Dr Roanoke, VA | 3.0 | 2.5 | 2000 | $2,595 | $1.30 | 46d | 1 | 0.78mi |
Listing history 11 events
-
2026-06-01statusdays on market $325,000 Pending 36 DOM
-
2026-05-31days on market $325,000 Active 35 DOM
-
2026-05-30days on market $325,000 Active 34 DOM
-
2026-04-17$337,750 Active 1150-char remark
-
2021-05-14soldstatus $212,800
-
2003-06-01soldstatus $135,000
-
2000-06-29soldstatus $129,000 190-char remark
Show marketing remark (190 chars)
ABSOLUTELY BEAUTIFUL! THIS HOME IS IMMACULATE. MANY NEW FEATURES. NEW CARPET, FRESH PAINT, NEW DRAWER & CABINET PULLS, NEW FAUCETS, NEW KITCHEN SINK, NEW PLEATED SHADES, NEW FRONT DOOR
-
2000-06-01soldstatus $129,000
-
2000-02-09$124,950 190-char remark
Show marketing remark (190 chars)
ABSOLUTELY BEAUTIFUL! THIS HOME IS IMMACULATE. MANY NEW FEATURES. NEW CARPET, FRESH PAINT, NEW DRAWER & CABINET PULLS, NEW FAUCETS, NEW KITCHEN SINK, NEW PLEATED SHADES, NEW FRONT DOOR
-
1998-01-01soldstatus $115,000
-
1992-03-01soldstatus $94,900
ⓘ Source: listings_history table (triggers on properties + properties_extension) + one-shot
backfill from property_details.listing_events for pre-trigger history.
Tax reassessment forecast VA · Resets to sale price
- Current annual tax
- $2,866 · $239/mo
- Projected year-2 tax
- $2,866 · $239/mo
- Expected delta
- $0/yr ($0/mo · 0.0%)
ⓘ Screening estimate from a state-policy table — verify with the county assessor before closing.
Climate risk First Street
- Flood 1/10 Low FEMA zone X (unshaded) · 0% chance over 30 yrs
- Wildfire 2/10 Low
- Heat 5/10 Major 7 d/yr ≥98°F today · 19 d/yr by 30 yrs out
- Wind 2/10 Low 100% chance of damaging wind over 30 yrs
- Air quality 2/10 Low 0 unhealthy d/yr today · 1 by 30 yrs out
Nearby sold comps map
Loading sold comps map…
Walkable amenities ~0.75 mi
Loading nearby amenities…
Taxation est. · year 1
- Rental income
- $28,183
- − Mortgage interest
- −$18,205
- − Property taxes
- −$2,866
- − Insurance
- −$1,625
- − Repairs & maintenance
- −$2,255
- − Management
- −$2,255
- − Depreciation
- −$9,455
- Taxable loss
- −$8,477
- Est. tax savings @ 24.0%
- +$2,035
- After-tax cash flow
- $-644/yr
For passive investors: Depreciation is non-cash, so a rental often shows a tax loss while cash-flowing — sheltering income. Rental losses are passive: they offset passive income freely, and up to $25,000/yr can offset ordinary (W-2) income if you actively participate and your MAGI is under $100k (phasing out to $0 by $150k); unused losses carry forward. On sale, claimed depreciation is recaptured at up to 25%, and gains may owe capital-gains tax (a 1031 exchange can defer both). Figures are a year-1 estimate at your 24.0% rate — not tax advice; consult a CPA.
Schools (NCES district)
- District
- Roanoke County Public School District
- NCES district ID
- 5103330
- Math proficiency
- 71% ▼ -19.00%
- Reading proficiency
- 78% ▼ -6.00%
- Median HH income
- $60,526
- Composite
- 64.08/100
- National rank
- #578
- State rank
- #9 of 131 in VA
Livability — Cave Spring
- Score
- 76/100
- State rank
- #113
- US rank
- #3513
Category grades
Schools grade is shown separately in the Schools card above.
Census & demographics
- Census place
- Cave Spring, VA
- County
- Roanoke County · 67,305 people
- Metro
- Roanoke, VA
- Population (ZIP)
- 38,720
- Household income
- $90,885
- Rent vs Own
- Severe rent burden
- 495.0
Population outlook (Roanoke County) Hauer SSP2
- Today (2025)
- 98,162 people
- By 2030
- 99,793 · +1.7%
- By 2040
- 101,965 · +3.9%
- By 2050
- 103,328 · +5.3%
- By 2075
- 108,641 · +10.7%
- By 2100
- 104,845 · +6.8%
Race, ethnicity, and origin ACS 2023
- Neighborhood character
- Predominantly White (83%)
- Race & ethnicity
- White 83% Asian 6% Hispanic / Latino 4% Two or more races 4% Black 4%
- Common ancestry
- Italian 4% Slovak 3% Serbian 3%
- Foreign-born
- 10% · Canada, China, Vietnam
- Languages at home
- 86% English-only · Spanish 5% Other Indo-European 3% Other Asian/Pacific 1%
Political lean MEDSL · Roanoke
- 2024 margin
- Strong R (+22.5) · D 38.2% · R 60.7% · Other 1.1%
- 2008→2024 swing
- -1.4pp toward R · 2008: -21.1pp · 2024: -22.5pp
- All cycles
- 2024: R+22.5 2020: R+21.8 2016: R+28.1 2012: R+25.6 2008: R+21.1
Not yet ingested
- Civics
- —
Market trends
- HPI YoY
- ▼ -266.18%
- Current HPI
- 176.0558
- Rent YoY
- ▲ 2.88%
- Metro
- Roanoke, VA
- State GDP YoY
- ▲ 2.40%
- F500 in state
- 50
Industry mix (Fortune 500 HQ in VA)
| Industry | F500 HQs | Revenue |
|---|---|---|
| Aerospace / Defense | 4 | $236B |
|
||
| Technology / Defense | 3 | $32B |
|
||
| Financial Services | 2 | $176B |
|
||
| Utilities | 2 | $27B |
|
||
| Insurance | 2 | $25B |
|
||
| Technology | 2 | $15B |
|
||
Price history
+242.5% since first listed10 events — show timeline
- 2026-06-01 Pending — MLSRV
- 2026-05-28 Price Changed $325,000 MLSRV
- 2026-04-17 Listed $337,750 MLSRV
- 2021-05-14 Sold (Public Records) $212,800 Public Records
- 2003-06-01 Sold (Public Records) $135,000 Public Records
- 2000-06-29 Sold (MLS) $129,000 MLSRV
- 2000-06-01 Sold (Public Records) $129,000 Public Records
- 2000-02-09 Listed $124,950 MLSRV
- 1998-01-01 Sold (Public Records) $115,000 Public Records
- 1992-03-01 Sold (Public Records) $94,900 Public Records
Property tax history
+4.5%/yrLatest (2025): $2,866 · +5.9% YoY. Source: county tax records.
Cash-flow waterfall
monthlySold comps — $/sqft
last 12 mo · ≤1 miLoading sold comps…