211 Arrowhead Rd · Willard, MO
Flood risk 1/10 · Minimal
- FEMA flood zone
- X (unshaded)
- Chance of flooding over 30 yrs
- 0.0%
- Est. flood insurance / yr
- $507 – $1,088
Fire risk 4/10 · Minor
- Est. fire insurance / yr
- $1,054 – $1,958
Heat risk 5/10 · Moderate
- Hot days now (above 105°F)
- 7 days/yr
- Hot days in 30 yrs
- 20 days/yr
Wind risk 2/10 · Minimal
- Chance of severe wind over 30 yrs
- 1.0%
Air-quality risk 1/10 · Minimal
- Unhealthy air days now
- 0 days/yr
- Unhealthy air days in 30 yrs
- 0 days/yr
Risk factors via First Street. Map © Google.
Why this score? — see what drove the D- grade
The composite is a weighted blend of 9 inputs, each scored 0–100. Each bar is that input's sub-score; the figure is the points it added to the 100-point composite (weight × sub-score).
- Cash flow +12.4/30.0
- ARV discount +7.5/15.0
- Schools +3.9/10.0
- DSCR +3.7/10.0
- Livability +3.7/5.0
- 1% rule +2.8/10.0
- Rent growth +2.5/5.0
- Condition / age +2.5/5.0
- Appreciation +0.0/10.0
$220,000
🖨 Deal sheet (PDF) 📄 Offer letter ✓ Due diligence
Listing remarks MLS
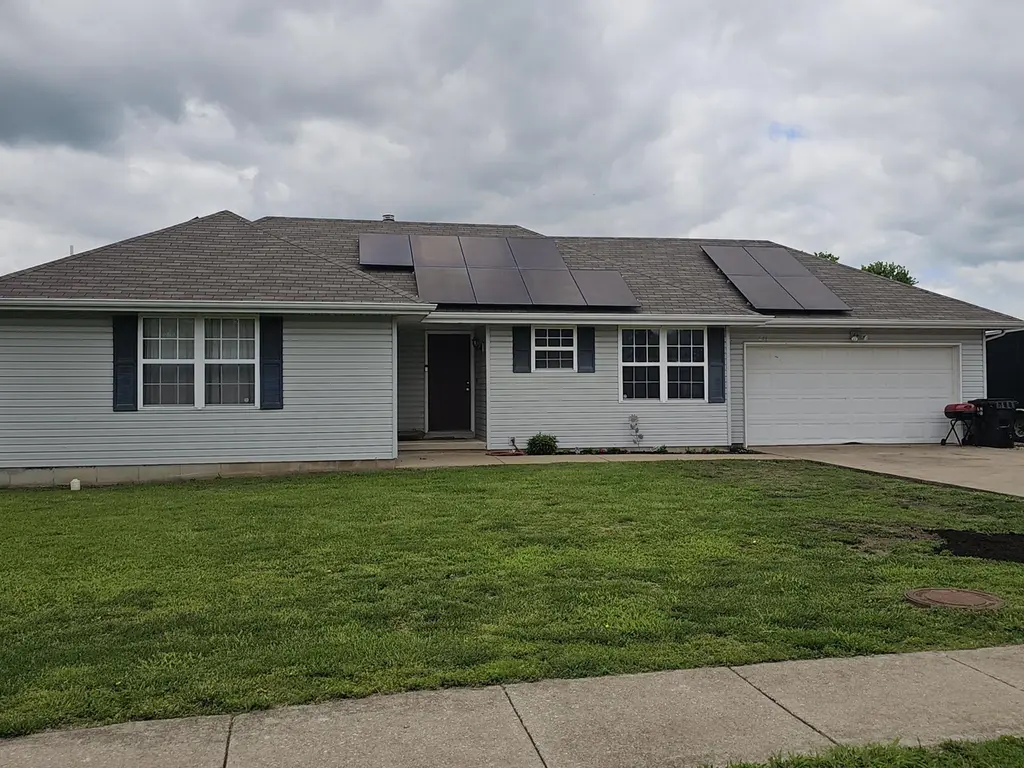
Fantastic 3 Bedroom 2 Bath Ranch in the Willard School District. This home is super clean, and very well-maintained. A privacy fence surrounds this home's picture-perfect backyard. Homes in this price range do not last long. Call for your showing today!
Key facts
- Near shopping
- Near local park
- New solar panels
Tags
Property features AI
Exterior
- Parking: 2-car garage (garage faces front)
- Utilities: Public water; Public sewer
- Home design: Single family residence; One story
- Construction: Vinyl siding; Composition roof
- Exterior features: Patio; Privacy fencing; Public maintained road access; City street frontage; Solar panels
Interior
- Kitchen: Dishwasher; Microwave; Refrigerator; Electric oven
- Flooring: Carpet; Tile
- Bathrooms: 2 full bathrooms
- Heating & cooling: Central heating (natural gas); Central air conditioning
- Interior features: Ceiling fan(s); Disposal; Dishwasher; Microwave; Refrigerator; Electric oven / Free-standing electric oven
Neighborhood map
What this means for you Summary
Snapshot
- This is a 3-bed/2.0-bath single-family listed at $220k.
Deal economics
- At list price, monthly cash flow is $-37 ($-447/yr) — negative.
- To cash-flow at today's rent, offer at most $213k (3.0% below list).
- To meet the 1% rule (rent ≥ 1% of price), the offer needs to be $172k (21.7% below list).
- Recommended offer: $172k (21.7% below list) — sets the bar for 1% rule.
- Cap rate 6.1% vs local median 3.5% in Willard — top-decile yield for the area; either an underpriced asset or a hidden risk that comps aren't pricing in. Stress-test before assuming the spread holds.
Location & tenants
- Location reads 73/100 on livability (#79 in MO) — a middle-class / working-renter tenant base. Strengths: cost of living A+, housing A+, crime A; Watch: amenities F, commute F, health & safety F.
- Willard R-II (rural): math 41% / reading 50% proficiency, ranked #83 of 324 in MO (top 26%) — families likely to look elsewhere, expect single-tenant / working-renter base with shorter leases.
- Zoned schools: Willard East Elem. (math 57% / reading 57%, grade C+, #159 of 1,115 statewide, top 16%, 326 students, 32% FRL); Willard Middle (math 43% / reading 48%, grade D+, #105 of 391 statewide, top 27%, 741 students, 32% FRL); Willard High (math 37% / reading 60%, grade D, #147 of 521 statewide, top 29%, 1,381 students, 29% FRL) — zoned schools at 31% FRL track the district average.
- Market conditions: 93 active listings in the ZIP; 1,302 units permitted in Greene County in 2024 (250 in 5+ unit buildings).
Forward outlook
- Local home prices are declining (-3.0%/yr); year-one equity from $2k of loan paydown is wiped out by about $7k of value loss. Plan a longer hold.
- Greene County population projected at +25% by 2050 — long-run rental-demand tailwind backs the buy-and-hold thesis.
Negotiation context
- It's been on market 58 days — a 3% lower offer ($213k) is reasonable based on typical stale-listing flexibility.
- 3 sale attempts since 9y ago with the ask held roughly flat each time — persistent listings suggest the price (not the market) is what's stuck; bring a comps-based counter.
Risks & watch-outs
- Climate carrying-cost: extreme-heat days projected 7→20/yr by 2055 (HVAC capex compounding) — expect insurance premiums to compound above CPI over the hold.
Questions for the listing agent
- What do current leases actually rent for vs. the listed asking? Can we see a recent rent roll and the last 12 months of T-12 income?
- It's been on market 58 days. Have you received any prior offers? Is the seller open to a 22% concession, seller financing, or rate buy-down credit?
- Is there a deadline driving the sale (1031 exchange, divorce, estate, relocation)? That informs how much negotiation room exists.
- The area grade is low — what's the realistic commute time and amenity access for the typical tenant pool here? Any planned neighborhood developments (good or bad) we should know about?
- What's the average days-on-market for RENTAL listings here right now (not sales)? A rising rental-DOM trend means longer vacancies and softer asking-rent achievability than the comps imply.
- What's the recent tenant-quality profile in this submarket — average credit score on applications, eviction rate, late-payment / NSF rate, and stable-employment percentage? A property-management company in the area should have these aggregated.
- How much new for-sale + rental construction is in the pipeline within 1–3 miles? Heavy new supply typically softens prices + rents 12–24 months out; constrained supply supports both.
Investment metrics
- 1% rule
- 0.78% ✗
- Cap rate
- 6.09%
- Cash-on-cash
- -0.73%
- DSCR
- 0.97
- GRM
- 10.6
CMA / ARV
- ARV (median comp)
- $220,034
- List price
- $220,000
- Delta
- -0.02%
- Verdict
- FAIR
- Comps
- 20 within 1.0 mi
Show comp detail 12 sales within ~0.75 mi
| Address | Dist | Beds/Ba | Sqft | Sold | Price | $/sf | Match |
|---|---|---|---|---|---|---|---|
| 109 Willowridge Ln | 0.13mi | 3/2.0 | 1,092 (0%) | 1mo | $149,900 | $137 | 94 |
| 105 Sedona Ln | 0.06mi | 3/2.0 | 1,103 (+1%) | 8mo | $225,000 | $204 | 89 |
| 121 Holly Cir | 0.13mi | 3/2.0 | 1,132 (+4%) | 1mo | $229,900 | $203 | 87 |
| 103 Arrowhead Rd | 0.46mi | 3/2.0 | 1,085 (-1%) | 1mo | $215,000 | $198 | 76 |
| 102 Arrowhead Rd | 0.45mi | 3/2.0 | 1,085 (-1%) | 2mo | $215,000 | $198 | 76 |
| 217 Arrowhead Rd | 0.05mi | 3/2.0 | 1,200 (+10%) | 10mo | $229,500 | $191 | 72 |
| 204 Arrowhead Rd | 0.06mi | 3/2.0 | 1,227 (+12%) | 10mo | $214,900 | $175 | 68 |
| 108 W Fall Creek Rd | 0.28mi | 3/2.0 | 1,211 (+11%) | 5mo | $229,000 | $189 | 65 |
| 113 Holly Ridge Rd | 0.16mi | 2/2.0 (-1) | 1,176 (+8%) | 14mo | $215,000 | $183 | 63 |
| 204 Eagle Ln | 0.34mi | 3/2.0 | 1,236 (+13%) | 3mo | $249,900 | $202 | 60 |
| 119 N Grand Prairie Dr | 0.38mi | 3/2.0 | 1,219 (+12%) | 11mo | $219,900 | $180 | 54 |
| 100 Dorcas Dr | 0.51mi | 3/1.0 | 960 (-12%) | 2mo | $185,000 | $193 | 50 |
Match score weights: distance 35% · size 25% · config 20% · recency 20%. Top-matched comps best support the ARV.
Projected returns pro-forma
-3.0% appreciation · 3.0% rent growth · sell at horizon
- IRR
- -17.5%
- Equity multiple
- 0.38×
- Total profit
- $-38,070
- Equity at exit
- $32,803
- IRR
- -9.6%
- Equity multiple
- 0.41×
- Total profit
- $-36,404
- Equity at exit
- $19,022
Cash invested: $61,600 (down + closing). Projections, not guarantees.
Landlord ↔ Tenant lean methodology
- Overall (STATE)
- 81 Strongly Landlord-Friendly
- State Missouri
- 81 Strongly Landlord-Friendly · R+10
- County
- — inherits STATE
- City
- — inherits STATE
ZIP-level market 65781
- Home prices YoY
- -27.1%
- Active inventory
- 93
- Price-to-rent
- 10.6×
Monthly cashflow live
- Estimated rent
- $1,722 medium interval (Pro) →
- Mortgage (P&I)
- −$1,154
- Tax from tax record
- −$152 /mo · $1,828/yr
- Insurance
- −$92
- HOA
- −$0
- Vacancy / Maint / Mgmt
- −$362
- Net cashflow
- $-37
Break-even live
Sensitivity live
| Price | -10% $87 | -5% $25 | +0% $-37 | +5% $-99 | +10% $-162 |
|---|---|---|---|---|---|
| Rent | -10% $-173 | -5% $-105 | +0% $-37 | +5% $31 | +10% $99 |
| Rate | -1.0pp $74 | -0.5pp $19 | base $-37 | +0.5pp $-94 | +1.0pp $-152 |
UW: 25.0% down · 7.5% · 30yr · 1.5% tax · 5.0% vac · 8.0% maint · 8.0% mgmt
Financing live
Cash to close
- Down payment
- $55,000
- Closing costs
- $6,600
- Reserves months
- —
- Total cash needed
- —
Loan-product check · same deal, 3 products live
Conventional
25% down · 7.5% · 30yr
- Down + closing
- —
- Monthly P&I
- —
- Monthly cashflow
- —
- DSCR
- —
- Eligible?
- —
Personal DTI + credit; lowest rate.
DSCR
20% down · 8.5% · 30yr
- Down + closing
- —
- Monthly P&I
- —
- Monthly cashflow
- —
- DSCR
- —
- Eligible?
- —
No personal income docs; deal must DSCR.
Hard money
10% down · 12.0% · 12mo
- Down + closing
- —
- Monthly P&I
- —
- Monthly cashflow
- —
- DSCR
- —
- Eligible?
- —
Short-term bridge; refi at stabilization.
Listing history 23 events
-
2026-06-22days on market $220,000 Active 58 DOM
-
2026-06-18days on market $220,000 Active 55 DOM
-
2026-06-17days on market $220,000 Active 54 DOM
-
2026-06-16days on market $220,000 Active 53 DOM
-
2026-06-15days on market $220,000 Active 52 DOM
-
2026-06-14days on market $220,000 Active 50 DOM
-
2026-06-13days on market $220,000 Active 49 DOM
-
2026-06-10days on market $220,000 Active 47 DOM
-
2026-06-09days on market $220,000 Active 46 DOM
-
2026-06-08days on market $220,000 Active 45 DOM
-
2026-06-07days on market $220,000 Active 44 DOM
-
2026-06-03days on market $220,000 Active 40 DOM
-
2026-06-02days on market $220,000 Active 39 DOM
-
2026-06-01days on market $220,000 Active 38 DOM
-
2026-05-31days on market $220,000 Active 37 DOM
-
2026-05-30pricedays on market $220,000 Active 36 DOM
-
2026-04-24$225,000 Active 546-char remark
-
2017-10-17soldstatus
-
2017-10-13soldstatus 253-char remark
Show marketing remark (253 chars)
Fantastic 3 Bedroom 2 Bath Ranch in the Willard School District. This home is super clean, and very well-maintained. A privacy fence surrounds this home's picture-perfect backyard. Homes in this price range do not last long. Call for your showing today!
-
2017-08-01$110,000 253-char remark
Show marketing remark (253 chars)
Fantastic 3 Bedroom 2 Bath Ranch in the Willard School District. This home is super clean, and very well-maintained. A privacy fence surrounds this home's picture-perfect backyard. Homes in this price range do not last long. Call for your showing today!
-
2017-05-25$110,000
-
2004-02-26soldstatus
-
2003-10-29soldstatus
ⓘ Source: listings_history table (triggers on properties + properties_extension) + one-shot
backfill from property_details.listing_events for pre-trigger history.
Tax reassessment forecast MO · Resets to sale price
- Current annual tax
- $1,828 · $152/mo
- Projected year-2 tax
- $2,134 · $178/mo
- Expected delta
- +$306/yr (+$26/mo · 16.8%)
ⓘ Screening estimate from a state-policy table — verify with the county assessor before closing.
Climate risk First Street
- Flood 1/10 Low FEMA zone X (unshaded) · 0% chance over 30 yrs
- Wildfire 4/10 Moderate
- Heat 5/10 Major 7 d/yr ≥105°F today · 20 d/yr by 30 yrs out
- Wind 2/10 Low 100% chance of damaging wind over 30 yrs
- Air quality 1/10 Low 0 unhealthy d/yr today · 0 by 30 yrs out
Nearby sold comps map
Loading sold comps map…
Walkable amenities ~0.75 mi
Loading nearby amenities…
Taxation est. · year 1
- Rental income
- $20,665
- − Mortgage interest
- −$12,323
- − Property taxes
- −$1,828
- − Insurance
- −$1,100
- − Repairs & maintenance
- −$1,653
- − Management
- −$1,653
- − Depreciation
- −$6,400
- Taxable loss
- −$4,292
- Est. tax savings @ 24.0%
- +$1,030
- After-tax cash flow
- $583/yr
For passive investors: Depreciation is non-cash, so a rental often shows a tax loss while cash-flowing — sheltering income. Rental losses are passive: they offset passive income freely, and up to $25,000/yr can offset ordinary (W-2) income if you actively participate and your MAGI is under $100k (phasing out to $0 by $150k); unused losses carry forward. On sale, claimed depreciation is recaptured at up to 25%, and gains may owe capital-gains tax (a 1031 exchange can defer both). Figures are a year-1 estimate at your 24.0% rate — not tax advice; consult a CPA.
Schools (NCES district)
- District
- Willard R-II
- NCES district ID
- 2932010
- Math proficiency
- 41% ▼ -2.00%
- Reading proficiency
- 50% ▼ -2.00%
- Median HH income
- $50,200
- Composite
- 39.04/100
- National rank
- #4063
- State rank
- #83 of 324 in MO
Livability — Willard
- Score
- 73/100
- State rank
- #79
- US rank
- #5258
Category grades
Schools grade is shown separately in the Schools card above.
Census & demographics
- Census place
- Willard, MO
- Population (ZIP)
- 9,160
Population outlook (Greene County) Hauer SSP2
- Today (2025)
- 319,054 people
- By 2030
- 335,135 · +5.0%
- By 2040
- 366,186 · +14.8%
- By 2050
- 397,431 · +24.6%
- By 2075
- 477,035 · +49.5%
- By 2100
- 520,828 · +63.2%
Race, ethnicity, and origin ACS 2023
- Neighborhood character
- Predominantly White (93%)
- Race & ethnicity
- White 93% Two or more races 5% Hispanic / Latino 4%
- Common ancestry
- Iranian 4% Italian 3% Slovak 2%
- Foreign-born
- 2% · Canada
- Languages at home
- 96% English-only · Spanish 2% Russian/Polish/Slavic 2%
Political lean MEDSL · Greene
- 2024 margin
- Strong R (+20.8) · D 38.9% · R 59.7% · Other 1.4%
- 2008→2024 swing
- -5.0pp toward R · 2008: -15.8pp · 2024: -20.8pp
- All cycles
- 2024: R+20.8 2020: R+20.1 2016: R+27.4 2012: R+24.4 2008: R+15.8
Not yet ingested
- Civics
- —
Market trends
- HPI YoY
- ▼ -80.06%
- Current HPI
- 214.9498
- Rent YoY
- —
- Metro
- —
- State GDP YoY
- ▲ 1.84%
- F500 in state
- 20
Industry mix (Fortune 500 HQ in MO)
| Industry | F500 HQs | Revenue |
|---|---|---|
| Healthcare | 1 | $163B |
|
||
| Insurance | 1 | $21B |
|
||
| Industrial Technology | 1 | $17B |
|
||
| Retail | 1 | $16B |
|
||
| Industrial Distribution | 1 | $10B |
|
||
| Utilities | 1 | $9B |
|
||
Price history
+100.0% since first listed8 events — show timeline
- 2026-05-30 Price Changed $220,000 SOMO
- 2026-04-24 Listed $225,000 SOMO
- 2017-10-17 Sold (Public Records) — Public Records
- 2017-10-13 Sold (MLS) — SOMO
- 2017-08-01 Listed $110,000 SOMO
- 2017-05-25 Listed $110,000 SOMO
- 2004-02-26 Sold (Public Records) — Public Records
- 2003-10-29 Sold (Public Records) — Public Records
Property tax history
+5.2%/yrLatest (2025): $1,828 · +24.2% YoY. Source: county tax records.
Cash-flow waterfall
monthlySold comps — $/sqft
last 12 mo · ≤1 miLoading sold comps…