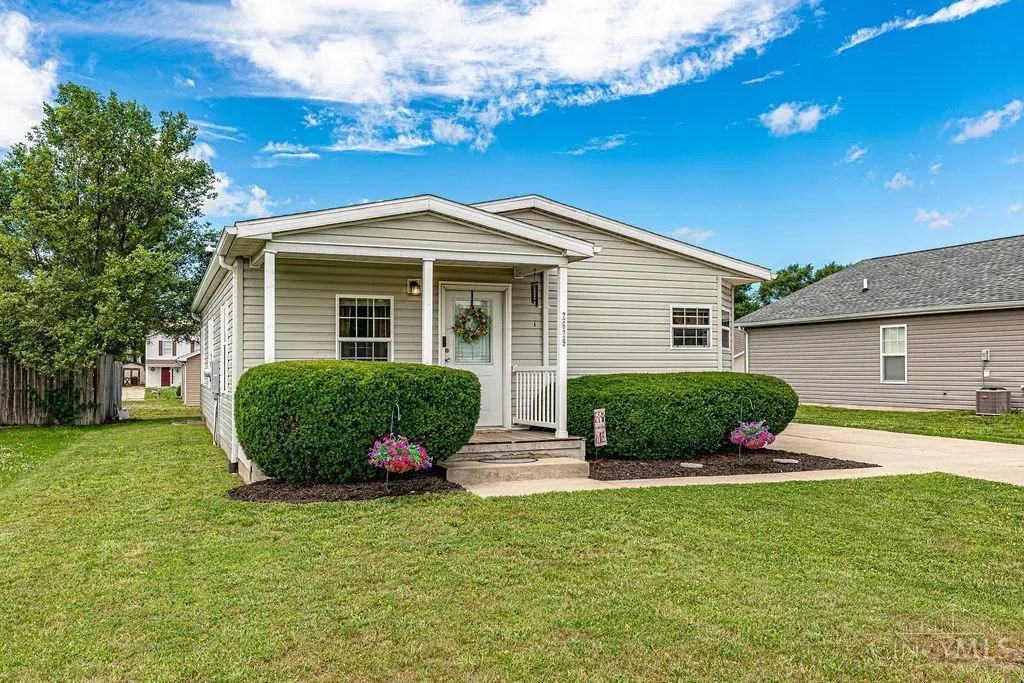
2629 Ruby Ln · Middletown, OH
Flood risk 1/10 · Minimal
- FEMA flood zone
- X
- Chance of flooding over 30 yrs
- 0.0%
- Est. flood insurance / yr
- $507 – $1,088
Fire risk 1/10 · Minimal
- Est. fire insurance / yr
- $713 – $1,323
Heat risk 5/10 · Moderate
- Hot days now (above 103°F)
- 7 days/yr
- Hot days in 30 yrs
- 19 days/yr
Wind risk 2/10 · Minimal
- Chance of severe wind over 30 yrs
- 1.0%
Air-quality risk 3/10 · Minor
- Unhealthy air days now
- 2 days/yr
- Unhealthy air days in 30 yrs
- 3 days/yr
Risk factors via First Street. Map © Google.
Why this score? — see what drove the C+ grade
The composite is a weighted blend of 9 inputs, each scored 0–100. Each bar is that input's sub-score; the figure is the points it added to the 100-point composite (weight × sub-score).
- Cash flow +28.0/30.0
- DSCR +9.9/10.0
- 1% rule +7.3/10.0
- ARV discount +5.6/15.0
- Rent growth +4.1/5.0
- Livability +3.6/5.0
- Condition / age +2.5/5.0
- Schools +2.0/10.0
- Appreciation +0.0/10.0
$205,000
🖨 Deal sheet 📄 Offer letter ✓ Due diligence
Listing remarks
Cozy and comforting this 3 bedroom , 2 bath home is move in ready! Easy one-level living with an open floor, and nicely equipped eat-in kitchen! Come check it out!
Key facts
- 6,360 sq ft lot
- Built 2007
- Listed 5 days
Property features AI
Finance
- Other: Lot about 0.146 acres
- Financial info:
- HOA & community: No HOA
Exterior
- Parking: Driveway parking
- Security:
- Utilities: Public water; Public sewer; Natural gas
- Home design: Traditional single-family home; One level (single-story); Slab foundation
- Construction: Vinyl siding construction; Shingle roof; Slab foundation
- Exterior features: Vinyl windows; Shingle roof; Vinyl siding; Residential zoning
Interior
- Kitchen:
- Bedrooms: Three bedrooms on main level; Primary bedroom approximately 11 x 14; Second bedroom approximately 10 x 12; Third bedroom approximately 11 x 13
- Flooring:
- Bathrooms: Two full bathrooms on main level
- Heating & cooling: Electric heating; Central air conditioning; Electric water heater
- Interior features: 8 total rooms; Entry with a small foyer
- Laundry & utility: Main-level laundry room (about 8 x 13)
Neighborhood map
What this means for you Summary
Snapshot
- This is a 3-bed/2.0-bath single-family listed at $205k.
Deal economics
- At list price, monthly cash flow is $635 ($8k/yr) — positive.
- The deal already cash-flows at list — no discount required.
- Meets the 1% rule at list price ($3k rent vs $205k).
- Cap rate 10.0% vs local median 4.5% in Middletown — top-decile yield for the area; either an underpriced asset or a hidden risk that comps aren't pricing in. Stress-test before assuming the spread holds.
Location & tenants
- Location reads 72/100 on livability (#389 in OH) — a middle-class / working-renter tenant base. Strengths: cost of living A+, housing A+, health & safety A+; Watch: schools D+, crime D+, amenities D+.
- Middletown City (suburban): math 21% / reading 28% proficiency, ranked #610 of 656 in OH (top 93%) — low school quality limits family demand, transient renter base, plan for 1-2y turnover; 69% free/reduced lunch — lower-income household profile, screen leases tightly.
- Market conditions: Rents rising fast (+6.3%/yr); 203 active listings in the ZIP; 4 comparable units currently listed for rent nearby; rentals leasing fast (median 2d on market — plan ~1-2 weeks tenant-placement turnaround); 1,163 units permitted in Butler County in 2024 (356 in 5+ unit buildings).
- This rent runs 41% of the median local income ($74k/yr) — at the standard rent-burdened threshold; future hikes will face affordability resistance.
Forward outlook
- Local home prices are declining (-3.0%/yr); year-one equity from $1k of loan paydown is wiped out by about $6k of value loss. Plan a longer hold.
- At projected returns (-3.0% appreciation + 6.3% rent growth), your $57k cash investment doubles in ~7 years — after that, you're playing with house money.
Negotiation context
- Only 5 days on market — expect competitive offers; lowballing is unlikely to land.
Risks & watch-outs
- Climate carrying-cost: extreme-heat days projected 7→19/yr by 2055 (HVAC capex compounding) — expect insurance premiums to compound above CPI over the hold.
Questions for the listing agent
- Is there a deadline driving the sale (1031 exchange, divorce, estate, relocation)? That informs how much negotiation room exists.
- Schools are D-rated, which usually means shorter tenancies and higher turnover. Who's the typical renter profile here, and what's been the actual vacancy rate?
- Crime grade is D in this area — have there been break-ins, vandalism, or insurance claims at this property in the last 3 years? What carrier currently insures it and at what premium?
- What's the average days-on-market for RENTAL listings here right now (not sales)? A rising rental-DOM trend means longer vacancies and softer asking-rent achievability than the comps imply.
- What's the recent tenant-quality profile in this submarket — average credit score on applications, eviction rate, late-payment / NSF rate, and stable-employment percentage? A property-management company in the area should have these aggregated.
- How much new for-sale + rental construction is in the pipeline within 1–3 miles? Heavy new supply typically softens prices + rents 12–24 months out; constrained supply supports both.
Investment metrics
- 1% rule
- 1.23% ✓
- Cap rate
- 10.01%
- Cash-on-cash
- 13.28%
- DSCR
- 1.59
- GRM
- 6.8
CMA / ARV
- ARV (on-the-fly)
- $196,690
- Comps found
- 12
Show comp detail 12 sales within ~0.75 mi
| Address | Dist | Beds/Ba | Sqft | Sold | Price | $/sf | Match |
|---|---|---|---|---|---|---|---|
| 604 Diamond Loop | 0.10mi | 3/2.0 | 1,180 (+2%) | 1mo | $265,000 | $225 | 91 |
| 2633 Ruby Ln | 0.01mi | 3/2.0 | 1,104 (-5%) | 1mo | $208,000 | $188 | 91 |
| 608 Diamond Loop | 0.10mi | 3/1.0 | 1,171 (+1%) | 10mo | $247,000 | $211 | 81 |
| 580 Diamond Loop | 0.09mi | 3/2.0 | 1,078 (-7%) | 8mo | $235,000 | $218 | 78 |
| 3103 Locust St | 0.45mi | 3/1.0 | 1,152 (-0%) | 4mo | $175,000 | $152 | 71 |
| 609 Buena Ave | 0.30mi | 3/1.0 | 1,075 (-7%) | 1mo | $171,000 | $159 | 69 |
| 712 Buena Ave | 0.30mi | 3/1.0 | 1,042 (-10%) | 2mo | $168,000 | $161 | 64 |
| 2004 Minnesota St | 0.54mi | 3/2.0 | 1,128 (-2%) | 9mo | $187,550 | $166 | 63 |
| 1102 Forrer St | 0.52mi | 3/2.0 | 1,237 (+7%) | 6mo | $177,000 | $143 | 59 |
| 3004 Judy Dr | 0.50mi | 4/1.0 (+1) | 1,140 (-2%) | 8mo | $179,000 | $157 | 58 |
| 3003 Judy Dr | 0.53mi | 3/1.0 | 1,080 (-7%) | 4mo | $184,000 | $170 | 57 |
| 3110 Brent Dr | 0.62mi | 3/1.0 | 1,008 (-13%) | 10mo | $179,000 | $178 | 38 |
Match score weights: distance 35% · size 25% · config 20% · recency 20%. Top-matched comps best support the ARV.
Projected returns pro-forma
-3.0% appreciation · 6.31% rent growth · sell at horizon
- IRR
- 6.9%
- Equity multiple
- 1.28×
- Total profit
- $15,921
- Equity at exit
- $30,566
- IRR
- 18.9%
- Equity multiple
- 2.81×
- Total profit
- $104,088
- Equity at exit
- $17,725
Cash invested: $57,400 (down + closing). Projections, not guarantees.
Landlord ↔ Tenant lean methodology
- Overall (STATE)
- 73 Landlord-Friendly
- State Ohio
- 73 Landlord-Friendly · R+6
- County
- — inherits STATE
- City
- — inherits STATE
ZIP-level market 45044
- Rents YoY
- 6.3%
- Active inventory
- 203
- Price-to-rent
- 6.8×
Monthly cashflow live
- Estimated rent
- $2,522 medium interval (Pro) →
- Mortgage (P&I)
- −$1,075
- Tax from tax record
- −$197 /mo · $2,360/yr
- Insurance
- −$85
- HOA
- −$0
- Vacancy / Maint / Mgmt
- −$530
- Net cashflow
- $635
Break-even live
UW: 25.0% down · 7.5% · 30yr · 1.5% tax · 5.0% vac · 8.0% maint · 8.0% mgmt
Financing live
Cash to close
- Down payment
- $51,250
- Closing costs
- $6,150
- Reserves months
- —
- Total cash needed
- —
Loan-product check · same deal, 3 products live
Conventional
25% down · 7.5% · 30yr
- Down + closing
- —
- Monthly P&I
- —
- Monthly cashflow
- —
- DSCR
- —
- Eligible?
- —
Personal DTI + credit; lowest rate.
DSCR
20% down · 8.5% · 30yr
- Down + closing
- —
- Monthly P&I
- —
- Monthly cashflow
- —
- DSCR
- —
- Eligible?
- —
No personal income docs; deal must DSCR.
Hard money
10% down · 12.0% · 12mo
- Down + closing
- —
- Monthly P&I
- —
- Monthly cashflow
- —
- DSCR
- —
- Eligible?
- —
Short-term bridge; refi at stabilization.
Rent comps 4 comps
| Address | Beds | Baths | Sqft | Rent | $/sqft | DOM | Units | Dist |
|---|---|---|---|---|---|---|---|---|
| 2101 S Main St Middletown, OH | 1.0–2.0 | 1.0 | 757 | $900 | $1.19 | 1d | 1 | 0.44mi |
| 1109 Oxford State Rd Middletown, OH | 2.0 | 1.0 | 744 | $995 | $1.34 | 1d | 1 | 0.57mi |
| 1419 Oxford State Rd Middletown, OH | 2.0 | 1.0 | 900 | $2,495 | $2.77 | 1d | 1 | 0.88mi |
| 2000 Pearl St Middletown, OH | 2.0 | 1.0 | 900 | $3,500 | $3.89 | 1d | 4 | 1.17mi |
Listing history 5 events
-
2026-06-18days on market $205,000 Active 5 DOM
-
2026-06-17days on market $205,000 Active 4 DOM
-
2026-06-16days on market $205,000 Active 3 DOM
-
2026-06-15remarks 163-char remark
-
2026-06-15$205,000 Active 2 DOM
ⓘ Source: listings_history table (triggers on properties + properties_extension) + one-shot
backfill from property_details.listing_events for pre-trigger history.
Tax reassessment forecast OH · Partial reset (capped growth)
- Current annual tax
- $2,360 · $197/mo
- Projected year-2 tax
- $2,779 · $232/mo
- Expected delta
- +$419/yr (+$35/mo · 17.8%)
ⓘ Screening estimate from a state-policy table — verify with the county assessor before closing.
Climate risk First Street
- Flood 1/10 Low FEMA zone X · 0% chance over 30 yrs
- Wildfire 1/10 Low
- Heat 5/10 Major 7 d/yr ≥103°F today · 19 d/yr by 30 yrs out
- Wind 2/10 Low 100% chance of damaging wind over 30 yrs
- Air quality 3/10 Moderate 2 unhealthy d/yr today · 3 by 30 yrs out
Nearby sold comps map
Loading sold comps map…
Walkable amenities ~0.75 mi
Loading nearby amenities…
Taxation est. · year 1
- Rental income
- $30,264
- − Mortgage interest
- −$11,483
- − Property taxes
- −$2,360
- − Insurance
- −$1,025
- − Repairs & maintenance
- −$2,421
- − Management
- −$2,421
- − Depreciation
- −$5,964
- Taxable income
- $4,590
- Est. tax owed @ 24.0%
- −$1,102
- After-tax cash flow
- $6,522/yr
For passive investors: Depreciation is non-cash, so a rental often shows a tax loss while cash-flowing — sheltering income. Rental losses are passive: they offset passive income freely, and up to $25,000/yr can offset ordinary (W-2) income if you actively participate and your MAGI is under $100k (phasing out to $0 by $150k); unused losses carry forward. On sale, claimed depreciation is recaptured at up to 25%, and gains may owe capital-gains tax (a 1031 exchange can defer both). Figures are a year-1 estimate at your 24.0% rate — not tax advice; consult a CPA.
Schools (NCES district)
- District
- Middletown City
- NCES district ID
- 3904440
- Math proficiency
- 21% ▼ -17.00%
- Reading proficiency
- 28% ▼ -15.00%
- Median HH income
- $36,650
- Composite
- 20.35/100
- National rank
- #8605
- State rank
- #610 of 656 in OH
Livability — Middletown
- Score
- 72/100
- State rank
- #389
- US rank
- #6338
Category grades
Schools grade is shown separately in the Schools card above.
Census & demographics
- County
- Butler County · 381,674 people
- City population
- 96,117
- Metro
- Cincinnati, OH-KY-IN
- Population (ZIP)
- 56,217
- Household income
- $73,732
- Rent vs Own
- Severe rent burden
- 1532.0
Population outlook (Butler County) Hauer SSP2
- Today (2025)
- 387,706 people
- By 2030
- 392,028 · +1.1%
- By 2040
- 395,307 · +2.0%
- By 2050
- 391,116 · +0.9%
- By 2075
- 378,642 · -2.3%
- By 2100
- 343,248 · -11.5%
Race, ethnicity, and origin ACS 2023
- Neighborhood character
- Predominantly White (72%)
- Race & ethnicity
- White 72% Black 12% Two or more races 8% Hispanic / Latino 7% Asian 2%
- Hispanic origin (detail)
- Mexican 2% Dominican 1%
- Common ancestry
- Slovak 2% Italian 2% Romanian 2%
- Foreign-born
- 6% · Canada
- Languages at home
- 92% English-only · Spanish 4% Other Indo-European 1% Tagalog/Filipino 1%
Political lean MEDSL · Butler
- 2024 margin
- Strong R (+26.3) · D 36.4% · R 62.7%
- 2008→2024 swing
- -3.6pp toward R · 2008: -22.6pp · 2024: -26.3pp
- All cycles
- 2024: R+26.3 2020: R+24.0 2016: R+28.3 2012: R+26.2 2008: R+22.6
Not yet ingested
- Civics
- —
Market trends
- HPI YoY
- ▼ -164.07%
- Current HPI
- 219.0479
- Rent YoY
- ▲ 6.31%
- Metro
- Cincinnati, OH-KY-IN
- State GDP YoY
- ▲ 1.98%
- F500 in state
- 48
Industry mix (Fortune 500 HQ in OH)
| Industry | F500 HQs | Revenue |
|---|---|---|
| Insurance | 3 | $145B |
|
||
| Industrial Machinery | 3 | $49B |
|
||
| Financial Services | 3 | $24B |
|
||
| Consumer Goods | 2 | $93B |
|
||
| Aerospace / Defense | 2 | $47B |
|
||
| Utilities | 2 | $33B |
|
||
Price history
1 event — show timeline
- 2026-06-14 Listed $205,000 Cincy MLS
Property tax history
+4.2%/yrLatest (2025): $2,360 · +4.3% YoY. Source: county tax records.
Cash-flow waterfall
monthlySold comps — $/sqft
last 12 mo · ≤1 miLoading sold comps…