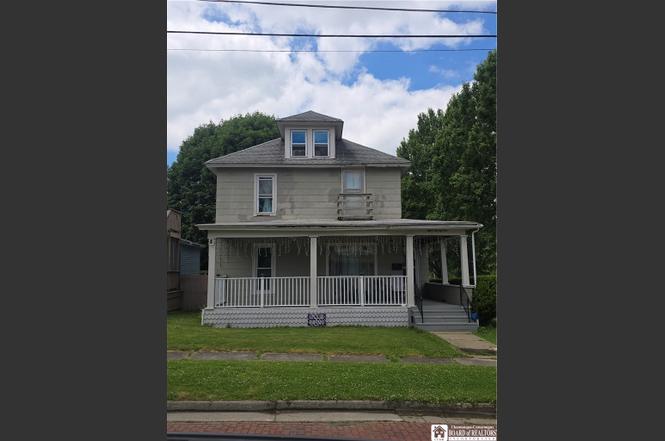
821 Lafayette St · Jamestown, NY
Flood risk 1/10 · Minimal
- FEMA flood zone
- X
- Chance of flooding over 30 yrs
- 0.0%
- Est. flood insurance / yr
- $473 – $860
Fire risk 1/10 · Minimal
- Est. fire insurance / yr
- $691 – $1,283
Heat risk 2/10 · Minimal
- Hot days now (above 91°F)
- 7 days/yr
- Hot days in 30 yrs
- 17 days/yr
Wind risk 1/10 · Minimal
- Chance of severe wind over 30 yrs
- —
Air-quality risk 2/10 · Minimal
- Unhealthy air days now
- 0 days/yr
- Unhealthy air days in 30 yrs
- 1 days/yr
Risk factors via First Street. Map © Google.
Why this score? — see what drove the C+ grade
The composite is a weighted blend of 9 inputs, each scored 0–100. Each bar is that input's sub-score; the figure is the points it added to the 100-point composite (weight × sub-score).
- Cash flow +30.0/30.0
- DSCR +10.0/10.0
- 1% rule +9.1/10.0
- Livability +3.5/5.0
- Schools +3.1/10.0
- Rent growth +2.5/5.0
- Condition / age +2.5/5.0
- ARV discount +0.0/15.0
- Appreciation +0.0/10.0
$99,000
🖨 Deal sheet 📄 Offer letter ✓ Due diligence
Listing remarks
This charming home features 4 bedrooms, 2 full bathrooms, a large living room, den and studio above the garage! Entertaining will be a breeze with this backyard that includes 2 lots. Cool off on those hot summer days with the pool, and the oversized garage has endless possibilities! Close to parks, downtown, shopping and recreation.
Key facts
- Close to parks
- Backyard
- Pool
Tags
Property features AI
Exterior
- Parking: Detached garage
- Utilities: Public water connected; Sewer connected
- Home design: Two-story home; Existing (previously built) property
- Construction: Composite siding; Wood siding; Block and stone foundation; Attic/crawl hatchway(s) insulated
- Exterior features: Blacktop driveway; Corner, rectangular lot (50 x 132)
Interior
- Kitchen: Eat-in kitchen; Appliances negotiable; Gas water heater
- Bedrooms: One main-level bedroom; Total room types include bedroom, den, family room, studio (6 total rooms)
- Flooring: Carpet; Hardwood; Laminate; Varied flooring
- Bathrooms: Two full bathrooms; One main-level bathroom
- Heating & cooling: Gas heating; Radiant heating
- Interior features: Attic with pull-down stairs; Den; Eat-in kitchen; Bedroom on main level; Full basement
- Laundry & utility: Laundry in basement
Neighborhood map
What this means for you Summary
Snapshot
- This is a 4-bed/2.0-bath single-family listed at $99k.
Deal economics
- At list price, monthly cash flow is $441 ($5k/yr) — positive.
- The deal already cash-flows at list — no discount required.
- Meets the 1% rule at list price ($1k rent vs $99k).
- Cap rate 11.6% vs local median 16.6% in Jamestown — below-typical yield; the buyer is paying a premium for something (appreciation thesis, condition, location) that the cap rate doesn't capture.
Location & tenants
- Location reads 69/100 on livability (#470 in NY) — a middle-class / working-renter tenant base. Strengths: cost of living A+, housing A+, health & safety A+; Watch: schools C-, amenities D, crime F.
- Jamestown City School District (town): math 33% / reading 42% proficiency, ranked #553 of 590 in NY (top 94%) — families likely to look elsewhere, expect single-tenant / working-renter base with shorter leases.
- Market conditions: 313 active listings in the ZIP; 1 comparable units currently listed for rent nearby; 127 units permitted in Chautauqua County in 2024 (0 in 5+ unit buildings).
- This rent runs 34% of the median local income ($50k/yr) — at the standard rent-burdened threshold; future hikes will face affordability resistance.
Forward outlook
- Local home prices are declining (-3.0%/yr); year-one equity from $684 of loan paydown is wiped out by about $3k of value loss. Plan a longer hold.
- Chautauqua County population projected at -22% by 2050 — secular population decline; favor cash flow + early exit over multi-decade hold.
- At projected returns (-3.0% appreciation + 3.0% rent growth), your $28k cash investment doubles in ~7 years — after that, you're playing with house money.
Negotiation context
- Only 4 days on market — expect competitive offers; lowballing is unlikely to land.
Risks & watch-outs
- Watch-outs: built in 1900 — expect roof / HVAC / electrical / plumbing capex.
Questions for the listing agent
- Built in 1900 — when were the roof, HVAC, electrical panel, plumbing, and water heater last replaced?
- Is there a deadline driving the sale (1031 exchange, divorce, estate, relocation)? That informs how much negotiation room exists.
- Crime grade is F in this area — have there been break-ins, vandalism, or insurance claims at this property in the last 3 years? What carrier currently insures it and at what premium?
- What's the average days-on-market for RENTAL listings here right now (not sales)? A rising rental-DOM trend means longer vacancies and softer asking-rent achievability than the comps imply.
- What's the recent tenant-quality profile in this submarket — average credit score on applications, eviction rate, late-payment / NSF rate, and stable-employment percentage? A property-management company in the area should have these aggregated.
- How much new for-sale + rental construction is in the pipeline within 1–3 miles? Heavy new supply typically softens prices + rents 12–24 months out; constrained supply supports both.
Investment metrics
- 1% rule
- 1.41% ✓
- Cap rate
- 11.63%
- Cash-on-cash
- 19.08%
- DSCR
- 1.85
- GRM
- 5.9
CMA / ARV
- ARV (on-the-fly)
- $84,864
- Comps found
- 12
Show comp detail 12 sales within ~0.75 mi
| Address | Dist | Beds/Ba | Sqft | Sold | Price | $/sf | Match |
|---|---|---|---|---|---|---|---|
| 820 Lafayette St | 0.02mi | 3/1.5 (-1) | 1,705 (+2%) | 3mo | $18,200 | $11 | 85 |
| 704 Jefferson St | 0.11mi | 3/1.0 (-1) | 1,643 (-1%) | 1mo | $83,000 | $51 | 83 |
| 22 W 9th St | 0.22mi | 3/1.0 (-1) | 1,542 (-7%) | 0mo | $30,000 | $19 | 68 |
| 9 Genesee St | 0.68mi | 4/2.0 | 1,678 (+1%) | 2mo | $79,500 | $47 | 65 |
| 830 Prendergast Ave | 0.42mi | 4/2.0 | 1,792 (+8%) | 12mo | $42,000 | $23 | 58 |
| 15 Euclid Ave | 0.69mi | 4/2.0 | 1,652 (-1%) | 11mo | $139,900 | $85 | 57 |
| 23 Hall Ave | 0.56mi | 4/1.0 | 1,437 (-14%) | 10mo | $55,000 | $38 | 39 |
| 114 Catlin Ave | 0.67mi | 3/2.0 (-1) | 1,470 (-12%) | 7mo | $130,000 | $88 | 38 |
| 346 Crossman St | 0.67mi | 4/1.5 | 1,894 (+14%) | 10mo | $22,000 | $12 | 36 |
| 44 Meadow Ln | 0.75mi | 3/1.5 (-1) | 1,428 (-14%) | 1mo | $116,494 | $82 | 34 |
| 213 Van Buren St | 0.66mi | 3/1.5 (-1) | 1,883 (+13%) | 12mo | $155,000 | $82 | 31 |
| 28 Lakin Ave | 0.74mi | 3/1.0 (-1) | 1,436 (-14%) | 12mo | $105,000 | $73 | 24 |
Match score weights: distance 35% · size 25% · config 20% · recency 20%. Top-matched comps best support the ARV.
Projected returns pro-forma
-3.0% appreciation · 3.0% rent growth · sell at horizon
- IRR
- 11.0%
- Equity multiple
- 1.43×
- Total profit
- $12,035
- Equity at exit
- $14,761
- IRR
- 20.0%
- Equity multiple
- 2.68×
- Total profit
- $46,658
- Equity at exit
- $8,560
Cash invested: $27,720 (down + closing). Projections, not guarantees.
Landlord ↔ Tenant lean methodology
- Overall (STATE)
- 15 Strongly Tenant-Friendly
- State New York
- 15 Strongly Tenant-Friendly · D+10
- County
- — inherits STATE
- City
- — inherits STATE
ZIP-level market 14701
- Home prices YoY
- -18.5%
- Active inventory
- 313
- Price-to-rent
- 5.9×
Monthly cashflow live
- Estimated rent
- $1,397 medium interval (Pro) →
- Mortgage (P&I)
- −$519
- Tax from tax record
- −$103 /mo · $1,233/yr
- Insurance
- −$41
- HOA
- −$0
- Vacancy / Maint / Mgmt
- −$293
- Net cashflow
- $441
Break-even live
UW: 25.0% down · 7.5% · 30yr · 1.5% tax · 5.0% vac · 8.0% maint · 8.0% mgmt
Financing live
Cash to close
- Down payment
- $24,750
- Closing costs
- $2,970
- Reserves months
- —
- Total cash needed
- —
Loan-product check · same deal, 3 products live
Conventional
25% down · 7.5% · 30yr
- Down + closing
- —
- Monthly P&I
- —
- Monthly cashflow
- —
- DSCR
- —
- Eligible?
- —
Personal DTI + credit; lowest rate.
DSCR
20% down · 8.5% · 30yr
- Down + closing
- —
- Monthly P&I
- —
- Monthly cashflow
- —
- DSCR
- —
- Eligible?
- —
No personal income docs; deal must DSCR.
Hard money
10% down · 12.0% · 12mo
- Down + closing
- —
- Monthly P&I
- —
- Monthly cashflow
- —
- DSCR
- —
- Eligible?
- —
Short-term bridge; refi at stabilization.
Rent comps 1 comps
| Address | Beds | Baths | Sqft | Rent | $/sqft | DOM | Units | Dist |
|---|---|---|---|---|---|---|---|---|
| 148 Maple St Jamestown, NY | 3.0 | 1.0 | 1424 | $1,350 | $0.95 | 43d | 1 | 1.22mi |
Listing history 5 events
-
2026-06-19days on market $99,000 Active 4 DOM
-
2026-06-18days on market $99,000 Active 3 DOM
-
2026-06-17days on market $99,000 Active 2 DOM
-
2026-06-16remarks 335-char remark
-
2026-06-16$99,000 Active 1 DOM
ⓘ Source: listings_history table (triggers on properties + properties_extension) + one-shot
backfill from property_details.listing_events for pre-trigger history.
Tax reassessment forecast NY · Partial reset (capped growth)
- Current annual tax
- $1,233 · $103/mo
- Projected year-2 tax
- $1,453 · $121/mo
- Expected delta
- +$220/yr (+$18/mo · 17.8%)
ⓘ Screening estimate from a state-policy table — verify with the county assessor before closing.
Climate risk First Street
- Flood 1/10 Low FEMA zone X · 0% chance over 30 yrs
- Wildfire 1/10 Low
- Heat 2/10 Low 7 d/yr ≥91°F today · 17 d/yr by 30 yrs out
- Wind 1/10 Low
- Air quality 2/10 Low 0 unhealthy d/yr today · 1 by 30 yrs out
Nearby sold comps map
Loading sold comps map…
Walkable amenities ~0.75 mi
Loading nearby amenities…
Taxation est. · year 1
- Rental income
- $16,768
- − Mortgage interest
- −$5,546
- − Property taxes
- −$1,233
- − Insurance
- −$495
- − Repairs & maintenance
- −$1,341
- − Management
- −$1,341
- − Depreciation
- −$2,880
- Taxable income
- $3,931
- Est. tax owed @ 24.0%
- −$944
- After-tax cash flow
- $4,345/yr
For passive investors: Depreciation is non-cash, so a rental often shows a tax loss while cash-flowing — sheltering income. Rental losses are passive: they offset passive income freely, and up to $25,000/yr can offset ordinary (W-2) income if you actively participate and your MAGI is under $100k (phasing out to $0 by $150k); unused losses carry forward. On sale, claimed depreciation is recaptured at up to 25%, and gains may owe capital-gains tax (a 1031 exchange can defer both). Figures are a year-1 estimate at your 24.0% rate — not tax advice; consult a CPA.
Schools (NCES district)
- District
- Jamestown City School District
- NCES district ID
- 3615630
- Math proficiency
- 33% ▼ -3.00%
- Reading proficiency
- 42% ▲ 5.00%
- Median HH income
- $32,240
- Composite
- 30.69/100
- National rank
- #6176
- State rank
- #553 of 590 in NY
Livability — Jamestown
- Score
- 69/100
- State rank
- #470
- US rank
- #8213
Category grades
Schools grade is shown separately in the Schools card above.
Census & demographics
- Census place
- Jamestown, NY
- County
- Chautauqua County · 38,461 people
- City population
- 38,461
- Metro
- Jamestown-Dunkirk-Fredonia, NY
- Population (ZIP)
- 38,461
- Household income
- $49,685
- Rent vs Own
- Severe rent burden
- 1838.0
Population outlook (Chautauqua County) Hauer SSP2
- Today (2025)
- 123,454 people
- By 2030
- 118,509 · -4.0%
- By 2040
- 107,311 · -13.1%
- By 2050
- 96,703 · -21.7%
- By 2075
- 76,757 · -37.8%
- By 2100
- 60,984 · -50.6%
Race, ethnicity, and origin ACS 2023
- Neighborhood character
- Predominantly White (82%)
- Race & ethnicity
- White 82% Hispanic / Latino 11% Two or more races 6% Black 3%
- Hispanic origin (detail)
- Puerto Rican 8%
- Common ancestry
- Romanian 6% Lithuanian 2% Slovak 2%
- Foreign-born
- 3% · Canada
- Languages at home
- 92% English-only · Spanish 6% Other Indo-European 1% French/Haitian/Cajun 1%
Political lean MEDSL · Chautauqua
- 2024 margin
- Strong R (+22.0) · D 39.0% · R 61.0%
- 2008→2024 swing
- -22.9pp toward R · 2008: 0.9pp · 2024: -22.0pp
- All cycles
- 2024: R+22.0 2020: R+19.8 2016: R+24.6 2012: R+8.2 2008: D+0.9
Not yet ingested
- Civics
- —
Market trends
- HPI YoY
- ▼ -58.93%
- Current HPI
- 259.402
- Rent YoY
- —
- Metro
- Jamestown-Dunkirk-Fredonia, NY
- State GDP YoY
- ▲ 2.60%
- F500 in state
- 92
Industry mix (Fortune 500 HQ in NY)
| Industry | F500 HQs | Revenue |
|---|---|---|
| Financial Services | 10 | $950B |
|
||
| Consumer Goods | 9 | $162B |
|
||
| Insurance | 4 | $225B |
|
||
| Telecommunications | 2 | $144B |
|
||
| Pharmaceuticals | 2 | $112B |
|
||
| Media / Entertainment | 2 | $69B |
|
||
Price history
1 event — show timeline
- 2026-06-15 Listed $99,000 UNYREIS
Property tax history
-1.7%/yrLatest (2025): $1,233 · +4.8% YoY. Source: county tax records.
Cash-flow waterfall
monthlySold comps — $/sqft
last 12 mo · ≤1 miLoading sold comps…