 🏗️ New Construction
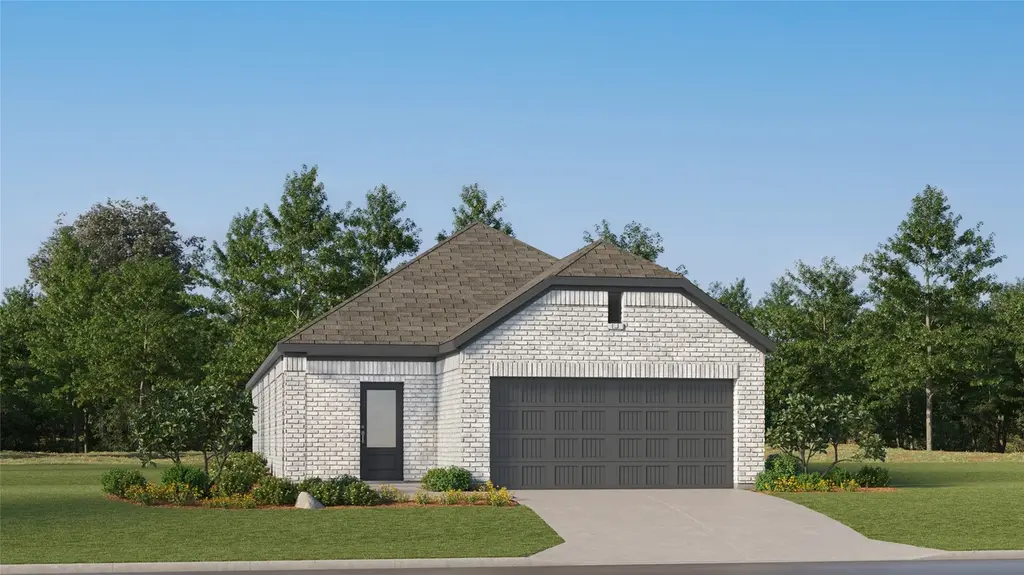
21638 Carbonari Dr · Houston, TX
Flood risk No data
- FEMA flood zone
- —
- Chance of flooding over 30 yrs
- —
- Est. flood insurance / yr
- —
Fire risk No data
- Est. fire insurance / yr
- —
Heat risk No data
- Hot days now (above threshold)
- —
- Hot days in 30 yrs
- —
Wind risk No data
- Chance of severe wind over 30 yrs
- —
Air-quality risk No data
- Unhealthy air days now
- —
- Unhealthy air days in 30 yrs
- —
Risk factors via First Street. Map © Google.
Why this score? — see what drove the F grade
The composite is a weighted blend of 9 inputs, each scored 0–100. Each bar is that input's sub-score; the figure is the points it added to the 100-point composite (weight × sub-score).
- ARV discount +7.5/15.0
- Cash flow +6.0/30.0
- Condition / age +4.0/5.0
- Livability +3.7/5.0
- Schools +2.9/10.0
- Rent growth +2.1/5.0
- 1% rule +1.9/10.0
- DSCR +0.4/10.0
- Appreciation +0.0/10.0
$270,340
🖨 Deal sheet (PDF) 📄 Offer letter ✓ Due diligence
Listing remarks
The Rio Floor Plan - This new three-bedroom home offers convenient single-floor living. An open-concept floorplan combines the kitchen, living and dining areas with access to a covered patio for seamless entertaining and multitasking. Three bedrooms are tucked away to the side of the home for enhanced comfort and privacy, including the luxe owner’s suite with a spa-inspired bathroom and walk-in closet. The completion date, prices and features may vary and are subject to change. Please verify with Lennar directly. Photos are for illustrative purposes only.
Key facts
- Walk-in closet
- Covered patio
- Single-floor living
Tags
Property features AI
Finance
- HOA & community: Association: RealManage Onsite Elevated; Annual association fee; Community amenities: clubhouse, sport court, fitness center, picnic area, park, pool, tennis courts
Exterior
- Parking: Attached 2-car garage
- Utilities: Public water; Public sewer
- Home design: Residential property; New construction (under construction); Slab foundation; Composition roof
- Construction: Built in 2026; Brick construction; Slab foundation; Composition roof
- Exterior features: Back yard fence; Subdivision setting; Association pool
Interior
- Kitchen: Dishwasher; Electric oven; Electric range; Gas oven; Gas range
- Bedrooms: Primary bedroom on the first floor; Two additional bedrooms on the first floor; One more bedroom on the first floor
- Flooring: Carpet; Vinyl
- Bathrooms: Two full bathrooms
- Heating & cooling: Central heating (electric and gas); Central air conditioning (electric and gas)
- Interior features: Breakfast bar; Double vanity; Kitchen open to family room; Separate shower; Tub/shower combo
- Laundry & utility: Washer hookup; Electric dryer hookup; Gas dryer hookup
Neighborhood map
What this means for you Summary
Snapshot
- This is a 3-bed/2.0-bath single-family listed at $270k. Condition is rated good.
Deal economics
- At list price, monthly cash flow is $-626 ($-8k/yr) — negative.
- To cash-flow at today's rent, offer at most $237k (12.2% below list).
- To meet the 1% rule (rent ≥ 1% of price), the offer needs to be $225k (16.9% below list).
- Recommended offer: $225k (16.9% below list) — sets the bar for 1% rule.
- Cap rate 4.0% vs local median 3.2% in Houston — meaningfully above typical; check what's discounted (condition, days-on-market, listing class) to confirm the premium yield is real.
Location & tenants
- Location reads 74/100 on livability (#184 in TX, #4,771 nationally) — a middle-class / working-renter tenant base. Strengths: amenities A+, cost of living A+, housing A+; Watch: crime F.
- Waller ISD (rural): math 30% / reading 35% proficiency, ranked #532 of 826 in TX (top 64%) — families likely to look elsewhere, expect single-tenant / working-renter base with shorter leases.
- Zoned schools: Evelyn Turlington El (math 46% / reading 45%, grade D-, #1,112 of 4,322 statewide, top 26%, 1,084 students, 69% FRL); Schultz J H (math 31% / reading 37%, grade F, #892 of 1,662 statewide, top 55%, 1,120 students, 65% FRL); Waller H S (math 25% / reading 40%, grade F, #1,029 of 1,632 statewide, top 64%, 2,639 students, 62% FRL).
- Market conditions: Rents soft (-1.6%/yr); 1791 active listings in the ZIP; 7 comparable units currently listed for rent nearby; rentals leasing fast (median 1d on market — plan ~1-2 weeks tenant-placement turnaround); high-income renter base; 29,883 units permitted in Harris County in 2024 (8,621 in 5+ unit buildings).
Forward outlook
- Local home prices are declining (-3.0%/yr); year-one equity from $2k of loan paydown is wiped out by about $10k of value loss. Plan a longer hold.
- Harris County population projected at +47% by 2050 — long-run rental-demand tailwind backs the buy-and-hold thesis.
Negotiation context
- It's been on market 15 days — a 2% lower offer ($266k) is reasonable based on typical stale-listing flexibility.
Questions for the listing agent
- What do current leases actually rent for vs. the listed asking? Can we see a recent rent roll and the last 12 months of T-12 income?
- What does the HOA fee cover, when was the last increase, and are there any pending special assessments or reserve-fund shortfalls?
- Is there a deadline driving the sale (1031 exchange, divorce, estate, relocation)? That informs how much negotiation room exists.
- Schools are D-rated, which usually means shorter tenancies and higher turnover. Who's the typical renter profile here, and what's been the actual vacancy rate?
- Crime grade is F in this area — have there been break-ins, vandalism, or insurance claims at this property in the last 3 years? What carrier currently insures it and at what premium?
- The area grade is low — what's the realistic commute time and amenity access for the typical tenant pool here? Any planned neighborhood developments (good or bad) we should know about?
- What's the average days-on-market for RENTAL listings here right now (not sales)? A rising rental-DOM trend means longer vacancies and softer asking-rent achievability than the comps imply.
- What's the recent tenant-quality profile in this submarket — average credit score on applications, eviction rate, late-payment / NSF rate, and stable-employment percentage? A property-management company in the area should have these aggregated.
- How much new for-sale + rental construction is in the pipeline within 1–3 miles? Heavy new supply typically softens prices + rents 12–24 months out; constrained supply supports both.
Investment metrics
- 1% rule
- 0.69% ✗
- Cap rate
- 4.00%
- Cash-on-cash
- -8.18%
- DSCR
- 0.64
- GRM
- 12.2
CMA / ARV
- ARV (median comp)
- $327,990
- List price
- $270,340
- Delta
- -13.11%
- Verdict
- UNDERPRICED
- Comps
- 20 within 1.0 mi
Show comp detail 12 sales within ~0.75 mi
| Address | Dist | Beds/Ba | Sqft | Sold | Price | $/sf | Match |
|---|---|---|---|---|---|---|---|
| 21639 Carbonari Dr | 0.02mi | 3/2.5 | 1,749 (+2%) | 1mo | $337,990 | $193 | 94 |
| 22102 La Scorza Dr | 0.02mi | 3/2.0 | 1,792 (+4%) | 1mo | $324,990 | $181 | 92 |
| 19307 Licola Ln | 0.01mi | 3/2.0 | 1,627 (-6%) | 0mo | $276,990 | $170 | 90 |
| 22026 Matera Vista Ln | 0.08mi | 4/2.0 (+1) | 1,759 (+2%) | 1mo | $299,990 | $171 | 87 |
| 21643 Carbonari Dr | 0.02mi | 4/2.0 (+1) | 1,655 (-4%) | 1mo | $333,990 | $202 | 87 |
| 21623 Carbonari Dr | 0.02mi | 4/2.0 (+1) | 1,655 (-4%) | 1mo | $328,990 | $199 | 87 |
| 22106 La Scorza Dr | 0.01mi | 3/2.0 | 1,880 (+9%) | 0mo | $307,990 | $164 | 84 |
| 22210 San Lioni Dr | 0.01mi | 3/2.0 | 1,880 (+9%) | 1mo | $330,990 | $176 | 84 |
| 22214 San Lioni Dr | 0.02mi | 4/2.0 (+1) | 1,908 (+11%) | 1mo | $333,990 | $175 | 76 |
| 22002 Maddaloni View Dr | 0.02mi | 4/2.0 (+1) | 1,922 (+12%) | 1mo | $316,990 | $165 | 74 |
| 19071 Cetara Villa Dr | 0.40mi | 3/2.0 | 1,582 (-8%) | 0mo | $249,990 | $158 | 67 |
| 21002 Echo Manor Dr | 0.67mi | 3/2.0 | 1,513 (-12%) | 0mo | $262,000 | $173 | 48 |
Match score weights: distance 35% · size 25% · config 20% · recency 20%. Top-matched comps best support the ARV.
Projected returns pro-forma
-3.0% appreciation · 0.0% rent growth · sell at horizon
- IRR
- -34.3%
- Equity multiple
- -0.08×
- Total profit
- $-99,491
- Equity at exit
- $48,904
- IRR
- -68.1%
- Equity multiple
- -0.77×
- Total profit
- $-162,959
- Equity at exit
- $28,359
Cash invested: $91,837 (down + closing). Projections, not guarantees.
Landlord ↔ Tenant lean methodology
- Overall (STATE)
- 87 Strongly Landlord-Friendly
- State Texas
- 87 Strongly Landlord-Friendly · R+5
- County
- — inherits STATE
- City
- — inherits STATE
ZIP-level market 77447
- Home prices YoY
- -31.1%
- Rents YoY
- -1.6%
- Active inventory
- 1791
- Price-to-rent
- 10.0×
Monthly cashflow live
- Estimated rent
- $2,248 high interval (Pro) →
- Mortgage (P&I)
- −$1,720
- Tax est. 1.5%
- −$410 /mo · $4,920/yr
- Insurance
- −$137
- HOA
- −$135
- Vacancy / Maint / Mgmt
- −$472
- Net cashflow
- $-626
Break-even live
Sensitivity live
| Price | -10% $-399 | -5% $-513 | +0% $-626 | +5% $-739 | +10% $-853 |
|---|---|---|---|---|---|
| Rent | -10% $-804 | -5% $-715 | +0% $-626 | +5% $-537 | +10% $-448 |
| Rate | -1.0pp $-461 | -0.5pp $-543 | base $-626 | +0.5pp $-711 | +1.0pp $-797 |
UW: 25.0% down · 7.5% · 30yr · 1.5% tax · 5.0% vac · 8.0% maint · 8.0% mgmt
Financing live
Cash to close
- Down payment
- $81,998
- Closing costs
- $9,840
- Reserves months
- —
- Total cash needed
- —
Loan-product check · same deal, 3 products live
Conventional
25% down · 7.5% · 30yr
- Down + closing
- —
- Monthly P&I
- —
- Monthly cashflow
- —
- DSCR
- —
- Eligible?
- —
Personal DTI + credit; lowest rate.
DSCR
20% down · 8.5% · 30yr
- Down + closing
- —
- Monthly P&I
- —
- Monthly cashflow
- —
- DSCR
- —
- Eligible?
- —
No personal income docs; deal must DSCR.
Hard money
10% down · 12.0% · 12mo
- Down + closing
- —
- Monthly P&I
- —
- Monthly cashflow
- —
- DSCR
- —
- Eligible?
- —
Short-term bridge; refi at stabilization.
Rent comps 7 comps
| Address | Beds | Baths | Sqft | Rent | $/sqft | DOM | Units | Dist |
|---|---|---|---|---|---|---|---|---|
| 22215 Scarlino Dr Hockley, TX | 3.0 | 2.0 | 2099 | $2,450 | $1.17 | 24d | 1 | 0.20mi |
| 20703 Solstice Point Dr Hockley, TX | 3.0 | 2.0 | 1912 | $1,876 | $0.98 | 0d | 1 | 0.49mi |
| 22023 Lost Lantern Dr Hockley, TX | 3.0–4.0 | 2.0 | 1601 | $1,901 | $1.19 | 0d | 1 | 0.54mi |
| 20718 Round Key Dr Hockley, TX | 4.0 | 2.5 | 2133 | $1,806 | $0.85 | 0d | 1 | 0.68mi |
| 21210 Echo Manor Dr Hockley, TX | 4.0 | 2.5 | 2221 | $2,150 | $0.97 | 4d | 1 | 0.79mi |
| 20313 Evergreen Cypress Dr Hockley, TX | 2.0–5.0 | 2.0–3.5 | 2051 | $2,353 | $1.15 | 0d | 1 | 0.92mi |
| 22719 Klingamans Way Hockley, TX | 3.0 | 2.0 | 1416 | $1,689 | $1.19 | 3d | 1 | 0.94mi |
HOA detail
- Monthly dues
- $135 · $1,620/yr
Listing history 7 events
-
2026-05-14$275,990 Active 567-char remark
-
2026-05-14historical
-
2026-05-04price $275,990
-
2026-04-30price $280,490
-
2026-04-27price $284,990
-
2026-04-20price $288,390
-
2026-04-15$292,840 Active
ⓘ Source: listings_history table (triggers on properties + properties_extension) + one-shot
backfill from property_details.listing_events for pre-trigger history.
Nearby sold comps map
Loading sold comps map…
Walkable amenities ~0.75 mi
Loading nearby amenities…
Taxation est. · year 1
- Rental income
- $26,972
- − Mortgage interest
- −$18,373
- − Property taxes
- −$4,920
- − Insurance
- −$1,640
- − Repairs & maintenance
- −$2,158
- − Management
- −$2,158
- − HOA
- −$1,620
- − Depreciation
- −$9,542
- Taxable loss
- −$13,438
- Est. tax savings @ 24.0%
- +$3,225
- After-tax cash flow
- $-4,287/yr
For passive investors: Depreciation is non-cash, so a rental often shows a tax loss while cash-flowing — sheltering income. Rental losses are passive: they offset passive income freely, and up to $25,000/yr can offset ordinary (W-2) income if you actively participate and your MAGI is under $100k (phasing out to $0 by $150k); unused losses carry forward. On sale, claimed depreciation is recaptured at up to 25%, and gains may owe capital-gains tax (a 1031 exchange can defer both). Figures are a year-1 estimate at your 24.0% rate — not tax advice; consult a CPA.
Condition & rehab AI · 12 photos
This home is in good condition with a modern and well-maintained interior and exterior. It has a good foundation and structure, and the landscaping is well-maintained. The kitchen and bathrooms need minor updates to enhance their resale value.
Value-add opportunities
- Both Painting exterior and interior walls — Fresh paint can enhance curb appeal and interior aesthetics
- Both Landscaping improvements — Enhanced landscaping can increase curb appeal and property value
- Resale Kitchen appliances — Upgrading appliances can attract more buyers
- Resale Bathroom fixtures — Modern fixtures can appeal to a broader range of buyers
Renovation cost estimate screening
Value-add ROI direction
- Both Painting exterior and interior walls — Fresh paint can enhance curb appeal and interior aesthetics ↑
- Both Landscaping improvements — Enhanced landscaping can increase curb appeal and property value ↑
- Resale Kitchen appliances — Upgrading appliances can attract more buyers ↑
- Resale Bathroom fixtures — Modern fixtures can appeal to a broader range of buyers ↑
ⓘ Cost ranges are severity-bucket heuristics (US national rule-of-thumb). Get contractor quotes + a written scope before underwriting a rehab budget.
Schools (NCES district)
- District
- Waller ISD
- NCES district ID
- 4844430
- Math proficiency
- 30% ▼ -23.00%
- Reading proficiency
- 35% ▼ -11.00%
- Median HH income
- $58,911
- Composite
- 29.12/100
- National rank
- #6593
- State rank
- #532 of 826 in TX
Livability — Houston
- Score
- 74/100
- State rank
- #184
- US rank
- #4771
Category grades
Schools grade is shown separately in the Schools card above.
Census & demographics
- County
- Harris County · 4,702,590 people
- City population
- 3,226,434
- Metro
- Houston-The Woodlands-Sugar Land, TX
- Population (ZIP)
- 25,231
- Household income
- $116,925
- Rent vs Own
- Severe rent burden
- 265.0
Population outlook (Harris County) Hauer SSP2
- Today (2025)
- 5,571,493 people
- By 2030
- 6,089,821 · +9.3%
- By 2040
- 7,142,806 · +28.2%
- By 2050
- 8,185,864 · +46.9%
- By 2075
- 10,574,329 · +89.8%
- By 2100
- 12,109,958 · +117.4%
Race, ethnicity, and origin ACS 2023
- Neighborhood character
- Diverse neighborhood (Simpson 0.63)
- Race & ethnicity
- White 44% Hispanic / Latino 41% Two or more races 16% Black 9% Asian 1%
- Hispanic origin (detail)
- Mexican 27%
- Common ancestry
- Lithuanian 3% Slovak 1% Romanian 1%
- Foreign-born
- 15% · Canada, Jamaica, Dominican Republic
- Languages at home
- 69% English-only · Spanish 28% Other Indo-European 1% Vietnamese 1%
Political lean MEDSL · Harris
- 2024 margin
- Lean D (+5.5) · D 52.0% · R 46.4% · Other 1.6%
- 2008→2024 swing
- +3.9pp toward D · 2008: 1.6pp · 2024: 5.5pp
- All cycles
- 2024: D+5.5 2020: D+13.3 2016: D+12.4 2012: D+0.1 2008: D+1.6
Not yet ingested
- Civics
- —
Market trends
- HPI YoY
- ▼ -112.73%
- Current HPI
- 249.6969
- Rent YoY
- ▼ -1.58%
- Metro
- Houston-The Woodlands-Sugar Land, TX
- State GDP YoY
- ▲ 3.95%
- F500 in state
- 110
Industry mix (Fortune 500 HQ in TX)
| Industry | F500 HQs | Revenue |
|---|---|---|
| Energy | 16 | $1,198B |
|
||
| Technology | 5 | $198B |
|
||
| Engineering / Construction | 4 | $72B |
|
||
| Energy Services | 3 | $60B |
|
||
| Utilities | 3 | $41B |
|
||
| Healthcare | 2 | $330B |
|
||
Price history
-5.8% since first listed6 events — show timeline
- 2026-05-14 Listing Removed — HARMLS
- 2026-05-04 Price Changed $275,990 HARMLS
- 2026-04-30 Price Changed $280,490 HARMLS
- 2026-04-27 Price Changed $284,990 HARMLS
- 2026-04-20 Price Changed $288,390 HARMLS
- 2026-04-15 Listed $292,840 HARMLS
Cash-flow waterfall
monthlySold comps — $/sqft
last 12 mo · ≤1 miLoading sold comps…