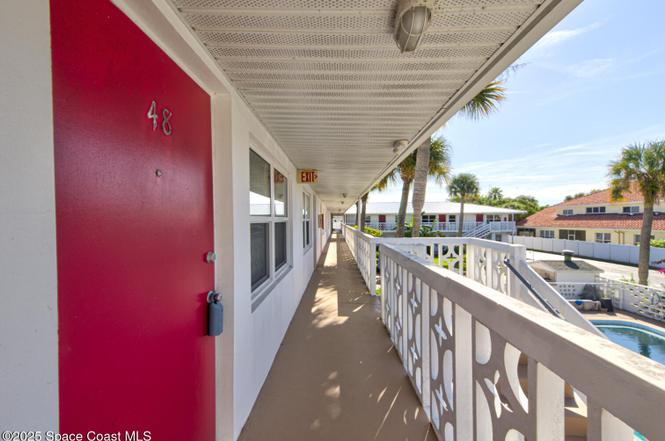
8522 N Atlantic Ave #48 · Cape Canaveral, FL
Flood risk 6/10 · Moderate
- FEMA flood zone
- X (unshaded)
- Chance of flooding over 30 yrs
- 0.54%
- Est. flood insurance / yr
- $507 – $1,088
Fire risk 1/10 · Minimal
- Est. fire insurance / yr
- $947 – $1,759
Heat risk 10/10 · Severe
- Hot days now (above 105°F)
- 7 days/yr
- Hot days in 30 yrs
- 24 days/yr
Wind risk 10/10 · Severe
- Chance of severe wind over 30 yrs
- 99.0%
Air-quality risk 1/10 · Minimal
- Unhealthy air days now
- 0 days/yr
- Unhealthy air days in 30 yrs
- 0 days/yr
Risk factors via First Street. Map © Google.
Why this score? — see what drove the C+ grade
The composite is a weighted blend of 9 inputs, each scored 0–100. Each bar is that input's sub-score; the figure is the points it added to the 100-point composite (weight × sub-score).
- Cash flow +24.0/30.0
- 1% rule +10.0/10.0
- DSCR +7.7/10.0
- ARV discount +7.5/15.0
- Schools +4.7/10.0
- Livability +4.2/5.0
- Rent growth +3.5/5.0
- Condition / age +2.5/5.0
- Appreciation +0.0/10.0
$99,000
🖨 Deal sheet 📄 Offer letter ✓ Due diligence
Listing remarks
Enjoy the Florida lifestyle in this fully furnished 1-bedroom, 1-bath condo featuring impact windows and a direct view of the pool. Perfectly situated in the sought-after 55+ Canaveral Breakers community, you're just a short walk or bike ride to the beach, Jetty Park, and Port Canaveral. Whether you keep the current furnishings or add your own personal touch, this condo is ready for you to make it your own. Just minutes from Hwy 528, you'll have a straight shot to the Orlando International Airport, as well as the area's top theme parks and attractions—ideal for weekend getaways or visits with family and friends. Priced to sell and ready for a new owner.
Key facts
- Minutes from hwy 528
- Impact windows
- $293 HOA
Tags
Neighborhood map
What this means for you Summary
Snapshot
- This is a 1-bed/1.0-bath condo listed at $99k.
Deal economics
- At list price, monthly cash flow is $193 ($2k/yr) — positive.
- The deal already cash-flows at list — no discount required.
- Meets the 1% rule at list price ($1k rent vs $99k).
- Recommended offer: $87k (12.0% below list) — sets the bar for market timing.
Location & tenants
- Location reads 84/100 on livability (#34 in FL, #677 nationally) — a professional / high-income tenant draw. Strengths: crime A+, commute A+, housing A+; Watch: amenities F.
- Brevard (suburban): math 53% / reading 57% proficiency, ranked #19 of 73 in FL (top 26%) — acceptable for families but not a draw, mixed tenant base, ~2y average lease.
- Zoned schools: Cape View Elementary School (math 62% / reading 62%, grade B, #608 of 2,144 statewide, top 29%, 305 students, 61% FRL); Cocoa Beach Junior/Senior High School (math 65% / reading 66%, grade B, #75 of 667 statewide, top 11%, 982 students, 30% FRL) — zoned schools at 45% FRL track the district average.
- Market conditions: Rents rising fast (+4.0%/yr); 219 active listings in the ZIP; 30 comparable units currently listed for rent nearby; rentals at typical pace (median 21d on market — plan ~3-4 weeks tenant-placement turnaround); 4,602 units permitted in Brevard County in 2024 (702 in 5+ unit buildings).
Forward outlook
- Local home prices are declining (-3.0%/yr); year-one equity from $684 of loan paydown is wiped out by about $3k of value loss. Plan a longer hold.
- Brevard County population projected at +15% by 2050 — modest demand growth; plan on rents tracking national, not racing it.
- At projected returns (-3.0% appreciation + 4.0% rent growth), your $28k cash investment doubles in ~10 years — after that, you're playing with house money.
Negotiation context
- It's been on market 208 days — a 12% lower offer ($87k) is reasonable based on typical stale-listing flexibility.
- Current owner paid $33k; list at $99k implies a 200% gain — meaningful room to come down on a strong offer.
Risks & watch-outs
- Climate carrying-cost: major flood risk; severe wind risk, 99% chance of damaging wind over 30y; extreme-heat days projected 7→24/yr by 2055 (HVAC capex compounding) — expect insurance premiums to compound above CPI over the hold.
Questions for the listing agent
- It's been on market 208 days. Have you received any prior offers? Is the seller open to a 12% concession, seller financing, or rate buy-down credit?
- Built in 1968 — when were the roof, HVAC, electrical panel, plumbing, and water heater last replaced?
- What does the HOA fee cover, when was the last increase, and are there any pending special assessments or reserve-fund shortfalls?
- Any open or pending special assessments — roof, HVAC, plumbing, elevator, façade? What's the per-unit balance and payoff schedule, and is the seller paying it off at close or rolling it to the buyer?
- Why hasn't it sold? Are there any deal-killer items the seller is aware of (foundation, flood, title, zoning, code violations)?
- Is there a deadline driving the sale (1031 exchange, divorce, estate, relocation)? That informs how much negotiation room exists.
- Schools are B-rated — typically a magnet for longer-tenancy family renters. What's the average tenant stay here, and is there a school-zone premium baked into asking?
- What's the average days-on-market for RENTAL listings here right now (not sales)? A rising rental-DOM trend means longer vacancies and softer asking-rent achievability than the comps imply.
- What's the recent tenant-quality profile in this submarket — average credit score on applications, eviction rate, late-payment / NSF rate, and stable-employment percentage? A property-management company in the area should have these aggregated.
- How much new apartment / multifamily construction is in the pipeline within 1–3 miles? Heavy new supply (>2% of stock underway) typically softens rents 12–24 months out; light construction supports rent growth.
Investment metrics
- 1% rule
- 1.51% ✓
- Cap rate
- 8.64%
- Cash-on-cash
- 8.37%
- DSCR
- 1.37
- GRM
- 5.5
CMA / ARV
No comps found within radius.
Projected returns pro-forma
-3.0% appreciation · 4.02% rent growth · sell at horizon
- IRR
- -1.9%
- Equity multiple
- 0.93×
- Total profit
- $-1,970
- Equity at exit
- $14,761
- IRR
- 9.4%
- Equity multiple
- 1.77×
- Total profit
- $21,473
- Equity at exit
- $8,560
Cash invested: $27,720 (down + closing). Projections, not guarantees.
Landlord ↔ Tenant lean methodology
- Overall (STATE)
- 87 Strongly Landlord-Friendly
- State Florida
- 87 Strongly Landlord-Friendly · R+3
- County
- — inherits STATE
- City
- — inherits STATE
ZIP-level market 32920
- Home prices YoY
- -29.5%
- Rents YoY
- 4.0%
- Active inventory
- 219
- Price-to-rent
- 5.5×
Monthly cashflow live
- Estimated rent
- $1,493 high interval (Pro) →
- Mortgage (P&I)
- −$519
- Tax from tax record
- −$133 /mo · $1,591/yr
- Insurance
- −$41
- HOA
- −$293
- Vacancy / Maint / Mgmt
- −$313
- Net cashflow
- $193
Break-even live
UW: 25.0% down · 7.5% · 30yr · 1.5% tax · 5.0% vac · 8.0% maint · 8.0% mgmt
Financing live
Cash to close
- Down payment
- $24,750
- Closing costs
- $2,970
- Reserves months
- —
- Total cash needed
- —
Loan-product check · same deal, 3 products live
Conventional
25% down · 7.5% · 30yr
- Down + closing
- —
- Monthly P&I
- —
- Monthly cashflow
- —
- DSCR
- —
- Eligible?
- —
Personal DTI + credit; lowest rate.
DSCR
20% down · 8.5% · 30yr
- Down + closing
- —
- Monthly P&I
- —
- Monthly cashflow
- —
- DSCR
- —
- Eligible?
- —
No personal income docs; deal must DSCR.
Hard money
10% down · 12.0% · 12mo
- Down + closing
- —
- Monthly P&I
- —
- Monthly cashflow
- —
- DSCR
- —
- Eligible?
- —
Short-term bridge; refi at stabilization.
Rent comps 30 comps
| Address | Beds | Baths | Sqft | Rent | $/sqft | DOM | Units | Dist |
|---|---|---|---|---|---|---|---|---|
| 8522 N Atlantic Ave #71 Cape Canaveral, FL | 1.0 | 1.0 | 673 | $1,550 | $2.30 | 23d | 1 | 0.03mi |
| 211 Circle Dr Cape Canaveral, FL | 1.0 | 1.0 | 409 | $1,450 | $3.55 | 19d | 1 | 0.10mi |
| 201 Chandler St Cape Canaveral, FL | 1.0–2.0 | 1.0–2.0 | 700 | $1,150 | $1.64 | 19d | 1 | 0.14mi |
| 227 Canaveral Beach Blvd Cape Canaveral, FL | 1.0 | 1.0 | 700 | $1,600 | $2.29 | 19d | 1 | 0.14mi |
| 227 Canaveral Beach Blvd Unit 5 Cape Canaveral, FL | 1.0 | 1.0 | 700 | $1,600 | $2.29 | 21d | 1 | 0.15mi |
| 8401 N Atlantic Ave Cape Canaveral, FL | 1.0–2.0 | 1.0 | 707 | $1,200 | $1.70 | 14d | 5 | 0.23mi |
| 8401 N Atlantic Ave Cape Canaveral, FL | 1.0–2.0 | 1.0 | 707 | $1,250 | $1.77 | 21d | 5 | 0.23mi |
| 211 Caroline St Cape Canaveral, FL | 2.0 | 1.0 | 705 | $1,345 | $1.91 | 23d | 1 | 0.24mi |
| 128 Adams Ave Unit 1 Cape Canaveral, FL | 2.0 | 1.0 | 663 | $1,500 | $2.26 | 14d | 1 | 0.30mi |
| 201 Ocean Park Ln Unit V41 Cape Canaveral, FL | 1.0 | 1.0 | 703 | $1,800 | $2.56 | 23d | 1 | 0.45mi |
| 300 Monroe Ave #21 Cape Canaveral, FL | 1.0 | 1.0 | 608 | $1,500 | $2.47 | 14d | 1 | 0.47mi |
| 411 Madison Ave Unit N202 Cape Canaveral, FL | 1.0 | 1.0 | 672 | $1,650 | $2.46 | 23d | 1 | 0.48mi |
| 223 Columbia Dr #319 Cape Canaveral, FL | 1.0 | 1.0 | 680 | $1,400 | $2.06 | 23d | 1 | 0.49mi |
| 419 Madison Ave Unit 102 Cape Canaveral, FL | 1.0 | 1.0 | 672 | $1,450 | $2.16 | 23d | 1 | 0.49mi |
| 610 Jefferson Ave Cape Canaveral, FL | 1.0 | 1.0 | 619 | $2,000 | $3.23 | 19d | 2 | 0.51mi |
| 610 Jefferson Ave Cape Canaveral, FL | 1.0 | 1.0 | 619 | $2,000 | $3.23 | 23d | 3 | 0.51mi |
| 7801 Ridgewood Ave Cape Canaveral, FL | 1.0–3.0 | 1.0–2.0 | 893 | $1,400 | $1.57 | 21d | 3 | 0.59mi |
| 467 Jackson Ave Unit Back Unit Cape Canaveral, FL | 1.0 | 1.0 | 528 | $1,500 | $2.84 | 23d | 1 | 0.60mi |
| 7605 Ridgewood Ave Unit 11-1 Cape Canaveral, FL | 1.0 | 1.0 | 484 | $1,650 | $3.41 | 14d | 1 | 0.66mi |
| 355 Polk Ave #8 Cape Canaveral, FL | 1.0 | 1.0 | 550 | $1,300 | $2.36 | 14d | 1 | 0.73mi |
| 310 Taylor Ave Cape Canaveral, FL | 1.0–2.0 | 1.0 | 820 | $1,475 | $1.80 | 23d | 3 | 0.75mi |
| 7165 Ridgewood Ave #7 Cape Canaveral, FL | 1.0 | 1.0 | 487 | $1,900 | $3.90 | 23d | 1 | 0.91mi |
| 315 Grant Ave Cocoa Beach, FL | 2.0 | 2.0 | 720 | $1,795 | $2.49 | 14d | 1 | 1.13mi |
| 315 Grant Ave Cocoa Beach, FL | 2.0 | 2.0 | 720 | $1,795 | $2.49 | 23d | 1 | 1.13mi |
| 515 Hayes Ave Unit 1543008P Cocoa Beach, FL | 1.0 | 1.0 | 613 | $3,011 | $4.91 | 14d | 1 | 1.19mi |
| 150 Intrepid Way Unit 8D Cape Canaveral, FL | 1.0 | 1.5 | 737 | $1,550 | $2.10 | 23d | 1 | 1.20mi |
| 205 Cleveland Ave #1 Cocoa Beach, FL | 2.0 | 1.0 | 675 | $1,595 | $2.36 | 23d | 1 | 1.36mi |
| 209 Cleveland Ave Unit 4B Cocoa Beach, FL | 1.0 | 1.0 | 624 | $1,400 | $2.24 | 19d | 1 | 1.36mi |
| 209 Cleveland Ave Unit 4 Cocoa Beach, FL | 2.0 | 1.0 | 624 | $1,400 | $2.24 | 14d | 1 | 1.36mi |
| 135 Roosevelt Ave Unit A Cocoa Beach, FL | 2.0 | 1.0 | 730 | $1,550 | $2.12 | 23d | 1 | 1.48mi |
HOA detail condo
- Monthly dues
- $293 · $3,516/yr
- Likely covers
- pool
- Assessments
- None detected in remarks — confirm with the listing agent.
Listing history 8 events
-
2026-04-24status Pending
-
2026-03-03price $99,000
-
2026-01-30price $105,000
-
2025-11-11price $110,000
-
2025-11-03price $115,000
-
2025-09-28$125,000 Active
-
1982-04-01soldstatus $33,000
-
1977-02-01soldstatus $16,500
ⓘ Source: listings_history table (triggers on properties + properties_extension) + one-shot
backfill from property_details.listing_events for pre-trigger history.
Tax reassessment forecast FL · Resets to sale price
- Current annual tax
- $1,591 · $133/mo
- Projected year-2 tax
- $1,591 · $133/mo
- Expected delta
- $0/yr ($0/mo · 0.0%)
ⓘ Screening estimate from a state-policy table — verify with the county assessor before closing.
Climate risk First Street
- Flood 6/10 Major FEMA zone X (unshaded) · 54% chance over 30 yrs
- Wildfire 1/10 Low
- Heat 10/10 Extreme 7 d/yr ≥105°F today · 24 d/yr by 30 yrs out
- Wind 10/10 Extreme 99% chance of damaging wind over 30 yrs
- Air quality 1/10 Low 0 unhealthy d/yr today · 0 by 30 yrs out
Nearby sold comps map
Loading sold comps map…
Walkable amenities ~0.75 mi
Loading nearby amenities…
Taxation est. · year 1
- Rental income
- $17,914
- − Mortgage interest
- −$5,546
- − Property taxes
- −$1,591
- − Insurance
- −$495
- − Repairs & maintenance
- −$1,433
- − Management
- −$1,433
- − HOA
- −$3,516
- − Depreciation
- −$2,880
- Taxable income
- $1,021
- Est. tax owed @ 24.0%
- −$245
- After-tax cash flow
- $2,076/yr
For passive investors: Depreciation is non-cash, so a rental often shows a tax loss while cash-flowing — sheltering income. Rental losses are passive: they offset passive income freely, and up to $25,000/yr can offset ordinary (W-2) income if you actively participate and your MAGI is under $100k (phasing out to $0 by $150k); unused losses carry forward. On sale, claimed depreciation is recaptured at up to 25%, and gains may owe capital-gains tax (a 1031 exchange can defer both). Figures are a year-1 estimate at your 24.0% rate — not tax advice; consult a CPA.
Schools (NCES district)
- District
- Brevard
- NCES district ID
- 1200150
- Math proficiency
- 53% ▼ -9.00%
- Reading proficiency
- 57% ▼ -4.00%
- Median HH income
- $49,426
- Composite
- 46.86/100
- National rank
- #2370
- State rank
- #19 of 73 in FL
Livability — Cape Canaveral
- Score
- 84/100
- State rank
- #34
- US rank
- #677
Category grades
Schools grade is shown separately in the Schools card above.
Census & demographics
- Census place
- Cape Canaveral, FL
- County
- Brevard County · 602,871 people
- City population
- 10,005
- Metro
- Palm Bay-Melbourne-Titusville, FL
- Population (ZIP)
- 10,005
- Household income
- $66,955
- Rent vs Own
- Severe rent burden
- 477.0
Population outlook (Brevard County) Hauer SSP2
- Today (2025)
- 623,254 people
- By 2030
- 648,420 · +4.0%
- By 2040
- 690,009 · +10.7%
- By 2050
- 715,669 · +14.8%
- By 2075
- 775,744 · +24.5%
- By 2100
- 776,687 · +24.6%
Race, ethnicity, and origin ACS 2023
- Neighborhood character
- Predominantly White (86%)
- Race & ethnicity
- White 86% Hispanic / Latino 9% Two or more races 4%
- Hispanic origin (detail)
- Mexican 1% Puerto Rican 6%
- Common ancestry
- Romanian 5% Lithuanian 5% Serbian 2%
- Foreign-born
- 6% · Canada
- Languages at home
- 93% English-only · Spanish 4% Russian/Polish/Slavic 1% German/W. Germanic 1%
Political lean MEDSL · Brevard
- 2024 margin
- Strong R (+20.8) · D 39.1% · R 59.9% · Other 1.0%
- 2008→2024 swing
- -10.4pp toward R · 2008: -10.4pp · 2024: -20.8pp
- All cycles
- 2024: R+20.8 2020: R+16.4 2016: R+19.8 2012: R+12.7 2008: R+10.4
Not yet ingested
- Civics
- —
Market trends
- HPI YoY
- ▼ -125.71%
- Current HPI
- 300.9707
- Rent YoY
- ▲ 4.02%
- Metro
- Palm Bay-Melbourne-Titusville, FL
- State GDP YoY
- ▲ 3.28%
- F500 in state
- 36
Industry mix (Fortune 500 HQ in FL)
| Industry | F500 HQs | Revenue |
|---|---|---|
| Industrial Technology | 2 | $29B |
|
||
| Insurance | 2 | $17B |
|
||
| Retail | 1 | $60B |
|
||
| Technology Distribution | 1 | $58B |
|
||
| Homebuilding | 1 | $35B |
|
||
| Technology Manufacturing | 1 | $35B |
|
||
Price history
+500.0% since first listed8 events — show timeline
- 2026-04-24 Pending — SCMLS
- 2026-03-03 Price Changed $99,000 SCMLS
- 2026-01-30 Price Changed $105,000 SCMLS
- 2025-11-11 Price Changed $110,000 SCMLS
- 2025-11-03 Price Changed $115,000 SCMLS
- 2025-09-28 Listed $125,000 SCMLS
- 1982-04-01 Sold (Public Records) $33,000 Public Records
- 1977-02-01 Sold (Public Records) $16,500 Public Records
Property tax history
+9.1%/yrLatest (2025): $1,591 · +8.0% YoY. Source: county tax records.
Cash-flow waterfall
monthlySold comps — $/sqft
last 12 mo · ≤1 miLoading sold comps…