1047 Victoria Ln · Bolivar Peninsula, TX
Flood risk 10/10 · Severe
- FEMA flood zone
- VE
- Chance of flooding over 30 yrs
- 0.99%
- Est. flood insurance / yr
- $5,013 – $11,043
Fire risk 6/10 · Moderate
- Est. fire insurance / yr
- $1,222 – $2,270
Heat risk 10/10 · Severe
- Hot days now (above 108°F)
- 7 days/yr
- Hot days in 30 yrs
- 26 days/yr
Wind risk 10/10 · Severe
- Chance of severe wind over 30 yrs
- 99.0%
Air-quality risk 2/10 · Minimal
- Unhealthy air days now
- 1 days/yr
- Unhealthy air days in 30 yrs
- 1 days/yr
Risk factors via First Street. Map © Google.
Why this score? — see what drove the C+ grade
The composite is a weighted blend of 9 inputs, each scored 0–100. Each bar is that input's sub-score; the figure is the points it added to the 100-point composite (weight × sub-score).
- Cash flow +18.7/30.0
- ARV discount +15.0/15.0
- DSCR +5.9/10.0
- Schools +5.1/10.0
- Appreciation +5.0/10.0
- 1% rule +4.0/10.0
- Livability +3.2/5.0
- Rent growth +2.5/5.0
- Condition / age +2.5/5.0
$294,999
🖨 Deal sheet 📄 Offer letter ✓ Due diligence
Listing remarks MLS
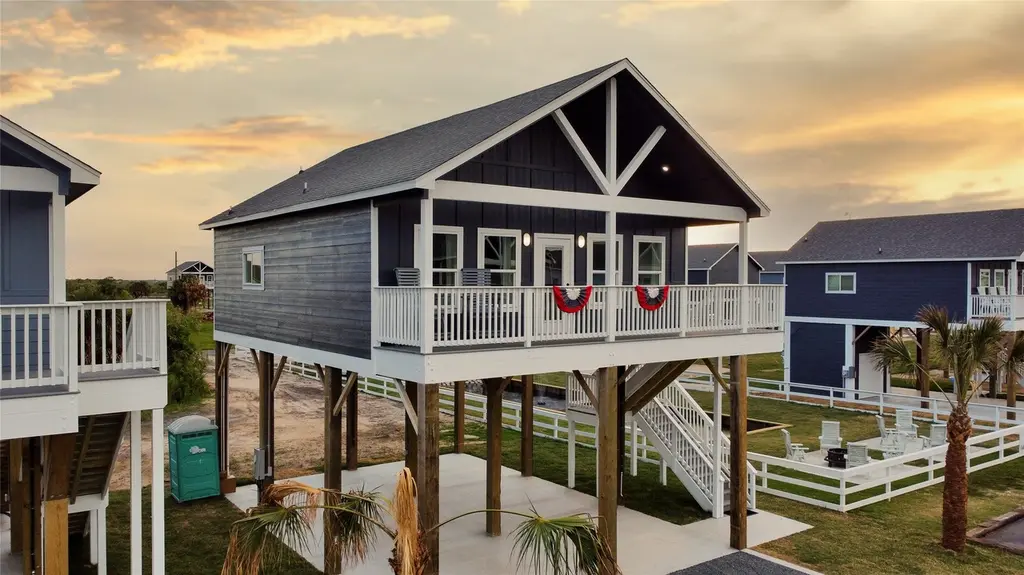
BEAUTIFUL NEW CONSTRUCTION STEPS FROM THE GULF. This is the base price for the 2 bed/2 bath floor plan in the Villas at Pelican Pass community located 200 yds from the Gulf with amazing Bay views. We offer options to including a loft, quartz counters, garage, outdoor shower & rv hookups. Villas come with appliances, hardwood flooring throughout & designer touches. MODELS are across from Rancho Carribe 9 hole golf course & Margaritaville on Hwy 87, 1021 Sunset Circle W, Crystal Beach.
Key facts
- 4,430 sq ft lot
- Listed 748 days
Tags
Neighborhood map
What this means for you Summary
Snapshot
- This is a 2-bed/2.0-bath land listed at $295k.
Deal economics
- At list price, monthly cash flow is $-375 ($-4k/yr) — negative.
- To cash-flow at today's rent, offer at most $229k (22.4% below list).
- To meet the 1% rule (rent ≥ 1% of price), the offer needs to be $266k (9.7% below list).
- Recommended offer: $229k (22.4% below list) — sets the bar for cash-flow.
- Cap rate 7.5% vs local median 2.1% in Bolivar Peninsula — top-decile yield for the area; either an underpriced asset or a hidden risk that comps aren't pricing in. Stress-test before assuming the spread holds.
Location & tenants
- Location reads 65/100 on livability (#719 in TX) — a middle-class / working-renter tenant base. Strengths: crime A+, cost of living A+, housing A+; Watch: schools D+, amenities F, commute F.
- High Island ISD (rural): math 65% / reading 50% proficiency, ranked #177 of 1,141 in TX (top 16%) — acceptable for families but not a draw, mixed tenant base, ~2y average lease.
- Market conditions: 227 active listings in the ZIP; 1 comparable units currently listed for rent nearby; 3,258 units permitted in Galveston County in 2024 (0 in 5+ unit buildings).
Forward outlook
- In year one you build about $11k of equity ($2k loan paydown + $9k appreciation (3.0% local appreciation)).
- Galveston County population projected at +43% by 2050 — long-run rental-demand tailwind backs the buy-and-hold thesis.
- By year 4, paydown + projected appreciation supports a ~$37k cash-out refi (75% LTV) — recoverable capital for the next deal without selling this one.
Negotiation context
- It's been on market 748 days — a 12% lower offer ($260k) is reasonable based on typical stale-listing flexibility.
- 2 sale attempts since 3y ago with the ask held roughly flat each time — persistent listings suggest the price (not the market) is what's stuck; bring a comps-based counter.
Risks & watch-outs
- Watch-outs: flood insurance adds $669/mo.
- Climate carrying-cost: in FEMA flood zone VE (mandatory federal flood insurance); severe wind risk, 99% chance of damaging wind over 30y; major wildfire risk; extreme-heat days projected 7→26/yr by 2055 (HVAC capex compounding) — expect insurance premiums to compound above CPI over the hold.
Questions for the listing agent
- What do current leases actually rent for vs. the listed asking? Can we see a recent rent roll and the last 12 months of T-12 income?
- It's been on market 748 days. Have you received any prior offers? Is the seller open to a 22% concession, seller financing, or rate buy-down credit?
- What's the actual annual flood-insurance premium (NFIP or private), and is the property in a SFHA with mandatory coverage?
- What does the HOA fee cover, when was the last increase, and are there any pending special assessments or reserve-fund shortfalls?
- Why hasn't it sold? Are there any deal-killer items the seller is aware of (foundation, flood, title, zoning, code violations)?
- Is there a deadline driving the sale (1031 exchange, divorce, estate, relocation)? That informs how much negotiation room exists.
- Schools are D-rated, which usually means shorter tenancies and higher turnover. Who's the typical renter profile here, and what's been the actual vacancy rate?
- What's the average days-on-market for RENTAL listings here right now (not sales)? A rising rental-DOM trend means longer vacancies and softer asking-rent achievability than the comps imply.
- What's the recent tenant-quality profile in this submarket — average credit score on applications, eviction rate, late-payment / NSF rate, and stable-employment percentage? A property-management company in the area should have these aggregated.
- How much new for-sale + rental construction is in the pipeline within 1–3 miles? Heavy new supply typically softens prices + rents 12–24 months out; constrained supply supports both.
Investment metrics
- 1% rule
- 0.90% ✗
- Cap rate
- 7.49%
- Cash-on-cash
- 4.27%
- DSCR
- 1.19
- GRM
- 9.2
CMA / ARV
- ARV (median comp)
- $431,759
- List price
- $294,999
- Delta
- -31.68%
- Verdict
- UNDERPRICED
- Comps
- 20 within 1.0 mi
Projected returns pro-forma
3.0% appreciation · 3.0% rent growth · sell at horizon
- IRR
- 2.5%
- Equity multiple
- 1.14×
- Total profit
- $11,974
- Equity at exit
- $132,644
- IRR
- 6.1%
- Equity multiple
- 1.93×
- Total profit
- $76,557
- Equity at exit
- $204,421
Cash invested: $82,600 (down + closing). Projections, not guarantees.
Landlord ↔ Tenant lean methodology
- Overall (STATE)
- 87 Strongly Landlord-Friendly
- State Texas
- 87 Strongly Landlord-Friendly · R+5
- County
- — inherits STATE
- City
- — inherits STATE
ZIP-level market 77617
- Active inventory
- 227
- Price-to-rent
- 9.2×
Monthly cashflow live
- Estimated rent
- $2,663 medium interval (Pro) →
- Mortgage (P&I)
- −$1,547
- Tax from tax record
- −$69 /mo · $824/yr
- Insurance
- −$123
- Flood insurance flood zone
- −$669 /mo · $8,028/yr
- HOA
- −$71
- Vacancy / Maint / Mgmt
- −$559
- Net cashflow
- $-375
Break-even live
UW: 25.0% down · 7.5% · 30yr · 1.5% tax · 5.0% vac · 8.0% maint · 8.0% mgmt
Financing live
Cash to close
- Down payment
- $73,750
- Closing costs
- $8,850
- Reserves months
- —
- Total cash needed
- —
Loan-product check · same deal, 3 products live
Conventional
25% down · 7.5% · 30yr
- Down + closing
- —
- Monthly P&I
- —
- Monthly cashflow
- —
- DSCR
- —
- Eligible?
- —
Personal DTI + credit; lowest rate.
DSCR
20% down · 8.5% · 30yr
- Down + closing
- —
- Monthly P&I
- —
- Monthly cashflow
- —
- DSCR
- —
- Eligible?
- —
No personal income docs; deal must DSCR.
Hard money
10% down · 12.0% · 12mo
- Down + closing
- —
- Monthly P&I
- —
- Monthly cashflow
- —
- DSCR
- —
- Eligible?
- —
Short-term bridge; refi at stabilization.
Rent comps 1 comps
| Address | Beds | Baths | Sqft | Rent | $/sqft | DOM | Units | Dist |
|---|---|---|---|---|---|---|---|---|
| 998 Dolly St Unit 1223259P Port Bolivar, TX | 3.0 | 2.0 | 1313 | $2,663 | $2.03 | 5d | 1 | 1.08mi |
HOA detail
- Monthly dues
- $71 · $852/yr
Listing history 18 events
-
2026-06-18days on market $294,999 Active 748 DOM
-
2026-06-17days on market $294,999 Active 747 DOM
-
2026-06-16days on market $294,999 Active 746 DOM
-
2026-06-15days on market $294,999 Active 745 DOM
-
2026-06-13days on market $294,999 Active 743 DOM
-
2026-06-12days on market $294,999 Active 742 DOM
-
2026-06-10days on market $294,999 Active 739 DOM
-
2026-06-08days on market $294,999 Active 738 DOM
-
2026-06-08days on market $294,999 Active 737 DOM
-
2026-06-07days on market $294,999 Active 736 DOM
-
2026-06-03days on market $294,999 Active 733 DOM
-
2026-06-02days on market $294,999 Active 732 DOM
-
2026-06-01days on market $294,999 Active 731 DOM
-
2026-05-31days on market $294,999 Active 730 DOM
-
2024-05-31$294,999 Active 500-char remark
Show marketing remark (500 chars)
BEAUTIFUL NEW CONSTRUCTION STEPS FROM THE GULF. This is the base price for the 2 bed/2 bath floor plan in the Villas at Pelican Pass community located 200 yds from the Gulf with amazing Bay views. We offer options to including a loft, quartz counters, garage, outdoor shower & rv hookups. Villas come with appliances, hardwood flooring throughout & designer touches. MODELS are across from Rancho Carribe 9 hole golf course & Margaritaville on Hwy 87, 1021 Sunset Circle W, Crystal Beach.
-
2023-10-06status Pending
-
2023-10-06historical
-
2023-06-02$57,863 Active
ⓘ Source: listings_history table (triggers on properties + properties_extension) + one-shot
backfill from property_details.listing_events for pre-trigger history.
Tax reassessment forecast TX · Resets to sale price
- Current annual tax
- $824 · $69/mo
- Projected year-2 tax
- $5,398 · $450/mo
- Expected delta
- +$4,574/yr (+$381/mo · 555.1%)
ⓘ Screening estimate from a state-policy table — verify with the county assessor before closing.
Climate risk First Street
- Flood 10/10 Extreme FEMA zone VE · 99% chance over 30 yrs
- Wildfire 6/10 Major
- Heat 10/10 Extreme 7 d/yr ≥108°F today · 26 d/yr by 30 yrs out
- Wind 10/10 Extreme 99% chance of damaging wind over 30 yrs
- Air quality 2/10 Low 1 unhealthy d/yr today · 1 by 30 yrs out
Nearby sold comps map
Loading sold comps map…
Walkable amenities ~0.75 mi
Loading nearby amenities…
Taxation est. · year 1
- Rental income
- $31,956
- − Mortgage interest
- −$16,525
- − Property taxes
- −$824
- − Insurance
- −$9,503
- − Repairs & maintenance
- −$2,556
- − Management
- −$2,556
- − HOA
- −$852
- − Depreciation
- −$8,582
- Taxable loss
- −$9,442
- Est. tax savings @ 24.0%
- +$2,266
- After-tax cash flow
- $-2,232/yr
For passive investors: Depreciation is non-cash, so a rental often shows a tax loss while cash-flowing — sheltering income. Rental losses are passive: they offset passive income freely, and up to $25,000/yr can offset ordinary (W-2) income if you actively participate and your MAGI is under $100k (phasing out to $0 by $150k); unused losses carry forward. On sale, claimed depreciation is recaptured at up to 25%, and gains may owe capital-gains tax (a 1031 exchange can defer both). Figures are a year-1 estimate at your 24.0% rate — not tax advice; consult a CPA.
Schools (NCES district)
- District
- High Island ISD
- NCES district ID
- 4823160
- Math proficiency
- 65% ▲ 30.00%
- Reading proficiency
- 50% ▲ 15.00%
- Median HH income
- $49,447
- Composite
- 50.69/100
- National rank
- #3933
- State rank
- #177 of 1141 in TX
Livability — Bolivar Peninsula
- Score
- 65/100
- State rank
- #719
- US rank
- #13437
Category grades
Schools grade is shown separately in the Schools card above.
Census & demographics
- Census place
- Bolivar Peninsula, TX
- City population
- 2,957
- Population (ZIP)
- 38
Population outlook (Galveston County) Hauer SSP2
- Today (2025)
- 390,640 people
- By 2030
- 425,226 · +8.9%
- By 2040
- 493,765 · +26.4%
- By 2050
- 559,698 · +43.3%
- By 2075
- 719,260 · +84.1%
- By 2100
- 819,628 · +109.8%
Race, ethnicity, and origin ACS 2023
- Neighborhood character
- Predominantly White (100%)
- Race & ethnicity
- White 100%
- Common ancestry
- Lithuanian 18% Serbian 18%
- Languages at home
- 84% English-only · Spanish 16%
Political lean MEDSL · Galveston
- 2024 margin
- Strong R (+27.4) · D 35.7% · R 63.1% · Other 1.2%
- 2008→2024 swing
- -7.9pp toward R · 2008: -19.5pp · 2024: -27.4pp
- All cycles
- 2024: R+27.4 2020: R+22.6 2016: R+22.6 2012: R+26.9 2008: R+19.5
Not yet ingested
- Civics
- —
Market trends
- HPI YoY
- —
- Current HPI
- —
- Rent YoY
- —
- Metro
- —
- State GDP YoY
- ▲ 3.95%
- F500 in state
- 110
Industry mix (Fortune 500 HQ in TX)
| Industry | F500 HQs | Revenue |
|---|---|---|
| Energy | 16 | $1,198B |
|
||
| Technology | 5 | $198B |
|
||
| Engineering / Construction | 4 | $72B |
|
||
| Energy Services | 3 | $60B |
|
||
| Utilities | 3 | $41B |
|
||
| Healthcare | 2 | $330B |
|
||
Price history
+409.8% since first listed4 events — show timeline
- 2024-05-31 Listed $294,999 HARMLS
- 2023-10-06 Pending — HARMLS
- 2023-10-06 Listing Removed — HARMLS
- 2023-06-02 Listed $57,863 HARMLS
Property tax history
+44.7%/yrLatest (2025): $824 · +146.1% YoY. Source: county tax records.
Cash-flow waterfall
monthlySold comps — $/sqft
last 12 mo · ≤1 miLoading sold comps…