 Duplex
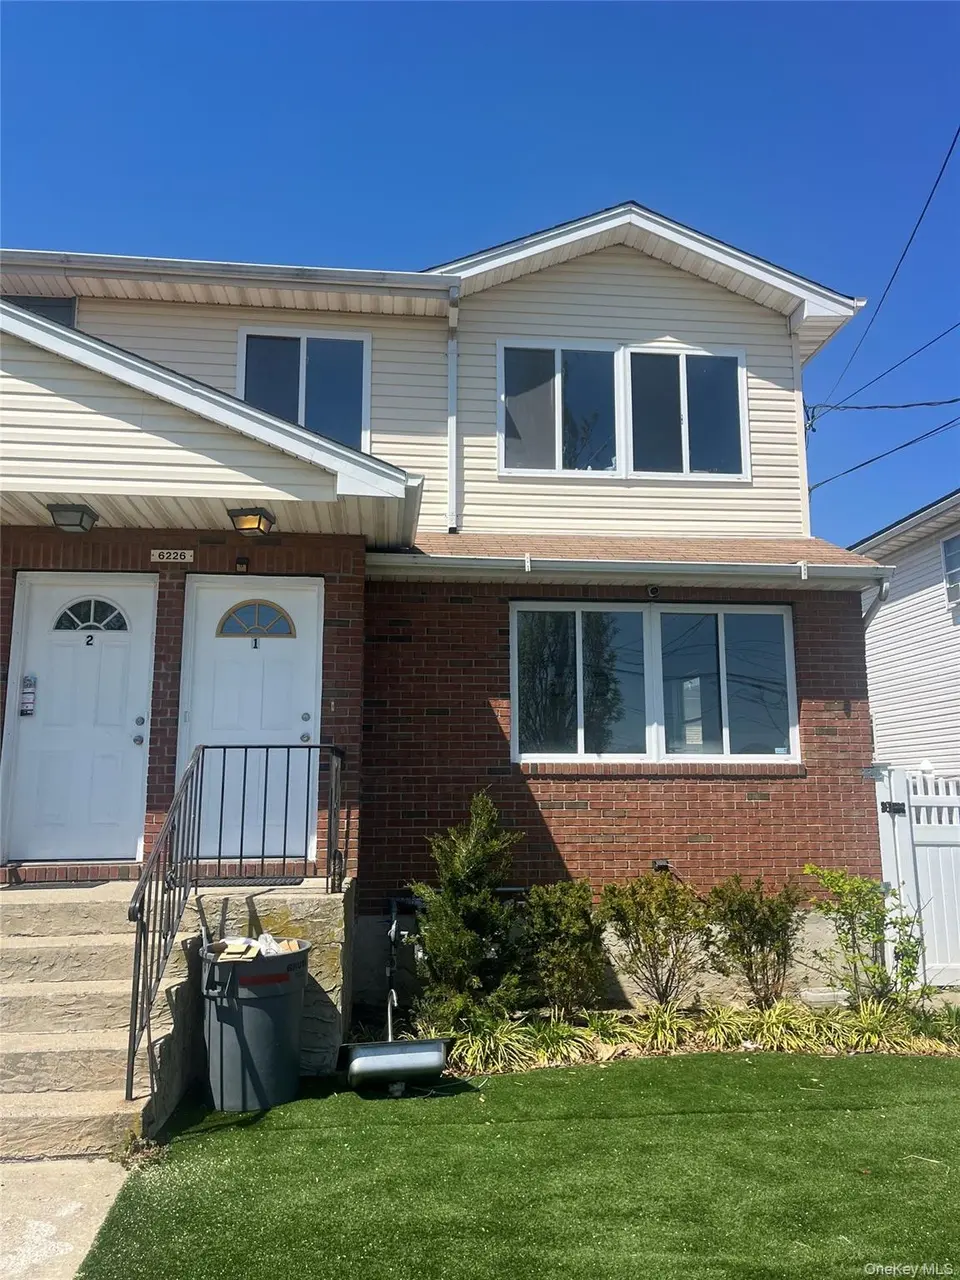
6226 Elizabeth Rd · New York, NY
Flood risk 7/10 · Major
- FEMA flood zone
- X (shaded)
- Chance of flooding over 30 yrs
- 0.96%
- Est. flood insurance / yr
- $507 – $1,088
Fire risk 1/10 · Minimal
- Est. fire insurance / yr
- $691 – $1,283
Heat risk 7/10 · Major
- Hot days now (above 96°F)
- 7 days/yr
- Hot days in 30 yrs
- 16 days/yr
Wind risk 6/10 · Moderate
- Chance of severe wind over 30 yrs
- 77.0%
Air-quality risk 3/10 · Minor
- Unhealthy air days now
- 4 days/yr
- Unhealthy air days in 30 yrs
- 4 days/yr
Risk factors via First Street. Map © Google.
Why this score? — see what drove the D grade
The composite is a weighted blend of 9 inputs, each scored 0–100. Each bar is that input's sub-score; the figure is the points it added to the 100-point composite (weight × sub-score).
- Cash flow +13.6/30.0
- Appreciation +10.0/10.0
- Schools +5.0/10.0
- DSCR +4.1/10.0
- Livability +3.8/5.0
- 1% rule +2.8/10.0
- Rent growth +2.5/5.0
- Condition / age +2.5/5.0
- ARV discount +0.4/15.0
$849,000
🖨 Deal sheet 📄 Offer letter ✓ Due diligence
Multi-family units
County records classify this as Multi-Family (2-4 Unit). Listing-text estimate: 2 units. confirmed
Listing remarks
Welcome to this spacious and well-maintained two-family home perfectly situated in the vibrant Rockaways. Whether you’re looking for an excellent investment opportunity or a place to Consider home with added rental income, this property has it all. The main unit offers a bright and airy open layout featuring a modern kitchen with stainless steel appliances, hardwood floors, and generous living and dining spaces ideal for entertaining. Upstairs, you’ll find comfortable bedrooms with ample closet space and updated bathrooms with contemporary finishes. The second unit provides flexibility — perfect for extended family, guests, or additional income potential. Each unit enjoys
Key facts
- 3,179 sq ft lot
- 2 parking spots
- Built 2003
Property features AI
Exterior
- Parking: Two-space carport
- Utilities: Electricity connected (PSEG); Natural gas connected; Public sewer; Water connected
- Home design: Duplex
- Construction: Brick and vinyl siding construction
- Exterior features: Brick and vinyl siding exterior; Not waterfront
Interior
- Kitchen: Open kitchen
- Bedrooms: One 2-bedroom unit; One 3-bedroom unit
- Bathrooms: Three full bathrooms (total)
- Heating & cooling: Baseboard heating; No central cooling
- Interior features: Open floor plan; Open kitchen; Washer/dryer hookups
- Laundry & utility: Washer hookup; Gas dryer hookup
Neighborhood map
What this means for you Summary
Snapshot
- This is a 2 × 2-bed/1.5-bath units multifamily listed at $849k.
Deal economics
- At list price, monthly cash flow is $-16 ($-192/yr) — negative. Per door: $-8/mo.
- To cash-flow at today's rent, offer at most $846k (0.3% below list).
- To meet the 1% rule (rent ≥ 1% of price), the offer needs to be $662k (22.0% below list).
- Recommended offer: $662k (22.0% below list) — sets the bar for 1% rule.
- Cap rate 6.4% vs local median 2.6% in New York — top-decile yield for the area; either an underpriced asset or a hidden risk that comps aren't pricing in. Stress-test before assuming the spread holds.
Location & tenants
- Location reads 75/100 on livability (#268 in NY, #4,188 nationally) — a middle-class / working-renter tenant base. Strengths: amenities A+, commute A+, health & safety A; Watch: crime F, cost of living F.
- Market conditions: 80 active listings in the ZIP; 4 comparable units currently listed for rent nearby; rentals at typical pace (median 25d on market — plan ~3-4 weeks tenant-placement turnaround); 5,302 units permitted in Queens County in 2024 (4,918 in 5+ unit buildings).
- At $6,619/mo this rent would consume 160% of the median local household income ($50k/yr) (locally 1734% of renters already pay >50% of income on rent) — very limited rent-growth headroom before tenants either downsize or default.
Forward outlook
- In year one you build about $91k of equity ($6k loan paydown + $85k appreciation (10.0% local appreciation)).
- Queens County population projected at +16% by 2050 — long-run rental-demand tailwind backs the buy-and-hold thesis.
- At projected returns (10.0% appreciation + 3.0% rent growth), your $238k cash investment doubles in ~3 years — after that, you're playing with house money.
- By year 2, paydown + projected appreciation supports a ~$146k cash-out refi (75% LTV) — recoverable capital for the next deal without selling this one.
Negotiation context
- Only 4 days on market — expect competitive offers; lowballing is unlikely to land.
Risks & watch-outs
- Watch-outs: flood insurance adds $66/mo.
- Climate carrying-cost: major flood risk; major wind risk, 77% chance of damaging wind over 30y; extreme-heat days projected 7→16/yr by 2055 (HVAC capex compounding) — expect insurance premiums to compound above CPI over the hold.
Questions for the listing agent
- What do current leases actually rent for vs. the listed asking? Can we see a recent rent roll and the last 12 months of T-12 income?
- Can we see the unit-by-unit rent roll, current vacancy, and any below-market leases? What's the average tenancy length?
- What capital expenditures (roof, boiler, parking lot, exteriors) have been made in the last 5 years, and what's planned in the next 2?
- What's the actual annual flood-insurance premium (NFIP or private), and is the property in a SFHA with mandatory coverage?
- Is there a deadline driving the sale (1031 exchange, divorce, estate, relocation)? That informs how much negotiation room exists.
- Schools are B-rated — typically a magnet for longer-tenancy family renters. What's the average tenant stay here, and is there a school-zone premium baked into asking?
- Crime grade is F in this area — have there been break-ins, vandalism, or insurance claims at this property in the last 3 years? What carrier currently insures it and at what premium?
- The area grade is low — what's the realistic commute time and amenity access for the typical tenant pool here? Any planned neighborhood developments (good or bad) we should know about?
- What's the average days-on-market for RENTAL listings here right now (not sales)? A rising rental-DOM trend means longer vacancies and softer asking-rent achievability than the comps imply.
- What's the recent tenant-quality profile in this submarket — average credit score on applications, eviction rate, late-payment / NSF rate, and stable-employment percentage? A property-management company in the area should have these aggregated.
- How much new apartment / multifamily construction is in the pipeline within 1–3 miles? Heavy new supply (>2% of stock underway) typically softens rents 12–24 months out; light construction supports rent growth.
Investment metrics
- 1% rule
- 0.78% ✗
- Cap rate
- 6.36%
- Cash-on-cash
- 0.25%
- DSCR
- 1.01
- GRM
- 10.7
CMA / ARV
- ARV (on-the-fly)
- $734,000
- Comps found
- 8
Show comp detail 8 sales within ~0.75 mi
| Address | Dist | Beds/Ba | Sqft | Sold | Price | $/sf | Match |
|---|---|---|---|---|---|---|---|
| 6235 Burchell Rd | 0.03mi | 5/3.0 (+1) | 2,000 (0%) | 5mo | $867,347 | $434 | 90 |
| 609 Beach 63rd St | 0.11mi | 5/2.0 (+1) | 2,068 (+3%) | 7mo | $565,000 | $273 | 74 |
| 193 Beach 59th St | 0.33mi | 5/3.0 (+1) | 2,052 (+3%) | 6mo | $710,000 | $346 | 70 |
| 618 Beach 67th St | 0.24mi | 4/2.0 | 1,946 (-3%) | 12mo | $715,000 | $367 | 70 |
| 65-05 Beach Channel Dr | 0.26mi | 5/2.0 (+1) | 2,024 (+1%) | 21mo | $700,000 | $346 | 60 |
| 69-43 Thursby Ave | 0.43mi | 5/2.0 (+1) | 2,068 (+3%) | 11mo | $810,000 | $392 | 56 |
| 345 Beach 73rd St | 0.57mi | 5/2.0 (+1) | 1,926 (-4%) | 13mo | $550,000 | $286 | 47 |
| 6523 Seaspray Ave | 0.54mi | 4/3.0 | 2,258 (+13%) | 8mo | $1,170,000 | $518 | 47 |
Match score weights: distance 35% · size 25% · config 20% · recency 20%. Top-matched comps best support the ARV.
Projected returns pro-forma
10.0% appreciation · 3.0% rent growth · sell at horizon
- IRR
- 24.2%
- Equity multiple
- 2.94×
- Total profit
- $461,084
- Equity at exit
- $764,846
- IRR
- 21.4%
- Equity multiple
- 6.71×
- Total profit
- $1,358,059
- Equity at exit
- $1,649,420
Cash invested: $237,720 (down + closing). Projections, not guarantees.
Landlord ↔ Tenant lean methodology
- Overall (CITY)
- 0 Strongly Tenant-Friendly
- State New York
- 15 Strongly Tenant-Friendly · D+10
- County
- — inherits STATE
- City New York
- 0 Strongly Tenant-Friendly · D+34
ZIP-level market 11692
- Home prices YoY
- 14.4%
- Active inventory
- 80
- Price-to-rent
- 21.4×
Monthly cashflow live
- Estimated rent
- $6,619 medium interval (Pro) →
- Mortgage (P&I)
- −$4,452
- Tax from tax record
- −$373 /mo · $4,471/yr
- Insurance
- −$354
- Flood insurance flood zone
- −$66 /mo · $798/yr
- HOA
- −$0
- Vacancy / Maint / Mgmt
- −$1,390
- Net cashflow
- $-16
Break-even live
2-unit breakdown (identical units grouped — click to expand)
| Units | Beds | Baths | Est. rent |
|---|---|---|---|
| 2× units | 2 | 1.5 | $6,620 |
| #1 | 2 | 1.5 | $3,310 |
| #2 | 2 | 1.5 | $3,310 |
| Total (2 units) | $6,619 | ||
UW: 25.0% down · 7.5% · 30yr · 1.5% tax · 5.0% vac · 8.0% maint · 8.0% mgmt
Financing live
Cash to close
- Down payment
- $212,250
- Closing costs
- $25,470
- Reserves months
- —
- Total cash needed
- —
Loan-product check · same deal, 3 products live
Conventional
25% down · 7.5% · 30yr
- Down + closing
- —
- Monthly P&I
- —
- Monthly cashflow
- —
- DSCR
- —
- Eligible?
- —
Personal DTI + credit; lowest rate.
DSCR
20% down · 8.5% · 30yr
- Down + closing
- —
- Monthly P&I
- —
- Monthly cashflow
- —
- DSCR
- —
- Eligible?
- —
No personal income docs; deal must DSCR.
Hard money
10% down · 12.0% · 12mo
- Down + closing
- —
- Monthly P&I
- —
- Monthly cashflow
- —
- DSCR
- —
- Eligible?
- —
Short-term bridge; refi at stabilization.
Rent comps 4 comps
| Address | Beds | Baths | Sqft | Rent | $/sqft | DOM | Units | Dist |
|---|---|---|---|---|---|---|---|---|
| 6935 Hessler Ave Arverne, NY | 3.0 | 1.5 | 1596 | $3,300 | $2.07 | 25d | 1 | 0.43mi |
| 75-18 Aquatic Dr Unit B Arverne, NY | 3.0 | 2.5 | 2034 | $3,500 | $1.72 | 25d | 1 | 0.76mi |
| 325 Beach 46th St Far Rockaway, NY | 3.0 | 1.5 | 2250 | $3,100 | $1.38 | 25d | 1 | 0.77mi |
| 8-27 Hartman Ln Unit 1ST Far Rockaway, NY | 3.0 | 1.5 | 2937 | $3,250 | $1.11 | 21d | 1 | 1.45mi |
Listing history 10 events
-
2026-06-18days on market $849,000 Active 4 DOM
-
2026-06-17days on market $849,000 Active 3 DOM
-
2026-06-16days on market $849,000 Active 2 DOM
-
2026-06-15statusdays on market $849,000 Active 1 DOM
-
2026-06-13days on market $849,000 Coming Soon 10 DOM
-
2026-06-09days on market $849,000 Coming Soon 6 DOM
-
2026-06-08days on market $849,000 Coming Soon 5 DOM
-
2026-06-07days on market $849,000 Coming Soon 4 DOM
-
2026-06-04remarks 681-char remark
-
2026-06-04$849,000 Coming Soon 1 DOM
ⓘ Source: listings_history table (triggers on properties + properties_extension) + one-shot
backfill from property_details.listing_events for pre-trigger history.
Tax reassessment forecast NY · Partial reset (capped growth)
- Current annual tax
- $4,471 · $373/mo
- Projected year-2 tax
- $9,410 · $784/mo
- Expected delta
- +$4,939/yr (+$412/mo · 110.5%)
ⓘ Screening estimate from a state-policy table — verify with the county assessor before closing.
Climate risk First Street
- Flood 7/10 Severe FEMA zone X (shaded) · 96% chance over 30 yrs
- Wildfire 1/10 Low
- Heat 7/10 Severe 7 d/yr ≥96°F today · 16 d/yr by 30 yrs out
- Wind 6/10 Major 77% chance of damaging wind over 30 yrs
- Air quality 3/10 Moderate 4 unhealthy d/yr today · 4 by 30 yrs out
Nearby sold comps map
Loading sold comps map…
Walkable amenities ~0.75 mi
Loading nearby amenities…
Taxation est. · year 1
- Rental income
- $79,428
- − Mortgage interest
- −$47,557
- − Property taxes
- −$4,471
- − Insurance
- −$5,042
- − Repairs & maintenance
- −$6,354
- − Management
- −$6,354
- − Depreciation
- −$24,698
- Taxable loss
- −$15,049
- Est. tax savings @ 24.0%
- +$3,612
- After-tax cash flow
- $3,419/yr
For passive investors: Depreciation is non-cash, so a rental often shows a tax loss while cash-flowing — sheltering income. Rental losses are passive: they offset passive income freely, and up to $25,000/yr can offset ordinary (W-2) income if you actively participate and your MAGI is under $100k (phasing out to $0 by $150k); unused losses carry forward. On sale, claimed depreciation is recaptured at up to 25%, and gains may owe capital-gains tax (a 1031 exchange can defer both). Figures are a year-1 estimate at your 24.0% rate — not tax advice; consult a CPA.
Schools (NCES district)
No district data.
Livability — New York
- Score
- 75/100
- State rank
- #268
- US rank
- #4188
Category grades
Schools grade is shown separately in the Schools card above.
Census & demographics
- Census place
- New York, NY
- County
- Queens County · 1,914,869 people
- City population
- 7,731,280
- Metro
- New York-Newark-Jersey City, NY-NJ-PA
- Population (ZIP)
- 22,734
- Household income
- $49,720
- Rent vs Own
- Severe rent burden
- 1734.0
Population outlook (Queens County) Hauer SSP2
- Today (2025)
- 2,546,320 people
- By 2030
- 2,643,059 · +3.8%
- By 2040
- 2,815,563 · +10.6%
- By 2050
- 2,944,423 · +15.6%
- By 2075
- 3,123,338 · +22.7%
- By 2100
- 3,098,688 · +21.7%
Race, ethnicity, and origin ACS 2023
- Neighborhood character
- Diverse neighborhood (Simpson 0.64)
- Race & ethnicity
- Black 53% Hispanic / Latino 24% Two or more races 15% White 13% Asian 6%
- Hispanic origin (detail)
- Puerto Rican 10% Dominican 5%
- Common ancestry
- Romanian 1%
- Foreign-born
- 31% · Canada, China, Jamaica
- Languages at home
- 67% English-only · Spanish 18% Other Indo-European 3% Russian/Polish/Slavic 3%
Political lean MEDSL · Queens
- 2024 margin
- Strong D (+24.6) · D 62.3% · R 37.7%
- 2008→2024 swing
- -26.2pp toward R · 2008: 50.8pp · 2024: 24.6pp
- All cycles
- 2024: D+24.6 2020: D+45.2 2016: D+53.4 2012: D+58.5 2008: D+50.8
Not yet ingested
- Civics
- —
Market trends
- HPI YoY
- ▲ 44.49%
- Current HPI
- 354.2007
- Rent YoY
- —
- Metro
- New York-Newark-Jersey City, NY-NJ-PA
- State GDP YoY
- ▲ 2.60%
- F500 in state
- 92
Industry mix (Fortune 500 HQ in NY)
| Industry | F500 HQs | Revenue |
|---|---|---|
| Financial Services | 10 | $950B |
|
||
| Consumer Goods | 9 | $162B |
|
||
| Insurance | 4 | $225B |
|
||
| Telecommunications | 2 | $144B |
|
||
| Pharmaceuticals | 2 | $112B |
|
||
| Media / Entertainment | 2 | $69B |
|
||
Price history
+41.7% since first listed3 events — show timeline
- 2026-06-03 Coming Soon $849,000 OneKey® MLS as Distributed by MLS Grid
- 2019-03-26 Listing Removed — OneKey® MLS as Distributed by MLS Grid
- 2018-09-12 Listed $599,000 OneKey® MLS as Distributed by MLS Grid
Property tax history
+5.4%/yrLatest (2025): $4,471 · -2.4% YoY. Source: county tax records.
Cash-flow waterfall
monthlySold comps — $/sqft
last 12 mo · ≤1 miLoading sold comps…