1335 Sapphire Palms Ct · San Leon, TX
Flood risk 10/10 · Severe
- FEMA flood zone
- AE
- Chance of flooding over 30 yrs
- 0.99%
- Est. flood insurance / yr
- $1,737 – $8,500
Fire risk 1/10 · Minimal
- Est. fire insurance / yr
- $1,222 – $2,270
Heat risk 10/10 · Severe
- Hot days now (above 109°F)
- 7 days/yr
- Hot days in 30 yrs
- 27 days/yr
Wind risk 10/10 · Severe
- Chance of severe wind over 30 yrs
- 99.0%
Air-quality risk 2/10 · Minimal
- Unhealthy air days now
- 1 days/yr
- Unhealthy air days in 30 yrs
- 1 days/yr
Risk factors via First Street. Map © Google.
Why this score? — see what drove the C+ grade
The composite is a weighted blend of 9 inputs, each scored 0–100. Each bar is that input's sub-score; the figure is the points it added to the 100-point composite (weight × sub-score).
- Cash flow +22.2/30.0
- ARV discount +15.0/15.0
- DSCR +7.1/10.0
- 1% rule +4.5/10.0
- Schools +3.5/10.0
- Livability +3.1/5.0
- Rent growth +2.5/5.0
- Condition / age +2.5/5.0
- Appreciation +0.0/10.0
$293,550
🖨 Deal sheet 📄 Offer letter ✓ Due diligence
Listing remarks MLS
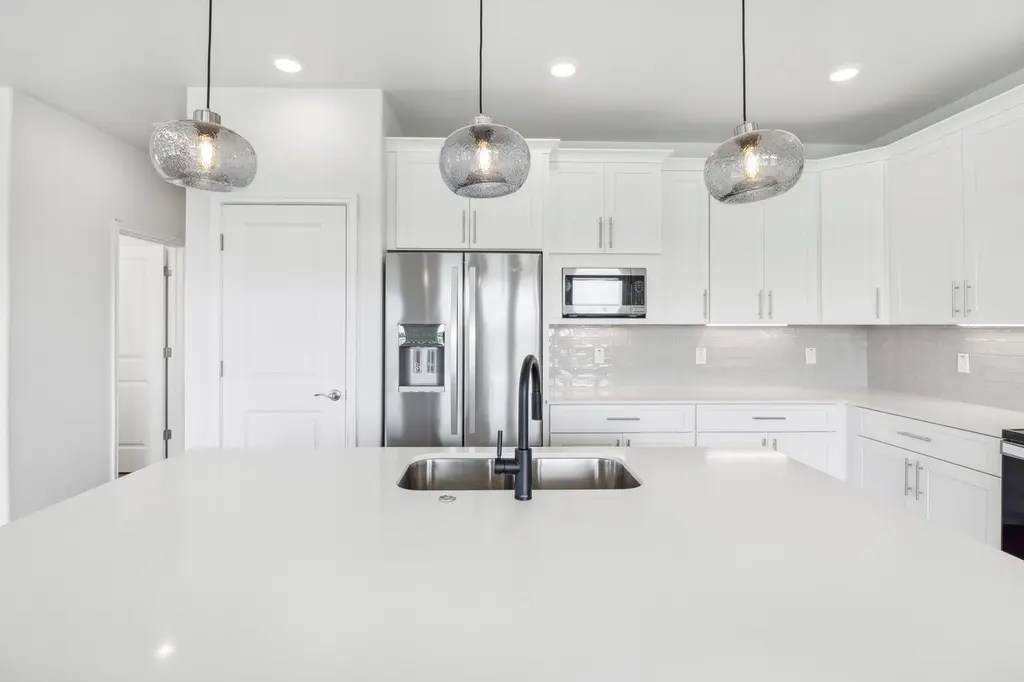
Welcome to a beautiful new subdivision in San Leon, featuring new hardy plank construction homes. Each home includes a covered front porch and an optional rear porch off the primary bedroom. All windows and exterior doors are hurricane/impact rated for added safety. Enjoy vinyl plank flooring throughout the living spaces, with tiled floors in the bathrooms. The kitchen and vanity tops are crafted from elegant quartz. Interior doors are designed with a 2-panel square top, while exterior handrails and ground floor framing are painted white. Choose your exterior siding color from a community-selected palette. The homes boast efficient insulation: R19 for walls, R30 for cold floors, and R40 for attics. Experience coastal living close to Galveston Bay in this charming new Bayside subdivision of 22 homes!
Key facts
- Covered front porch
- Quartz kitchen tops
- Tiled floors
Tags
Neighborhood map
What this means for you Summary
Snapshot
- This is a 3-bed/2.0-bath land listed at $294k.
Deal economics
- At list price, monthly cash flow is $53 ($633/yr) — positive.
- The deal already cash-flows at list — no discount required.
- To meet the 1% rule (rent ≥ 1% of price), the offer needs to be $280k (4.6% below list).
- Recommended offer: $258k (12.0% below list) — sets the bar for market timing.
- Cap rate 8.3% vs local median 1.8% in San Leon — top-decile yield for the area; either an underpriced asset or a hidden risk that comps aren't pricing in. Stress-test before assuming the spread holds.
Location & tenants
- Location reads 62/100 on livability (#899 in TX) — a middle-class / working-renter tenant base. Strengths: cost of living A+, housing A+, employment B+; Watch: schools F, amenities F, commute F.
- Dickinson ISD (suburban): math 39% / reading 40% proficiency, ranked #366 of 826 in TX (top 44%) — families likely to look elsewhere, expect single-tenant / working-renter base with shorter leases; 60% free/reduced lunch — lower-income household profile, screen leases tightly.
- Market conditions: Rents soft (-0.1%/yr); 664 active listings in the ZIP; 2 comparable units currently listed for rent nearby; solid renter incomes; 3,258 units permitted in Galveston County in 2024 (0 in 5+ unit buildings).
- This rent runs 38% of the median local income ($89k/yr) — at the standard rent-burdened threshold; future hikes will face affordability resistance.
Forward outlook
- Local home prices are declining (-3.0%/yr); year-one equity from $2k of loan paydown is wiped out by about $9k of value loss. Plan a longer hold.
- Galveston County population projected at +43% by 2050 — long-run rental-demand tailwind backs the buy-and-hold thesis.
Negotiation context
- It's been on market 365 days — a 12% lower offer ($258k) is reasonable based on typical stale-listing flexibility.
- 3 sale attempts since 2y ago with the ask held roughly flat each time — persistent listings suggest the price (not the market) is what's stuck; bring a comps-based counter.
Risks & watch-outs
- Watch-outs: flood insurance adds $427/mo.
- Climate carrying-cost: in FEMA flood zone AE (mandatory federal flood insurance); severe wind risk, 99% chance of damaging wind over 30y; extreme-heat days projected 7→27/yr by 2055 (HVAC capex compounding) — expect insurance premiums to compound above CPI over the hold.
Questions for the listing agent
- It's been on market 365 days. Have you received any prior offers? Is the seller open to a 12% concession, seller financing, or rate buy-down credit?
- What's the actual annual flood-insurance premium (NFIP or private), and is the property in a SFHA with mandatory coverage?
- Why hasn't it sold? Are there any deal-killer items the seller is aware of (foundation, flood, title, zoning, code violations)?
- Is there a deadline driving the sale (1031 exchange, divorce, estate, relocation)? That informs how much negotiation room exists.
- Schools are F-rated, which usually means shorter tenancies and higher turnover. Who's the typical renter profile here, and what's been the actual vacancy rate?
- What's the average days-on-market for RENTAL listings here right now (not sales)? A rising rental-DOM trend means longer vacancies and softer asking-rent achievability than the comps imply.
- What's the recent tenant-quality profile in this submarket — average credit score on applications, eviction rate, late-payment / NSF rate, and stable-employment percentage? A property-management company in the area should have these aggregated.
- How much new for-sale + rental construction is in the pipeline within 1–3 miles? Heavy new supply typically softens prices + rents 12–24 months out; constrained supply supports both.
Investment metrics
- 1% rule
- 0.95% ✗
- Cap rate
- 8.25%
- Cash-on-cash
- 7.00%
- DSCR
- 1.31
- GRM
- 8.7
CMA / ARV
- ARV (median comp)
- $392,620
- List price
- $293,550
- Delta
- -25.23%
- Verdict
- UNDERPRICED
- Comps
- 20 within 1.0 mi
Projected returns pro-forma
-3.0% appreciation · 0.0% rent growth · sell at horizon
- IRR
- -18.7%
- Equity multiple
- 0.36×
- Total profit
- $-52,295
- Equity at exit
- $43,769
- IRR
- -19.3%
- Equity multiple
- 0.12×
- Total profit
- $-72,440
- Equity at exit
- $25,381
Cash invested: $82,194 (down + closing). Projections, not guarantees.
Landlord ↔ Tenant lean methodology
- Overall (STATE)
- 87 Strongly Landlord-Friendly
- State Texas
- 87 Strongly Landlord-Friendly · R+5
- County
- — inherits STATE
- City
- — inherits STATE
ZIP-level market 77539
- Home prices YoY
- -29.8%
- Rents YoY
- -0.1%
- Active inventory
- 664
- Price-to-rent
- 8.7×
Monthly cashflow live
- Estimated rent
- $2,802 medium interval (Pro) →
- Mortgage (P&I)
- −$1,539
- Tax from tax record
- −$72 /mo · $866/yr
- Insurance
- −$122
- Flood insurance flood zone
- −$427 /mo · $5,118/yr
- HOA
- −$0
- Vacancy / Maint / Mgmt
- −$588
- Net cashflow
- $53
Break-even live
UW: 25.0% down · 7.5% · 30yr · 1.5% tax · 5.0% vac · 8.0% maint · 8.0% mgmt
Financing live
Cash to close
- Down payment
- $73,388
- Closing costs
- $8,806
- Reserves months
- —
- Total cash needed
- —
Loan-product check · same deal, 3 products live
Conventional
25% down · 7.5% · 30yr
- Down + closing
- —
- Monthly P&I
- —
- Monthly cashflow
- —
- DSCR
- —
- Eligible?
- —
Personal DTI + credit; lowest rate.
DSCR
20% down · 8.5% · 30yr
- Down + closing
- —
- Monthly P&I
- —
- Monthly cashflow
- —
- DSCR
- —
- Eligible?
- —
No personal income docs; deal must DSCR.
Hard money
10% down · 12.0% · 12mo
- Down + closing
- —
- Monthly P&I
- —
- Monthly cashflow
- —
- DSCR
- —
- Eligible?
- —
Short-term bridge; refi at stabilization.
Rent comps 2 comps
| Address | Beds | Baths | Sqft | Rent | $/sqft | DOM | Units | Dist |
|---|---|---|---|---|---|---|---|---|
| 2735 Broadway St Unit 1546437P San Leon, TX | 3.0 | 2.0 | 1819 | $4,994 | $2.75 | 12d | 1 | 1.46mi |
| 535 12th St Dickinson, TX | 3.0 | 2.0 | 1248 | $1,950 | $1.56 | 1d | 1 | 1.48mi |
Listing history 15 events
-
2026-06-13days on market $293,550 Active 365 DOM
-
2026-06-09days on market $293,550 Active 361 DOM
-
2026-06-08days on market $293,550 Active 360 DOM
-
2026-06-07days on market $293,550 Active 359 DOM
-
2026-06-04days on market $293,550 Active 356 DOM
-
2026-06-03days on market $293,550 Active 355 DOM
-
2026-06-02days on market $293,550 Active 354 DOM
-
2026-06-02days on market $293,550 Active 353 DOM
-
2026-05-31days on market $293,550 Active 352 DOM
-
2025-06-13$293,550 Active 810-char remark
Show marketing remark (810 chars)
Welcome to a beautiful new subdivision in San Leon, featuring new hardy plank construction homes. Each home includes a covered front porch and an optional rear porch off the primary bedroom. All windows and exterior doors are hurricane/impact rated for added safety. Enjoy vinyl plank flooring throughout the living spaces, with tiled floors in the bathrooms. The kitchen and vanity tops are crafted from elegant quartz. Interior doors are designed with a 2-panel square top, while exterior handrails and ground floor framing are painted white. Choose your exterior siding color from a community-selected palette. The homes boast efficient insulation: R19 for walls, R30 for cold floors, and R40 for attics. Experience coastal living close to Galveston Bay in this charming new Bayside subdivision of 22 homes!
-
2025-06-13historical
Show marketing remark (810 chars)
Welcome to a beautiful new subdivision in San Leon, featuring new hardy plank construction homes. Each home includes a covered front porch and an optional rear porch off the primary bedroom. All windows and exterior doors are hurricane/impact rated for added safety. Enjoy vinyl plank flooring throughout the living spaces, with tiled floors in the bathrooms. The kitchen and vanity tops are crafted from elegant quartz. Interior doors are designed with a 2-panel square top, while exterior handrails and ground floor framing are painted white. Choose your exterior siding color from a community-selected palette. The homes boast efficient insulation: R19 for walls, R30 for cold floors, and R40 for attics. Experience coastal living close to Galveston Bay in this charming new Bayside subdivision of 22 homes!
-
2025-02-12$285,000 Active
-
2025-02-12historical
-
2024-08-23price $285,000
-
2024-07-21$350,000 Active
ⓘ Source: listings_history table (triggers on properties + properties_extension) + one-shot
backfill from property_details.listing_events for pre-trigger history.
Tax reassessment forecast TX · Resets to sale price
- Current annual tax
- $866 · $72/mo
- Projected year-2 tax
- $5,372 · $448/mo
- Expected delta
- +$4,506/yr (+$375/mo · 520.3%)
ⓘ Screening estimate from a state-policy table — verify with the county assessor before closing.
Climate risk First Street
- Flood 10/10 Extreme FEMA zone AE · 99% chance over 30 yrs
- Wildfire 1/10 Low
- Heat 10/10 Extreme 7 d/yr ≥109°F today · 27 d/yr by 30 yrs out
- Wind 10/10 Extreme 99% chance of damaging wind over 30 yrs
- Air quality 2/10 Low 1 unhealthy d/yr today · 1 by 30 yrs out
Nearby sold comps map
Loading sold comps map…
Walkable amenities ~0.75 mi
Loading nearby amenities…
Taxation est. · year 1
- Rental income
- $33,618
- − Mortgage interest
- −$16,443
- − Property taxes
- −$866
- − Insurance
- −$6,586
- − Repairs & maintenance
- −$2,689
- − Management
- −$2,689
- − Depreciation
- −$8,540
- Taxable loss
- −$4,196
- Est. tax savings @ 24.0%
- +$1,007
- After-tax cash flow
- $1,640/yr
For passive investors: Depreciation is non-cash, so a rental often shows a tax loss while cash-flowing — sheltering income. Rental losses are passive: they offset passive income freely, and up to $25,000/yr can offset ordinary (W-2) income if you actively participate and your MAGI is under $100k (phasing out to $0 by $150k); unused losses carry forward. On sale, claimed depreciation is recaptured at up to 25%, and gains may owe capital-gains tax (a 1031 exchange can defer both). Figures are a year-1 estimate at your 24.0% rate — not tax advice; consult a CPA.
Schools (NCES district)
- District
- Dickinson ISD
- NCES district ID
- 4817070
- Math proficiency
- 39% ▼ -11.00%
- Reading proficiency
- 40% ▼ -2.00%
- Median HH income
- $61,318
- Composite
- 35.16/100
- National rank
- #5005
- State rank
- #366 of 826 in TX
Livability — San Leon
- Score
- 62/100
- State rank
- #899
- US rank
- #16159
Category grades
Schools grade is shown separately in the Schools card above.
Census & demographics
- Census place
- San Leon, TX
- County
- Galveston County · 357,330 people
- Metro
- Houston-The Woodlands-Sugar Land, TX
- Population (ZIP)
- 49,375
- Household income
- $89,111
- Rent vs Own
- Severe rent burden
- 869.0
Population outlook (Galveston County) Hauer SSP2
- Today (2025)
- 390,640 people
- By 2030
- 425,226 · +8.9%
- By 2040
- 493,765 · +26.4%
- By 2050
- 559,698 · +43.3%
- By 2075
- 719,260 · +84.1%
- By 2100
- 819,628 · +109.8%
Race, ethnicity, and origin ACS 2023
- Neighborhood character
- Diverse neighborhood (Simpson 0.64)
- Race & ethnicity
- White 47% Hispanic / Latino 37% Two or more races 19% Black 10% Asian 3%
- Hispanic origin (detail)
- Mexican 29% Puerto Rican 2%
- Common ancestry
- Italian 3% Romanian 2% Lithuanian 1%
- Foreign-born
- 13% · Canada, Vietnam
- Languages at home
- 73% English-only · Spanish 24% Vietnamese 1% Other Indo-European 1%
Political lean MEDSL · Galveston
- 2024 margin
- Strong R (+27.4) · D 35.7% · R 63.1% · Other 1.2%
- 2008→2024 swing
- -7.9pp toward R · 2008: -19.5pp · 2024: -27.4pp
- All cycles
- 2024: R+27.4 2020: R+22.6 2016: R+22.6 2012: R+26.9 2008: R+19.5
Not yet ingested
- Civics
- —
Market trends
- HPI YoY
- ▼ -109.46%
- Current HPI
- 258.0104
- Rent YoY
- ▼ -0.12%
- Metro
- Houston-The Woodlands-Sugar Land, TX
- State GDP YoY
- ▲ 3.95%
- F500 in state
- 110
Industry mix (Fortune 500 HQ in TX)
| Industry | F500 HQs | Revenue |
|---|---|---|
| Energy | 16 | $1,198B |
|
||
| Technology | 5 | $198B |
|
||
| Engineering / Construction | 4 | $72B |
|
||
| Energy Services | 3 | $60B |
|
||
| Utilities | 3 | $41B |
|
||
| Healthcare | 2 | $330B |
|
||
Price history
-16.1% since first listed6 events — show timeline
- 2025-06-13 Listing Removed — HARMLS
- 2025-06-13 Listed $293,550 HARMLS
- 2025-02-12 Listing Removed — HARMLS
- 2025-02-12 Listed $285,000 HARMLS
- 2024-08-23 Price Changed $285,000 HARMLS
- 2024-07-21 Listed $350,000 HARMLS
Property tax history
-1.2%/yrLatest (2025): $866 · +0.2% YoY. Source: county tax records.
Cash-flow waterfall
monthlySold comps — $/sqft
last 12 mo · ≤1 miLoading sold comps…