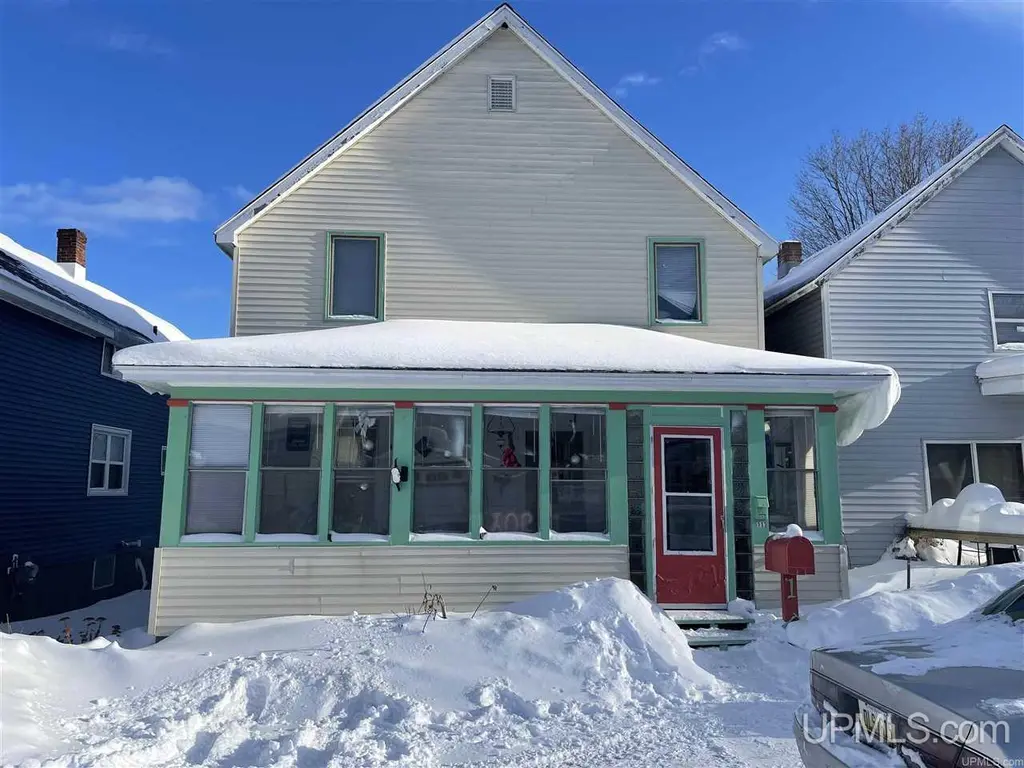
113 Chestnut St · Munising, MI
Flood risk 5/10 · Moderate
- FEMA flood zone
- —
- Chance of flooding over 30 yrs
- 0.67%
- Est. flood insurance / yr
- —
Fire risk 3/10 · Minor
- Est. fire insurance / yr
- $784 – $1,456
Heat risk 1/10 · Minimal
- Hot days now (above 90°F)
- 7 days/yr
- Hot days in 30 yrs
- 13 days/yr
Wind risk 1/10 · Minimal
- Chance of severe wind over 30 yrs
- —
Air-quality risk 1/10 · Minimal
- Unhealthy air days now
- 0 days/yr
- Unhealthy air days in 30 yrs
- 0 days/yr
Risk factors via First Street. Map © Google.
Why this score? — see what drove the C- grade
The composite is a weighted blend of 9 inputs, each scored 0–100. Each bar is that input's sub-score; the figure is the points it added to the 100-point composite (weight × sub-score).
- Cash flow +17.5/30.0
- ARV discount +15.0/15.0
- DSCR +5.5/10.0
- 1% rule +4.7/10.0
- Livability +3.5/5.0
- Schools +3.2/10.0
- Rent growth +2.5/5.0
- Condition / age +2.2/5.0
- Appreciation +0.0/10.0
$125,000
🖨 Deal sheet 📄 Offer letter ✓ Due diligence
Listing remarks MLS
Sitting a moment away from Lake Superior in the idyllic town of Munising, this 3 bedroom, 2 bathroom home offers a flexible layout with spacious living areas and recent updates throughout. The main floor features a large living room, updated kitchen with refreshed cabinetry, first floor bedroom, renovated bathroom, and convenient first floor laundry that could potentially be converted back into an additional bedroom or office space. Upstairs you'll find two bedrooms, a full bathroom, and an additional living area offering extra space to spread out. Enjoy the enclosed front porch, shared parking area in the back, and additional storage with the shed. The home is equipped with forced air furnace and electric water heater. Seller is also offering the neighboring duplex at 113 Chestnut at $125,000.
Key facts
- Renovated bathroom
- Flexible layout
- First floor laundry
Tags
Property features AI
Finance
- Other: Pets allowed; Zoned residential; Approximately 0.18 acres (33 ft frontage); Listed as an investment property
Exterior
- Utilities: Public water; Public sanitary sewer; Electricity connected; Natural gas connected; Gas water heater; Natural gas heating fuel
- Home design: Two-story residential investment property; Built in 1900; Basement entry/Below-grade space (finished area not listed)
- Construction: Vinyl exterior; Basement foundation
- Exterior features: Vinyl siding; Deck; Porch; Sidewalks; Shed; Road frontage
Interior
- Kitchen: Range/Oven; Dishwasher
- Bedrooms: Main-level bedroom (12 x 11); Second-level bedroom (12 x 11); Second-level bedroom (approx. 15' wide)
- Bathrooms: Two full bathrooms; First-floor full bathroom (approx. 11 x 6); Second-floor bathroom (approx. 6 x 6)
- Heating & cooling: Forced air heating; Space heater supplemental heat; No central air conditioning
- Interior features: Cable/Internet available; Full basement
- Laundry & utility: Washer and dryer included; First-floor laundry
Neighborhood map
What this means for you Summary
Snapshot
- This is a 3-bed/2.0-bath single-family listed at $125k. Condition is rated fair.
Deal economics
- At list price, monthly cash flow is $96 ($1k/yr) — positive.
- The deal already cash-flows at list — no discount required.
- To meet the 1% rule (rent ≥ 1% of price), the offer needs to be $122k (2.8% below list).
- Recommended offer: $122k (2.8% below list) — sets the bar for 1% rule.
- Cap rate 7.2% vs local median 2.6% in Munising — top-decile yield for the area; either an underpriced asset or a hidden risk that comps aren't pricing in. Stress-test before assuming the spread holds.
Location & tenants
- Location reads 69/100 on livability (#338 in MI) — a middle-class / working-renter tenant base. Strengths: cost of living A+, housing A+, health & safety A+; Watch: schools F, amenities F, commute F.
- Munising Public Schools (town): math 28% / reading 49% proficiency, ranked #241 of 540 in MI (top 45%) — families likely to look elsewhere, expect single-tenant / working-renter base with shorter leases.
- Market conditions: 57 active listings in the ZIP; 33 units permitted in Alger County in 2024 (0 in 5+ unit buildings).
Forward outlook
- Local home prices are declining (-3.0%/yr); year-one equity from $864 of loan paydown is wiped out by about $4k of value loss. Plan a longer hold.
- Alger County population projected at -22% by 2050 — secular population decline; favor cash flow + early exit over multi-decade hold.
Negotiation context
- Only 13 days on market — expect competitive offers; lowballing is unlikely to land.
- 10 sale attempts since 13y ago with the ask held roughly flat each time — persistent listings suggest the price (not the market) is what's stuck; bring a comps-based counter.
- Current owner paid $80k; list at $125k implies a 56% gain — meaningful room to come down on a strong offer.
Risks & watch-outs
- Watch-outs: built in 1900 — expect roof / HVAC / electrical / plumbing capex.
- Climate carrying-cost: moderate flood risk — expect insurance premiums to compound above CPI over the hold.
Questions for the listing agent
- Have any recent inspections been done? Can we get a copy of the seller's disclosures and any deferred-maintenance estimates?
- Built in 1900 — when were the roof, HVAC, electrical panel, plumbing, and water heater last replaced?
- Is there a deadline driving the sale (1031 exchange, divorce, estate, relocation)? That informs how much negotiation room exists.
- Schools are F-rated, which usually means shorter tenancies and higher turnover. Who's the typical renter profile here, and what's been the actual vacancy rate?
- What's the average days-on-market for RENTAL listings here right now (not sales)? A rising rental-DOM trend means longer vacancies and softer asking-rent achievability than the comps imply.
- What's the recent tenant-quality profile in this submarket — average credit score on applications, eviction rate, late-payment / NSF rate, and stable-employment percentage? A property-management company in the area should have these aggregated.
- How much new for-sale + rental construction is in the pipeline within 1–3 miles? Heavy new supply typically softens prices + rents 12–24 months out; constrained supply supports both.
Investment metrics
- 1% rule
- 0.97% ✗
- Cap rate
- 7.22%
- Cash-on-cash
- 3.30%
- DSCR
- 1.15
- GRM
- 8.6
CMA / ARV
- ARV (median comp)
- $158,711
- List price
- $125,000
- Delta
- -11.85%
- Verdict
- UNDERPRICED
- Comps
- 20 within 1.0 mi
Show comp detail 12 sales within ~0.75 mi
| Address | Dist | Beds/Ba | Sqft | Sold | Price | $/sf | Match |
|---|---|---|---|---|---|---|---|
| 213 Oak St | 0.15mi | 4/2.0 (+1) | 1,439 (-2%) | 11mo | $154,900 | $108 | 74 |
| 304 Chestnut St | 0.12mi | 3/1.0 | 1,517 (+3%) | 15mo | $109,000 | $72 | 73 |
| 608 W Onota St | 0.13mi | 3/2.0 | 1,598 (+8%) | 10mo | $160,000 | $100 | 72 |
| 116 W Varnum St | 0.40mi | 3/2.0 | 1,389 (-6%) | 1mo | $160,000 | $115 | 71 |
| 214 Hickory St | 0.26mi | 3/2.0 | 1,600 (+8%) | 8mo | $171,000 | $107 | 67 |
| 322 W Superior St | 0.06mi | 4/1.0 (+1) | 1,661 (+13%) | 1mo | $160,000 | $96 | 66 |
| 223 Lynn St | 0.26mi | 3/1.5 | 1,601 (+9%) | 11mo | $210,000 | $131 | 62 |
| 331 E Varnum St | 0.67mi | 3/2.5 | 1,438 (-2%) | 2mo | $219,000 | $152 | 61 |
| 206 Cherry St | 0.06mi | 2/1.5 (-1) | 1,290 (-12%) | 10mo | $135,000 | $105 | 61 |
| 409 W Onota St | 0.12mi | 3/1.0 | 1,272 (-14%) | 9mo | $186,000 | $146 | 60 |
| 112 Pine St | 0.33mi | 3/2.0 | 1,581 (+7%) | 16mo | $183,900 | $116 | 59 |
| 301 E Chocolay St | 0.55mi | 4/2.0 (+1) | 1,611 (+9%) | 7mo | $145,000 | $90 | 48 |
Match score weights: distance 35% · size 25% · config 20% · recency 20%. Top-matched comps best support the ARV.
Projected returns pro-forma
-3.0% appreciation · 3.0% rent growth · sell at horizon
- IRR
- -11.1%
- Equity multiple
- 0.60×
- Total profit
- $-14,116
- Equity at exit
- $18,638
- IRR
- -1.8%
- Equity multiple
- 0.88×
- Total profit
- $-4,336
- Equity at exit
- $10,808
Cash invested: $35,000 (down + closing). Projections, not guarantees.
Landlord ↔ Tenant lean methodology
- Overall (STATE)
- 62 Landlord-Friendly
- State Michigan
- 62 Landlord-Friendly · EVEN
- County
- — inherits STATE
- City
- — inherits STATE
ZIP-level market 49862
- Active inventory
- 57
- Price-to-rent
- 8.6×
Monthly cashflow live
- Estimated rent
- $1,215 medium interval (Pro) →
- Mortgage (P&I)
- −$656
- Tax est. 1.5%
- −$156 /mo · $1,875/yr
- Insurance
- −$52
- HOA
- −$0
- Vacancy / Maint / Mgmt
- −$255
- Net cashflow
- $96
Break-even live
UW: 25.0% down · 7.5% · 30yr · 1.5% tax · 5.0% vac · 8.0% maint · 8.0% mgmt
Financing live
Cash to close
- Down payment
- $31,250
- Closing costs
- $3,750
- Reserves months
- —
- Total cash needed
- —
Loan-product check · same deal, 3 products live
Conventional
25% down · 7.5% · 30yr
- Down + closing
- —
- Monthly P&I
- —
- Monthly cashflow
- —
- DSCR
- —
- Eligible?
- —
Personal DTI + credit; lowest rate.
DSCR
20% down · 8.5% · 30yr
- Down + closing
- —
- Monthly P&I
- —
- Monthly cashflow
- —
- DSCR
- —
- Eligible?
- —
No personal income docs; deal must DSCR.
Hard money
10% down · 12.0% · 12mo
- Down + closing
- —
- Monthly P&I
- —
- Monthly cashflow
- —
- DSCR
- —
- Eligible?
- —
Short-term bridge; refi at stabilization.
Listing history 30 events
-
2026-06-12status $125,000 Pending 13 DOM
-
2026-06-09days on market $125,000 Active 13 DOM
Show marketing remark (806 chars)
Sitting a moment away from Lake Superior in the idyllic town of Munising, this 3 bedroom, 2 bathroom home offers a flexible layout with spacious living areas and recent updates throughout. The main floor features a large living room, updated kitchen with refreshed cabinetry, first floor bedroom, renovated bathroom, and convenient first floor laundry that could potentially be converted back into an additional bedroom or office space. Upstairs you'll find two bedrooms, a full bathroom, and an additional living area offering extra space to spread out. Enjoy the enclosed front porch, shared parking area in the back, and additional storage with the shed. The home is equipped with forced air furnace and electric water heater. Seller is also offering the neighboring duplex at 113 Chestnut at $125,000.
-
2026-06-08days on market $125,000 Active 12 DOM
-
2026-06-07days on market $125,000 Active 11 DOM
-
2026-06-05days on market $125,000 Active 9 DOM
-
2026-06-04days on market $125,000 Active 7 DOM
-
2026-06-02days on market $125,000 Active 6 DOM
-
2026-06-01days on market $125,000 Active 5 DOM
-
2026-05-31days on market $125,000 Active 4 DOM
-
2026-05-31days on market $125,000 Active 3 DOM
-
2026-05-13historical
-
2026-04-24$139,900 Active
-
2025-09-02historical
-
2025-08-27price $136,000
-
2025-08-26price $136,000
-
2025-04-07price $146,000
-
2025-04-07price $146,000
-
2025-03-07$151,000 Active
-
2022-07-01soldstatus $80,000
-
2022-07-01soldstatus $80,000
-
2022-01-28$89,500
-
2022-01-28$89,500
-
2020-02-25$48,000
-
2020-02-25soldstatus $40,000
-
2020-02-25soldstatus $40,000
-
2020-02-25$48,000
-
2016-10-01historical
-
2015-01-02$49,000
-
2014-03-29historical
-
2013-03-28$59,900
ⓘ Source: listings_history table (triggers on properties + properties_extension) + one-shot
backfill from property_details.listing_events for pre-trigger history.
Climate risk First Street
- Flood 5/10 Major 67% chance over 30 yrs
- Wildfire 3/10 Moderate
- Heat 1/10 Low 7 d/yr ≥90°F today · 13 d/yr by 30 yrs out
- Wind 1/10 Low
- Air quality 1/10 Low 0 unhealthy d/yr today · 0 by 30 yrs out
Nearby sold comps map
Loading sold comps map…
Walkable amenities ~0.75 mi
Loading nearby amenities…
Taxation est. · year 1
- Rental income
- $14,582
- − Mortgage interest
- −$7,002
- − Property taxes
- −$1,875
- − Insurance
- −$625
- − Repairs & maintenance
- −$1,167
- − Management
- −$1,167
- − Depreciation
- −$3,636
- Taxable loss
- −$890
- Est. tax savings @ 24.0%
- +$214
- After-tax cash flow
- $1,367/yr
For passive investors: Depreciation is non-cash, so a rental often shows a tax loss while cash-flowing — sheltering income. Rental losses are passive: they offset passive income freely, and up to $25,000/yr can offset ordinary (W-2) income if you actively participate and your MAGI is under $100k (phasing out to $0 by $150k); unused losses carry forward. On sale, claimed depreciation is recaptured at up to 25%, and gains may owe capital-gains tax (a 1031 exchange can defer both). Figures are a year-1 estimate at your 24.0% rate — not tax advice; consult a CPA.
Condition & rehab AI · 13 photos
This home requires moderate renovations to improve its condition and increase its value. Key areas for improvement include the exterior siding, kitchen cabinets, and bathroom fixtures.
Repairs flagged
- Major Exterior siding — The siding is visibly worn and in poor condition.
- Minor Kitchen cabinets — The cabinets appear dated but not structurally damaged.
- Minor Bathroom fixtures — The fixtures seem functional but may need updating.
Value-add opportunities
- Resale Paint interior walls — Fresh paint can make a significant difference in the home's appearance and value.
- Rental Replace carpet flooring — New flooring can improve the home's rental appeal and reduce maintenance costs.
- Resale Update kitchen cabinets — Modernizing the kitchen can significantly increase the home's resale value.
- Resale Update bathroom fixtures — Upgrading the bathrooms can enhance the home's overall appeal and value.
Renovation cost estimate screening
| Repair item | Severity | Est. cost |
|---|---|---|
| Exterior siding · The siding is visibly worn and in poor condition. | Major | $15,000–50,000 |
| Kitchen cabinets · The cabinets appear dated but not structurally damaged. | Minor | $500–3,000 |
| Bathroom fixtures · The fixtures seem functional but may need updating. | Minor | $500–3,000 |
| Total estimated repair cost · 3 items | $16,000–56,000 |
Value-add ROI direction
- Resale Paint interior walls — Fresh paint can make a significant difference in the home's appearance and value. ↑
- Rental Replace carpet flooring — New flooring can improve the home's rental appeal and reduce maintenance costs. ↑
- Resale Update kitchen cabinets — Modernizing the kitchen can significantly increase the home's resale value. ↑
- Resale Update bathroom fixtures — Upgrading the bathrooms can enhance the home's overall appeal and value. ↑
ⓘ Cost ranges are severity-bucket heuristics (US national rule-of-thumb). Get contractor quotes + a written scope before underwriting a rehab budget.
Schools (NCES district)
- District
- Munising Public Schools
- NCES district ID
- 2624810
- Math proficiency
- 28% ▼ -1.00%
- Reading proficiency
- 49% ▲ 10.00%
- Median HH income
- $39,446
- Composite
- 32.16/100
- National rank
- #5790
- State rank
- #241 of 540 in MI
Livability — Munising
- Score
- 69/100
- State rank
- #338
- US rank
- #8357
Category grades
Schools grade is shown separately in the Schools card above.
Census & demographics
- Census place
- Munising, MI
- Population (ZIP)
- 4,532
Population outlook (Alger County) Hauer SSP2
- Today (2025)
- 8,895 people
- By 2030
- 8,541 · -4.0%
- By 2040
- 7,706 · -13.4%
- By 2050
- 6,904 · -22.4%
- By 2075
- 5,760 · -35.2%
- By 2100
- 4,414 · -50.4%
Race, ethnicity, and origin ACS 2023
- Neighborhood character
- Predominantly White (75%)
- Race & ethnicity
- White 75% Black 15% Two or more races 6% Native American 3% Hispanic / Latino 1%
- Common ancestry
- Lithuanian 9% Romanian 7% Iranian 2%
- Foreign-born
- 1% · Canada
- Languages at home
- 98% English-only · German/W. Germanic 1%
Political lean MEDSL · Alger
- 2024 margin
- R (+19.8) · D 39.5% · R 59.3% · Other 1.3%
- 2008→2024 swing
- -25.8pp toward R · 2008: 6.0pp · 2024: -19.8pp
- All cycles
- 2024: R+19.8 2020: R+18.7 2016: R+20.4 2012: R+2.5 2008: D+6.0
Not yet ingested
- Civics
- —
Market trends
- HPI YoY
- ▼ -116.87%
- Current HPI
- 153.6932
- Rent YoY
- —
- Metro
- —
- State GDP YoY
- ▲ 1.37%
- F500 in state
- 28
Industry mix (Fortune 500 HQ in MI)
| Industry | F500 HQs | Revenue |
|---|---|---|
| Automotive Parts | 3 | $48B |
|
||
| Automotive | 2 | $372B |
|
||
| Chemicals | 1 | $45B |
|
||
| Automotive Retail | 1 | $29B |
|
||
| Healthcare / Medical Devices | 1 | $23B |
|
||
| Automotive Technology | 1 | $20B |
|
||
Price history
+108.7% since first listed24 events — show timeline
- 2026-06-09 Pending — UPAR
- 2026-06-09 Pending — MiRealSource-MiMLS
- 2026-05-27 Listed $125,000 UPAR
- 2026-05-26 Listed $125,000 MiRealSource-MiMLS
- 2026-05-13 Listing Removed — MiRealSource-MiMLS
- 2026-04-24 Listed $139,900 MiRealSource-MiMLS
- 2025-09-02 Listing Removed — MiRealSource-MiMLS
- 2025-08-27 Price Changed $136,000 MiRealSource-MiMLS
- 2025-08-26 Price Changed $136,000 UPAR
- 2025-04-07 Price Changed $146,000 MiRealSource-MiMLS
- 2025-04-07 Price Changed $146,000 UPAR
- 2025-03-07 Listed $151,000 MiRealSource-MiMLS
- 2022-07-01 Sold (MLS) $80,000 MiRealSource-MiMLS
- 2022-07-01 Sold (MLS) $80,000 UPAR
- 2022-01-28 Listed $89,500 MiRealSource-MiMLS
- 2022-01-28 Listed $89,500 UPAR
- 2020-02-25 Listed $48,000 UPAR
- 2020-02-25 Listed $48,000 MiRealSource-MiMLS
- 2020-02-25 Sold (MLS) $40,000 UPAR
- 2020-02-25 Sold (MLS) $40,000 MiRealSource-MiMLS
- 2016-10-01 Listing Removed — MiRealSource-MiMLS
- 2015-01-02 Listed $49,000 MiRealSource-MiMLS
- 2014-03-29 Listing Removed — MiRealSource-MiMLS
- 2013-03-28 Listed $59,900 MiRealSource-MiMLS
Cash-flow waterfall
monthlySold comps — $/sqft
last 12 mo · ≤1 miLoading sold comps…