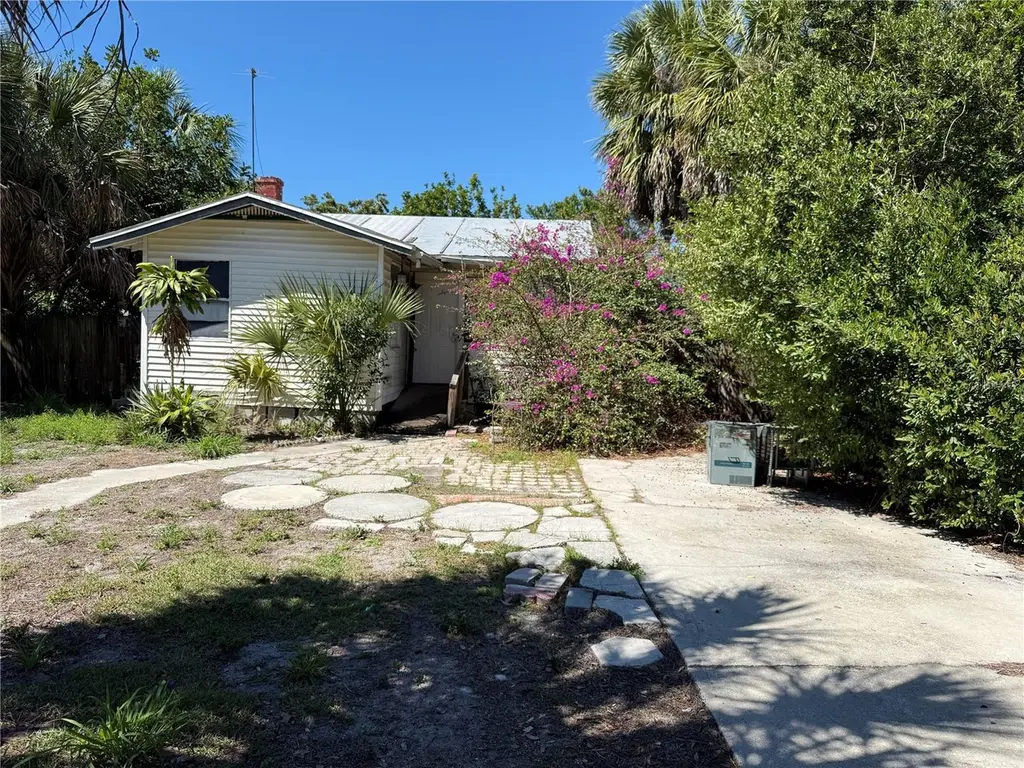
2007 43rd St S · St. Petersburg, FL
Flood risk 1/10 · Minimal
- FEMA flood zone
- X (unshaded)
- Chance of flooding over 30 yrs
- 0.0%
- Est. flood insurance / yr
- $507 – $1,088
Fire risk 1/10 · Minimal
- Est. fire insurance / yr
- $947 – $1,759
Heat risk 10/10 · Severe
- Hot days now (above 106°F)
- 7 days/yr
- Hot days in 30 yrs
- 26 days/yr
Wind risk 10/10 · Severe
- Chance of severe wind over 30 yrs
- 99.0%
Air-quality risk 3/10 · Minor
- Unhealthy air days now
- 3 days/yr
- Unhealthy air days in 30 yrs
- 3 days/yr
Risk factors via First Street. Map © Google.
Why this score? — see what drove the C- grade
The composite is a weighted blend of 9 inputs, each scored 0–100. Each bar is that input's sub-score; the figure is the points it added to the 100-point composite (weight × sub-score).
- Cash flow +20.3/30.0
- ARV discount +7.5/15.0
- DSCR +6.5/10.0
- 1% rule +4.6/10.0
- Schools +4.3/10.0
- Livability +2.5/5.0
- Condition / age +2.5/5.0
- Rent growth +2.1/5.0
- Appreciation +0.0/10.0
$179,000
🖨 Deal sheet 📄 Offer letter ✓ Due diligence
Listing remarks MLS
All Info. believed to be correct-buyer to confirm all details important to buying decision- property sold as is with right to inspect. No utilities to be on for inspection.
Key facts
- 6,251 sq ft lot
- Built 1926
- Listed 92 days
Property features AI
Finance
- Other: Unfurnished; No lease restrictions indicated
Exterior
- Utilities: Public water; Public sewer; Electricity connected; Water connected; Sewer connected
- Home design: Single family residence; Residential property; One story; Faces West; Entry on one level
- Construction: Frame construction; Metal and shingle roof; Crawlspace foundation; Built on a 0.14 acre lot
- Exterior features: Awning(s); Sidewalk
Interior
- Kitchen: Range; Refrigerator
- Bedrooms: 2 bedrooms
- Flooring: Wood floors
- Bathrooms: 1 full bathroom
- Heating & cooling: Electric heating; Wall/Window air conditioning units
- Interior features: Open floorplan; 5 total rooms
- Laundry & utility: Washer hookup; Electric dryer hookup; Laundry room inside the home
Neighborhood map
What this means for you Summary
Snapshot
- This is a 2-bed/1.0-bath single-family listed at $179k.
Deal economics
- At list price, monthly cash flow is $230 ($3k/yr) — positive.
- The deal already cash-flows at list — no discount required.
- To meet the 1% rule (rent ≥ 1% of price), the offer needs to be $172k (3.9% below list).
- Recommended offer: $163k (9.0% below list) — sets the bar for market timing.
- Cap rate 7.8% vs local median 2.6% in St. Petersburg — top-decile yield for the area; either an underpriced asset or a hidden risk that comps aren't pricing in. Stress-test before assuming the spread holds.
Location & tenants
- Location reads: area grade C — affects rentability + tenant quality, not the cash-flow math above.
- Pinellas (suburban): math 51% / reading 51% proficiency, ranked #31 of 73 in FL (top 42%) — acceptable for families but not a draw, mixed tenant base, ~2y average lease.
- Market conditions: Rents soft (-1.5%/yr); 261 active listings in the ZIP; 30 comparable units currently listed for rent nearby; rentals at typical pace (median 15d on market — plan ~3-4 weeks tenant-placement turnaround); 2,676 units permitted in Pinellas County in 2024 (1,422 in 5+ unit buildings).
- This rent runs 31% of the median local income ($67k/yr) — at the standard rent-burdened threshold; future hikes will face affordability resistance.
Forward outlook
- Local home prices are declining (-3.0%/yr); year-one equity from $1k of loan paydown is wiped out by about $5k of value loss. Plan a longer hold.
- Pinellas County population projected at +14% by 2050 — modest demand growth; plan on rents tracking national, not racing it.
Negotiation context
- It's been on market 92 days — a 9% lower offer ($163k) is reasonable based on typical stale-listing flexibility.
- 3 sale attempts since 22y ago; this cycle's ask has dropped $56k (24%) from the opening price — seller is motivated, your offer sets the floor, not the list.
- Current owner paid $28k; list at $179k implies a 551% gain — meaningful room to come down on a strong offer.
Risks & watch-outs
- Watch-outs: built in 1926 — expect roof / HVAC / electrical / plumbing capex.
- Climate carrying-cost: severe wind risk, 99% chance of damaging wind over 30y; extreme-heat days projected 7→26/yr by 2055 (HVAC capex compounding) — expect insurance premiums to compound above CPI over the hold.
Questions for the listing agent
- It's been on market 92 days. Have you received any prior offers? Is the seller open to a 9% concession, seller financing, or rate buy-down credit?
- Built in 1926 — when were the roof, HVAC, electrical panel, plumbing, and water heater last replaced?
- Why hasn't it sold? Are there any deal-killer items the seller is aware of (foundation, flood, title, zoning, code violations)?
- Is there a deadline driving the sale (1031 exchange, divorce, estate, relocation)? That informs how much negotiation room exists.
- What's the average days-on-market for RENTAL listings here right now (not sales)? A rising rental-DOM trend means longer vacancies and softer asking-rent achievability than the comps imply.
- What's the recent tenant-quality profile in this submarket — average credit score on applications, eviction rate, late-payment / NSF rate, and stable-employment percentage? A property-management company in the area should have these aggregated.
- How much new for-sale + rental construction is in the pipeline within 1–3 miles? Heavy new supply typically softens prices + rents 12–24 months out; constrained supply supports both.
Investment metrics
- 1% rule
- 0.96% ✗
- Cap rate
- 7.84%
- Cash-on-cash
- 5.52%
- DSCR
- 1.25
- GRM
- 8.7
CMA / ARV
- ARV (on-the-fly)
- $118,800
- Comps found
- 4
Show comp detail 4 sales within ~0.75 mi
| Address | Dist | Beds/Ba | Sqft | Sold | Price | $/sf | Match |
|---|---|---|---|---|---|---|---|
| 1734 Newark St S | 0.30mi | 1/1.0 (-1) | 579 (+10%) | 2mo | $130,000 | $225 | 63 |
| 4119 12th Ave S | 0.60mi | 1/1.0 (-1) | 500 (-5%) | 14mo | $140,000 | $280 | 47 |
| 3734 27th Ave S | 0.61mi | 1/1.0 (-1) | 576 (+9%) | 6mo | $113,190 | $197 | 46 |
| 4512 10th Ave S | 0.71mi | 1/1.0 (-1) | 576 (+9%) | 9mo | $125,000 | $217 | 39 |
Match score weights: distance 35% · size 25% · config 20% · recency 20%. Top-matched comps best support the ARV.
Projected returns pro-forma
-3.0% appreciation · 0.0% rent growth · sell at horizon
- IRR
- -11.0%
- Equity multiple
- 0.61×
- Total profit
- $-19,408
- Equity at exit
- $26,689
- IRR
- -6.3%
- Equity multiple
- 0.65×
- Total profit
- $-17,643
- Equity at exit
- $15,477
Cash invested: $50,120 (down + closing). Projections, not guarantees.
Landlord ↔ Tenant lean methodology
- Overall (STATE)
- 87 Strongly Landlord-Friendly
- State Florida
- 87 Strongly Landlord-Friendly · R+3
- County
- — inherits STATE
- City
- — inherits STATE
ZIP-level market 33711
- Rents YoY
- -1.5%
- Active inventory
- 261
- Price-to-rent
- 8.7×
Monthly cashflow live
- Estimated rent
- $1,720 high interval (Pro) →
- Mortgage (P&I)
- −$939
- Tax from tax record
- −$115 /mo · $1,379/yr
- Insurance
- −$75
- HOA
- −$0
- Vacancy / Maint / Mgmt
- −$361
- Net cashflow
- $230
Break-even live
UW: 25.0% down · 7.5% · 30yr · 1.5% tax · 5.0% vac · 8.0% maint · 8.0% mgmt
Financing live
Cash to close
- Down payment
- $44,750
- Closing costs
- $5,370
- Reserves months
- —
- Total cash needed
- —
Loan-product check · same deal, 3 products live
Conventional
25% down · 7.5% · 30yr
- Down + closing
- —
- Monthly P&I
- —
- Monthly cashflow
- —
- DSCR
- —
- Eligible?
- —
Personal DTI + credit; lowest rate.
DSCR
20% down · 8.5% · 30yr
- Down + closing
- —
- Monthly P&I
- —
- Monthly cashflow
- —
- DSCR
- —
- Eligible?
- —
No personal income docs; deal must DSCR.
Hard money
10% down · 12.0% · 12mo
- Down + closing
- —
- Monthly P&I
- —
- Monthly cashflow
- —
- DSCR
- —
- Eligible?
- —
Short-term bridge; refi at stabilization.
Rent comps 30 comps
| Address | Beds | Baths | Sqft | Rent | $/sqft | DOM | Units | Dist |
|---|---|---|---|---|---|---|---|---|
| 1727 45th St S Unit B St. Petersburg, FL | 1.0 | 1.0 | 600 | $1,150 | $1.92 | 8d | 1 | 0.31mi |
| 3774 Abington Ave S Unit A St. Petersburg, FL | 2.0 | 1.0 | 710 | $1,400 | $1.97 | 12d | 1 | 0.61mi |
| 4619 13th Ave S Unit 2 St. Petersburg, FL | 1.0 | 1.0 | 450 | $1,095 | $2.43 | 8d | 1 | 0.61mi |
| 4619 13th Ave S Saint Petersburg, FL | 1.0 | 1.0 | 450 | $1,095 | $2.43 | 4d | 1 | 0.61mi |
| 1147 40th St S St. Petersburg, FL | 1.0 | 1.0 | 440 | $1,100 | $2.50 | 24d | 1 | 0.61mi |
| 4545 12th Ave S Saint Petersburg, FL | 2.0 | 1.0 | 660 | $2,000 | $3.03 | 4d | 1 | 0.64mi |
| 3936 9th Ave S Saint Petersburg, FL | 2.0 | 1.0 | 696 | $1,895 | $2.72 | 8d | 1 | 0.78mi |
| 2524 52nd St S Unit 2 Gulfport, FL | 1.0 | 1.0 | 575 | $1,595 | $2.77 | 18d | 1 | 0.84mi |
| 1720 53rd St S Gulfport, FL | 1.0 | 1.0 | 728 | $1,800 | $2.47 | 4d | 1 | 0.88mi |
| 1720 53rd St S Unit 1720 Gulfport, FL | 1.0 | 1.0 | 723 | $1,800 | $2.49 | 18d | 1 | 0.88mi |
| 5219 17th Ave S Unit 5219 Gulfport, FL | 1.0 | 1.0 | 600 | $1,400 | $2.33 | 22d | 1 | 0.88mi |
| 3017 49th St S Gulfport, FL | 1.0 | 1.0 | 600 | $1,350 | $2.25 | 24d | 1 | 0.89mi |
| 3017 49th St S Gulfport, FL | 2.0 | 1.0 | 632 | $1,650 | $2.61 | 2d | 1 | 0.89mi |
| 3017 49th St S Unit 12 Gulfport, FL | 2.0 | 1.0 | 750 | $1,600 | $2.13 | 2d | 1 | 0.89mi |
| 3357 38th St S Unit C Saint Petersburg, FL | 1.0 | 1.0 | 735 | $1,795 | $2.44 | 24d | 1 | 0.93mi |
| 1901 31st St S Unit 1/2 St. Petersburg, FL | 2.0 | 1.0 | 721 | $1,950 | $2.70 | 3d | 1 | 0.95mi |
| 3301 32nd Ave S Saint Petersburg, FL | 1.0–2.0 | 1.0–2.0 | 914 | $2,750 | $3.01 | 3d | 10 | 1.06mi |
| 5608 18th Ave S Gulfport, FL | 1.0 | 1.0 | 560 | $1,600 | $2.86 | 24d | 1 | 1.16mi |
| 5420 29th Ave S Unit B Gulfport, FL | 1.0 | 1.0 | 500 | $1,550 | $3.10 | 8d | 1 | 1.17mi |
| 1806 57th St S Fl 33714 Gulfport, FL | 1.0 | 1.0 | 550 | $1,500 | $2.73 | 24d | 1 | 1.20mi |
| 3022 Beach Blvd S Unit 1 Gulfport, FL | 1.0 | 1.0 | 459 | $2,000 | $4.36 | 10d | 1 | 1.24mi |
| 5011 Emerson Ave S Saint Petersburg, FL | 1.0 | 1.0 | 600 | $1,450 | $2.42 | 24d | 1 | 1.26mi |
| 3015 56th St S Unit 4 Gulfport, FL | 1.0 | 1.0 | 550 | $1,645 | $2.99 | 4d | 1 | 1.30mi |
| 3460 4th Ave S Unit 1 St. Petersburg, FL | 1.0 | 1.0 | 544 | $1,550 | $2.85 | 24d | 1 | 1.34mi |
| 3460 4th Ave S Unit 3 St. Petersburg, FL | 2.0 | 1.0 | 544 | $1,800 | $3.31 | 24d | 1 | 1.34mi |
| 2601 18th Ave S Unit B St. Petersburg, FL | 1.0 | 1.0 | 600 | $1,100 | $1.83 | 24d | 1 | 1.34mi |
| 2931 Dupont St S Unit Dupont St S unit P041 Madrid 4 Gulfport, FL | 1.0 | 1.0 | 690 | $1,490 | $2.16 | 15d | 1 | 1.41mi |
| 3120 57th St S Unit B Gulfport, FL | 1.0 | 1.0 | 400 | $1,750 | $4.38 | 24d | 1 | 1.42mi |
| 3550 2nd Ave S St. Petersburg, FL | 2.0 | 1.0 | 720 | $2,800 | $3.89 | 24d | 1 | 1.42mi |
| 2547 14th Ave S Saint Petersburg, FL | 2.0 | 1.0 | 726 | $2,800 | $3.86 | 4d | 1 | 1.49mi |
Listing history 20 events
-
2026-06-18days on market $179,000 Active 92 DOM
-
2026-06-17days on market $179,000 Active 91 DOM
-
2026-06-16days on market $179,000 Active 90 DOM
-
2026-06-15days on market $179,000 Active 89 DOM
-
2026-06-13days on market $179,000 Active 87 DOM
-
2026-06-09days on market $179,000 Active 83 DOM
-
2026-06-08days on market $179,000 Active 82 DOM
-
2026-06-07days on market $179,000 Active 81 DOM
-
2026-06-04days on market $179,000 Active 78 DOM
-
2026-06-03days on market $179,000 Active 77 DOM
-
2026-06-01days on market $179,000 Active 75 DOM
-
2026-05-31days on market $179,000 Active 74 DOM
-
2026-05-21price $179,000
-
2026-05-16price $189,000
-
2026-03-26price $198,000
-
2026-03-18$235,000 Active
-
2005-03-23soldstatus $27,500 172-char remark
Show marketing remark (172 chars)
All Info. believed to be correct-buyer to confirm all details important to buying decision- property sold as is with right to inspect. No utilities to be on for inspection.
-
2005-02-16$35,500 172-char remark
Show marketing remark (172 chars)
All Info. believed to be correct-buyer to confirm all details important to buying decision- property sold as is with right to inspect. No utilities to be on for inspection.
-
2004-12-24$52,000
-
1996-03-20soldstatus $18,000
ⓘ Source: listings_history table (triggers on properties + properties_extension) + one-shot
backfill from property_details.listing_events for pre-trigger history.
Tax reassessment forecast FL · Resets to sale price
- Current annual tax
- $1,379 · $115/mo
- Projected year-2 tax
- $1,486 · $124/mo
- Expected delta
- +$106/yr (+$9/mo · 7.7%)
ⓘ Screening estimate from a state-policy table — verify with the county assessor before closing.
Climate risk First Street
- Flood 1/10 Low FEMA zone X (unshaded) · 0% chance over 30 yrs
- Wildfire 1/10 Low
- Heat 10/10 Extreme 7 d/yr ≥106°F today · 26 d/yr by 30 yrs out
- Wind 10/10 Extreme 99% chance of damaging wind over 30 yrs
- Air quality 3/10 Moderate 3 unhealthy d/yr today · 3 by 30 yrs out
Nearby sold comps map
Loading sold comps map…
Walkable amenities ~0.75 mi
Loading nearby amenities…
Taxation est. · year 1
- Rental income
- $20,639
- − Mortgage interest
- −$10,027
- − Property taxes
- −$1,379
- − Insurance
- −$895
- − Repairs & maintenance
- −$1,651
- − Management
- −$1,651
- − Depreciation
- −$5,207
- Taxable loss
- −$172
- Est. tax savings @ 24.0%
- +$41
- After-tax cash flow
- $2,807/yr
For passive investors: Depreciation is non-cash, so a rental often shows a tax loss while cash-flowing — sheltering income. Rental losses are passive: they offset passive income freely, and up to $25,000/yr can offset ordinary (W-2) income if you actively participate and your MAGI is under $100k (phasing out to $0 by $150k); unused losses carry forward. On sale, claimed depreciation is recaptured at up to 25%, and gains may owe capital-gains tax (a 1031 exchange can defer both). Figures are a year-1 estimate at your 24.0% rate — not tax advice; consult a CPA.
Schools (NCES district)
- District
- Pinellas
- NCES district ID
- 1201560
- Math proficiency
- 51% ▼ -5.00%
- Reading proficiency
- 51% ▼ -3.00%
- Median HH income
- $46,270
- Composite
- 43.27/100
- National rank
- #3046
- State rank
- #31 of 73 in FL
Livability — St. Petersburg
No livability data for this city. (Only ~50 U.S. cities are tracked.)
Census & demographics
- Census place
- St. Petersburg, FL
- County
- Pinellas County · 939,478 people
- City population
- 249,151
- Metro
- Tampa-St. Petersburg-Clearwater, FL
- Population (ZIP)
- 20,013
- Household income
- $66,540
- Rent vs Own
- Severe rent burden
- 903.0
Population outlook (Pinellas County) Hauer SSP2
- Today (2025)
- 1,027,532 people
- By 2030
- 1,063,586 · +3.5%
- By 2040
- 1,125,020 · +9.5%
- By 2050
- 1,168,637 · +13.7%
- By 2075
- 1,265,188 · +23.1%
- By 2100
- 1,260,357 · +22.7%
Race, ethnicity, and origin ACS 2023
- Neighborhood character
- Diverse neighborhood (Simpson 0.59)
- Race & ethnicity
- White 45% Black 45% Hispanic / Latino 6% Two or more races 6%
- Hispanic origin (detail)
- Puerto Rican 1%
- Common ancestry
- Romanian 2% Lithuanian 2% Italian 1%
- Foreign-born
- 7% · Canada, Dominican Republic
- Languages at home
- 91% English-only · Spanish 4% French/Haitian/Cajun 3% Other Indo-European 1%
Political lean MEDSL · Pinellas
- 2024 margin
- Lean R (+5.2) · D 46.9% · R 52.1%
- 2008→2024 swing
- -13.5pp toward R · 2008: 8.3pp · 2024: -5.2pp
- All cycles
- 2024: R+5.2 2020: D+0.2 2016: R+1.1 2012: D+5.6 2008: D+8.3
Not yet ingested
- Civics
- —
Market trends
- HPI YoY
- ▼ -313.54%
- Current HPI
- 338.2712
- Rent YoY
- ▼ -1.47%
- Metro
- Tampa-St. Petersburg-Clearwater, FL
- State GDP YoY
- ▲ 3.28%
- F500 in state
- 36
Industry mix (Fortune 500 HQ in FL)
| Industry | F500 HQs | Revenue |
|---|---|---|
| Industrial Technology | 2 | $29B |
|
||
| Insurance | 2 | $17B |
|
||
| Retail | 1 | $60B |
|
||
| Technology Distribution | 1 | $58B |
|
||
| Homebuilding | 1 | $35B |
|
||
| Technology Manufacturing | 1 | $35B |
|
||
Price history
+894.4% since first listed8 events — show timeline
- 2026-05-21 Price Changed $179,000 Stellar MLS as Distributed by MLS Grid
- 2026-05-16 Price Changed $189,000 Stellar MLS as Distributed by MLS Grid
- 2026-03-26 Price Changed $198,000 Stellar MLS as Distributed by MLS Grid
- 2026-03-18 Listed $235,000 Stellar MLS as Distributed by MLS Grid
- 2005-03-23 Sold (MLS) $27,500 Stellar MLS as Distributed by MLS Grid
- 2005-02-16 Listed $35,500 Stellar MLS as Distributed by MLS Grid
- 2004-12-24 Listed $52,000 Stellar MLS as Distributed by MLS Grid
- 1996-03-20 Sold (Public Records) $18,000 Public Records
Property tax history
+10.7%/yrLatest (2025): $1,379 · +15.6% YoY. Source: county tax records.
Cash-flow waterfall
monthlySold comps — $/sqft
last 12 mo · ≤1 miLoading sold comps…