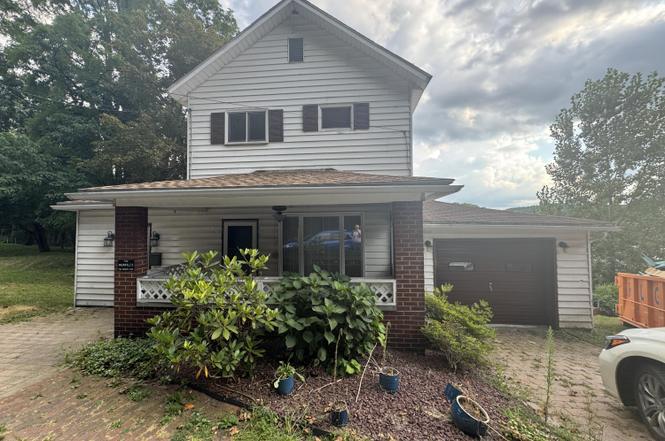
701 Beech Ave · Patton, PA
Flood risk 1/10 · Minimal
- FEMA flood zone
- X (unshaded)
- Chance of flooding over 30 yrs
- 0.0%
- Est. flood insurance / yr
- $473 – $860
Fire risk 1/10 · Minimal
- Est. fire insurance / yr
- $511 – $949
Heat risk 3/10 · Minor
- Hot days now (above 90°F)
- 8 days/yr
- Hot days in 30 yrs
- 19 days/yr
Wind risk 2/10 · Minimal
- Chance of severe wind over 30 yrs
- —
Air-quality risk 2/10 · Minimal
- Unhealthy air days now
- 1 days/yr
- Unhealthy air days in 30 yrs
- 3 days/yr
Risk factors via First Street. Map © Google.
Why this score? — see what drove the B grade
The composite is a weighted blend of 9 inputs, each scored 0–100. Each bar is that input's sub-score; the figure is the points it added to the 100-point composite (weight × sub-score).
- Cash flow +30.0/30.0
- 1% rule +10.0/10.0
- DSCR +10.0/10.0
- ARV discount +7.5/15.0
- Appreciation +4.7/10.0
- Schools +3.8/10.0
- Livability +3.4/5.0
- Rent growth +2.5/5.0
- Condition / age +2.5/5.0
$58,900
🖨 Deal sheet 📄 Offer letter ✓ Due diligence
Listing remarks MLS
2 STORY VINYL SIDED/ HARDWOOD/PLASTER/APPLICANCE INCLUDED/ WHOLE HOUSE WATER FILTER SYSTEM FIRST FLOOR LAUNDRY & CHAIR LIFT INCLUDED IF DESIRED.
Key facts
- Vinyl sided
- Formal dining room
- Modern bath
Tags
Neighborhood map
What this means for you Summary
Snapshot
- This is a 2-bed/1.5-bath single-family listed at $59k.
Deal economics
- At list price, monthly cash flow is $407 ($5k/yr) — positive.
- The deal already cash-flows at list — no discount required.
- Meets the 1% rule at list price ($1k rent vs $59k).
- Recommended offer: $52k (12.0% below list) — sets the bar for market timing.
Location & tenants
- Location reads 67/100 on livability (#977 in PA) — a middle-class / working-renter tenant base. Strengths: crime A+, cost of living A+, housing A+; Watch: amenities F, commute F, health & safety F.
- Cambria Heights SD (rural): math 27% / reading 63% proficiency, ranked #280 of 539 in PA (top 52%) — families likely to look elsewhere, expect single-tenant / working-renter base with shorter leases.
- Market conditions: 12 active listings in the ZIP; 64 units permitted in Cambria County in 2024 (0 in 5+ unit buildings).
Forward outlook
- Local home prices are declining (-0.7%/yr); year-one equity from $407 of loan paydown is wiped out by about $407 of value loss. Plan a longer hold.
- Cambria County population projected at -28% by 2050 — secular population decline; favor cash flow + early exit over multi-decade hold.
- At projected returns (-0.7% appreciation + 3.0% rent growth), your $16k cash investment doubles in ~4 years — after that, you're playing with house money.
Negotiation context
- It's been on market 224 days — a 12% lower offer ($52k) is reasonable based on typical stale-listing flexibility.
- 4 sale attempts since 20y ago; this cycle's ask has dropped $11k (16%) from the opening price — seller is motivated, your offer sets the floor, not the list.
- Current owner paid $34k; list at $59k implies a 71% gain — meaningful room to come down on a strong offer.
Risks & watch-outs
- Watch-outs: built in 1900 — expect roof / HVAC / electrical / plumbing capex.
Questions for the listing agent
- It's been on market 224 days. Have you received any prior offers? Is the seller open to a 12% concession, seller financing, or rate buy-down credit?
- Built in 1900 — when were the roof, HVAC, electrical panel, plumbing, and water heater last replaced?
- Why hasn't it sold? Are there any deal-killer items the seller is aware of (foundation, flood, title, zoning, code violations)?
- Is there a deadline driving the sale (1031 exchange, divorce, estate, relocation)? That informs how much negotiation room exists.
- What's the average days-on-market for RENTAL listings here right now (not sales)? A rising rental-DOM trend means longer vacancies and softer asking-rent achievability than the comps imply.
- What's the recent tenant-quality profile in this submarket — average credit score on applications, eviction rate, late-payment / NSF rate, and stable-employment percentage? A property-management company in the area should have these aggregated.
- How much new for-sale + rental construction is in the pipeline within 1–3 miles? Heavy new supply typically softens prices + rents 12–24 months out; constrained supply supports both.
Investment metrics
- 1% rule
- 1.70% ✓
- Cap rate
- 14.59%
- Cash-on-cash
- 29.64%
- DSCR
- 2.32
- GRM
- 4.9
CMA / ARV
No comps found within radius.
Projected returns pro-forma
-0.69% appreciation · 3.0% rent growth · sell at horizon
- IRR
- 28.8%
- Equity multiple
- 2.35×
- Total profit
- $22,337
- Equity at exit
- $15,094
- IRR
- 33.3%
- Equity multiple
- 4.55×
- Total profit
- $58,524
- Equity at exit
- $16,609
Cash invested: $16,492 (down + closing). Projections, not guarantees.
Landlord ↔ Tenant lean methodology
- Overall (STATE)
- 62 Landlord-Friendly
- State Pennsylvania
- 62 Landlord-Friendly · EVEN
- County
- — inherits STATE
- City
- — inherits STATE
ZIP-level market 16668
- Home prices YoY
- -0.8%
- Active inventory
- 12
- Price-to-rent
- 4.9×
Monthly cashflow live
- Estimated rent
- $1,000 medium interval (Pro) →
- Mortgage (P&I)
- −$309
- Tax from tax record
- −$50 /mo · $595/yr
- Insurance
- −$25
- HOA
- −$0
- Vacancy / Maint / Mgmt
- −$210
- Net cashflow
- $407
Break-even live
UW: 25.0% down · 7.5% · 30yr · 1.5% tax · 5.0% vac · 8.0% maint · 8.0% mgmt
Financing live
Cash to close
- Down payment
- $14,725
- Closing costs
- $1,767
- Reserves months
- —
- Total cash needed
- —
Loan-product check · same deal, 3 products live
Conventional
25% down · 7.5% · 30yr
- Down + closing
- —
- Monthly P&I
- —
- Monthly cashflow
- —
- DSCR
- —
- Eligible?
- —
Personal DTI + credit; lowest rate.
DSCR
20% down · 8.5% · 30yr
- Down + closing
- —
- Monthly P&I
- —
- Monthly cashflow
- —
- DSCR
- —
- Eligible?
- —
No personal income docs; deal must DSCR.
Hard money
10% down · 12.0% · 12mo
- Down + closing
- —
- Monthly P&I
- —
- Monthly cashflow
- —
- DSCR
- —
- Eligible?
- —
Short-term bridge; refi at stabilization.
Listing history 11 events
-
2026-04-07status Pending
-
2026-04-06price $58,900
-
2025-11-03price $62,900
-
2025-10-02price $66,900
-
2025-09-29status Active
-
2025-09-22status Pending
-
2025-08-18$69,900 Active
-
2013-07-29$42,500
-
2006-11-01soldstatus $34,500 151-char remark
Show marketing remark (151 chars)
2 STORY VINYL SIDED/ HARDWOOD/PLASTER/APPLICANCE INCLUDED/ WHOLE HOUSE WATER FILTER SYSTEM FIRST FLOOR LAUNDRY & CHAIR LIFT INCLUDED IF DESIRED.
-
2006-10-26soldstatus $34,500
-
2006-09-06$37,000 151-char remark
Show marketing remark (151 chars)
2 STORY VINYL SIDED/ HARDWOOD/PLASTER/APPLICANCE INCLUDED/ WHOLE HOUSE WATER FILTER SYSTEM FIRST FLOOR LAUNDRY & CHAIR LIFT INCLUDED IF DESIRED.
ⓘ Source: listings_history table (triggers on properties + properties_extension) + one-shot
backfill from property_details.listing_events for pre-trigger history.
Tax reassessment forecast PA · Partial reset (capped growth)
- Current annual tax
- $595 · $50/mo
- Projected year-2 tax
- $763 · $64/mo
- Expected delta
- +$168/yr (+$14/mo · 28.2%)
ⓘ Screening estimate from a state-policy table — verify with the county assessor before closing.
Climate risk First Street
- Flood 1/10 Low FEMA zone X (unshaded) · 0% chance over 30 yrs
- Wildfire 1/10 Low
- Heat 3/10 Moderate 8 d/yr ≥90°F today · 19 d/yr by 30 yrs out
- Wind 2/10 Low
- Air quality 2/10 Low 1 unhealthy d/yr today · 3 by 30 yrs out
Nearby sold comps map
Loading sold comps map…
Walkable amenities ~0.75 mi
Loading nearby amenities…
Taxation est. · year 1
- Rental income
- $12,006
- − Mortgage interest
- −$3,299
- − Property taxes
- −$595
- − Insurance
- −$294
- − Repairs & maintenance
- −$960
- − Management
- −$960
- − Depreciation
- −$1,713
- Taxable income
- $4,183
- Est. tax owed @ 24.0%
- −$1,004
- After-tax cash flow
- $3,885/yr
For passive investors: Depreciation is non-cash, so a rental often shows a tax loss while cash-flowing — sheltering income. Rental losses are passive: they offset passive income freely, and up to $25,000/yr can offset ordinary (W-2) income if you actively participate and your MAGI is under $100k (phasing out to $0 by $150k); unused losses carry forward. On sale, claimed depreciation is recaptured at up to 25%, and gains may owe capital-gains tax (a 1031 exchange can defer both). Figures are a year-1 estimate at your 24.0% rate — not tax advice; consult a CPA.
Schools (NCES district)
- District
- Cambria Heights SD
- NCES district ID
- 4204740
- Math proficiency
- 27% ▼ -15.00%
- Reading proficiency
- 63% ▼ -11.00%
- Median HH income
- $44,855
- Composite
- 38.0/100
- National rank
- #4291
- State rank
- #280 of 539 in PA
Livability — Patton
- Score
- 67/100
- State rank
- #977
- US rank
- #10697
Category grades
Schools grade is shown separately in the Schools card above.
Census & demographics
- Census place
- Patton, PA
- Population (ZIP)
- 3,620
Population outlook (Cambria County) Hauer SSP2
- Today (2025)
- 122,754 people
- By 2030
- 115,827 · -5.6%
- By 2040
- 101,309 · -17.5%
- By 2050
- 88,379 · -28.0%
- By 2075
- 65,237 · -46.9%
- By 2100
- 46,909 · -61.8%
Race, ethnicity, and origin ACS 2023
- Neighborhood character
- Predominantly White (96%)
- Race & ethnicity
- White 96% Two or more races 4% Hispanic / Latino 1%
- Common ancestry
- Romanian 9% Lithuanian 2% Italian 1%
- Foreign-born
- 0%
- Languages at home
- 98% English-only · Other Indo-European 1%
Political lean MEDSL · Cambria
- 2024 margin
- Solid R (+39.7) · D 29.8% · R 69.5%
- 2008→2024 swing
- -40.4pp toward R · 2008: 0.7pp · 2024: -39.7pp
- All cycles
- 2024: R+39.7 2020: R+37.3 2016: R+37.8 2012: R+17.8 2008: D+0.7
Not yet ingested
- Civics
- —
Market trends
- HPI YoY
- ▼ -0.69%
- Current HPI
- 80.4155
- Rent YoY
- —
- Metro
- —
- State GDP YoY
- ▲ 1.68%
- F500 in state
- 34
Industry mix (Fortune 500 HQ in PA)
| Industry | F500 HQs | Revenue |
|---|---|---|
| Healthcare | 2 | $309B |
|
||
| Insurance | 2 | $27B |
|
||
| Telecommunications / Media | 1 | $124B |
|
||
| Industrial Distribution | 1 | $22B |
|
||
| Financial Services | 1 | $20B |
|
||
| Chemicals / Materials | 1 | $18B |
|
||
Price history
+59.2% since first listed11 events — show timeline
- 2026-04-07 Pending — AHARMLS
- 2026-04-06 Price Changed $58,900 AHARMLS
- 2025-11-03 Price Changed $62,900 AHARMLS
- 2025-10-02 Price Changed $66,900 AHARMLS
- 2025-09-29 Relisted — AHARMLS
- 2025-09-22 Pending — AHARMLS
- 2025-08-18 Listed $69,900 AHARMLS
- 2013-07-29 Listed $42,500 AHARMLS
- 2006-11-01 Sold (MLS) $34,500 AHARMLS
- 2006-10-26 Sold (Public Records) $34,500 Public Records
- 2006-09-06 Listed $37,000 AHARMLS
Property tax history
+1.4%/yrLatest (2026): $595 · +3.3% YoY. Source: county tax records.
Cash-flow waterfall
monthlySold comps — $/sqft
last 12 mo · ≤1 miLoading sold comps…