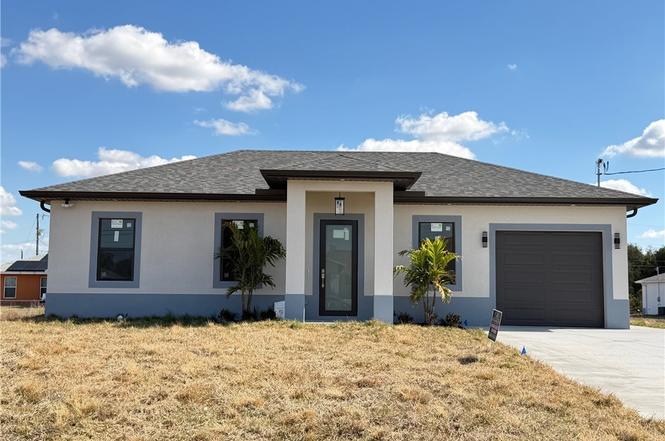
383 Pennfield Ave · Lehigh Acres, FL
Flood risk 6/10 · Moderate
- FEMA flood zone
- X (unshaded)
- Chance of flooding over 30 yrs
- 0.68%
- Est. flood insurance / yr
- $507 – $1,088
Fire risk 4/10 · Minor
- Est. fire insurance / yr
- $947 – $1,759
Heat risk 10/10 · Severe
- Hot days now (above 107°F)
- 7 days/yr
- Hot days in 30 yrs
- 30 days/yr
Wind risk 10/10 · Severe
- Chance of severe wind over 30 yrs
- 99.0%
Air-quality risk 2/10 · Minimal
- Unhealthy air days now
- 1 days/yr
- Unhealthy air days in 30 yrs
- 1 days/yr
Risk factors via First Street. Map © Google.
Why this score? — see what drove the D- grade
The composite is a weighted blend of 9 inputs, each scored 0–100. Each bar is that input's sub-score; the figure is the points it added to the 100-point composite (weight × sub-score).
- Appreciation +10.0/10.0
- ARV discount +7.5/15.0
- Cash flow +6.6/30.0
- Schools +4.1/10.0
- Livability +3.0/5.0
- Condition / age +2.5/5.0
- 1% rule +1.7/10.0
- Rent growth +1.3/5.0
- DSCR +0.9/10.0
$280,000
🖨 Deal sheet 📄 Offer letter ✓ Due diligence
Listing remarks MLS
No need to pay thousands for lot clean up! Discover the potential of this exceptional clear vacant land zoned for single family residential situated near Alabama Road and State road 82.This strategically located lot offers endless Possibilities. Close proximity to shopping centers and restaurants and all amenities, making it an ideal location. Near the Southwest Florida International Airport for hassle-free travel. Don't miss out on this gem! Act now and turn your real estate dreams into reality. Contact me today to seize this fantastic opportunity.
Key facts
- Quartz countertops
- New construction
- Soft-close cabinetry
Tags
Property features AI
Finance
- Financial info: Pets allowed
- HOA & community: Non-gated community; No association fees
Exterior
- Parking: Attached garage with one covered space; Paved parking; Garage door opener; Two parking spaces (one covered)
- Security: Smoke detector(s)
- Utilities: Well water; Septic tank; Cable not available
- Home design: Single-story home; New construction; Faces northwest; Entry level is 1
- Construction: Block, concrete and stucco construction; Shingle roof
- Exterior features: Rectangular lot; Paved public-maintained road; Lot exposures to the southeast
Interior
- Kitchen: Dishwasher; Electric cooktop; Microwave; Refrigerator
- Bedrooms: Includes a great room
- Flooring: Vinyl flooring
- Bathrooms: 2 full bathrooms
- Heating & cooling: Central electric heating; Central air conditioning; Ceiling fans
- Interior features: Impact glass windows; Breakfast bar; Closet cabinetry; Kitchen island; Open living/dining area; Pantry; Separate shower (shower only)
Neighborhood map
What this means for you Summary
Snapshot
- This is a 3-bed/2.0-bath other listed at $280k.
Deal economics
- At list price, monthly cash flow is $-455 ($-5k/yr) — negative.
- To cash-flow at today's rent, offer at most $214k (23.5% below list).
- To meet the 1% rule (rent ≥ 1% of price), the offer needs to be $187k (33.1% below list).
- Recommended offer: $187k (33.1% below list) — sets the bar for 1% rule.
Location & tenants
- Location reads 59/100 on livability (#826 in FL) — a working-class tenant base; expect higher turnover. Strengths: cost of living A+, housing A+; Watch: crime C-, employment D+, schools D-.
- Lee (suburban): math 47% / reading 50% proficiency, ranked #42 of 73 in FL (top 58%) — families likely to look elsewhere, expect single-tenant / working-renter base with shorter leases.
- Market conditions: Rents falling (-4.7%/yr); 2460 active listings in the ZIP; 40 comparable units currently listed for rent nearby; rentals at typical pace (median 20d on market — plan ~3-4 weeks tenant-placement turnaround); 15,411 units permitted in Lee County in 2024 (4,686 in 5+ unit buildings).
- This rent runs 31% of the median local income ($72k/yr) — at the standard rent-burdened threshold; future hikes will face affordability resistance.
Forward outlook
- In year one you build about $30k of equity ($2k loan paydown + $28k appreciation (10.0% local appreciation)).
- Lee County population projected at +44% by 2050 — long-run rental-demand tailwind backs the buy-and-hold thesis.
- By year 2, paydown + projected appreciation supports a ~$48k cash-out refi (75% LTV) — recoverable capital for the next deal without selling this one.
Negotiation context
- It's been on market 132 days — a 12% lower offer ($246k) is reasonable based on typical stale-listing flexibility.
- 5 sale attempts since 16y ago with the ask held roughly flat each time — persistent listings suggest the price (not the market) is what's stuck; bring a comps-based counter.
- Current owner paid $32k; list at $280k implies a 762% gain — meaningful room to come down on a strong offer.
Risks & watch-outs
- Climate carrying-cost: major flood risk; severe wind risk, 99% chance of damaging wind over 30y; extreme-heat days projected 7→30/yr by 2055 (HVAC capex compounding) — expect insurance premiums to compound above CPI over the hold.
Questions for the listing agent
- What do current leases actually rent for vs. the listed asking? Can we see a recent rent roll and the last 12 months of T-12 income?
- It's been on market 132 days. Have you received any prior offers? Is the seller open to a 33% concession, seller financing, or rate buy-down credit?
- Why hasn't it sold? Are there any deal-killer items the seller is aware of (foundation, flood, title, zoning, code violations)?
- Is there a deadline driving the sale (1031 exchange, divorce, estate, relocation)? That informs how much negotiation room exists.
- Schools are D-rated, which usually means shorter tenancies and higher turnover. Who's the typical renter profile here, and what's been the actual vacancy rate?
- The area grade is low — what's the realistic commute time and amenity access for the typical tenant pool here? Any planned neighborhood developments (good or bad) we should know about?
- What's the average days-on-market for RENTAL listings here right now (not sales)? A rising rental-DOM trend means longer vacancies and softer asking-rent achievability than the comps imply.
- What's the recent tenant-quality profile in this submarket — average credit score on applications, eviction rate, late-payment / NSF rate, and stable-employment percentage? A property-management company in the area should have these aggregated.
- How much new for-sale + rental construction is in the pipeline within 1–3 miles? Heavy new supply typically softens prices + rents 12–24 months out; constrained supply supports both.
Investment metrics
- 1% rule
- 0.67% ✗
- Cap rate
- 4.34%
- Cash-on-cash
- -6.97%
- DSCR
- 0.69
- GRM
- 12.5
CMA / ARV
No comps found within radius.
Projected returns pro-forma
10.0% appreciation · 0.0% rent growth · sell at horizon
- IRR
- 18.6%
- Equity multiple
- 2.51×
- Total profit
- $118,040
- Equity at exit
- $252,246
- IRR
- 16.7%
- Equity multiple
- 5.60×
- Total profit
- $360,635
- Equity at exit
- $543,978
Cash invested: $78,400 (down + closing). Projections, not guarantees.
Landlord ↔ Tenant lean methodology
- Overall (STATE)
- 87 Strongly Landlord-Friendly
- State Florida
- 87 Strongly Landlord-Friendly · R+3
- County
- — inherits STATE
- City
- — inherits STATE
ZIP-level market 33974
- Home prices YoY
- 5.8%
- Rents YoY
- -4.7%
- Active inventory
- 2460
- Price-to-rent
- 12.5×
Monthly cashflow live
- Estimated rent
- $1,873 high interval (Pro) →
- Mortgage (P&I)
- −$1,468
- Tax est. 1.5%
- −$350 /mo · $4,200/yr
- Insurance
- −$117
- HOA
- −$0
- Vacancy / Maint / Mgmt
- −$393
- Net cashflow
- $-455
Break-even live
UW: 25.0% down · 7.5% · 30yr · 1.5% tax · 5.0% vac · 8.0% maint · 8.0% mgmt
Financing live
Cash to close
- Down payment
- $70,000
- Closing costs
- $8,400
- Reserves months
- —
- Total cash needed
- —
Loan-product check · same deal, 3 products live
Conventional
25% down · 7.5% · 30yr
- Down + closing
- —
- Monthly P&I
- —
- Monthly cashflow
- —
- DSCR
- —
- Eligible?
- —
Personal DTI + credit; lowest rate.
DSCR
20% down · 8.5% · 30yr
- Down + closing
- —
- Monthly P&I
- —
- Monthly cashflow
- —
- DSCR
- —
- Eligible?
- —
No personal income docs; deal must DSCR.
Hard money
10% down · 12.0% · 12mo
- Down + closing
- —
- Monthly P&I
- —
- Monthly cashflow
- —
- DSCR
- —
- Eligible?
- —
Short-term bridge; refi at stabilization.
Rent comps 40 comps
| Address | Beds | Baths | Sqft | Rent | $/sqft | DOM | Units | Dist |
|---|---|---|---|---|---|---|---|---|
| 813 Alabama Rd S Lehigh Acres, FL | 3.0 | 2.0 | 1200 | $1,495 | $1.25 | 24d | 1 | 0.23mi |
| 4701 Connie Ave S Lehigh Acres, FL | 3.0 | 2.0 | 1314 | $1,900 | $1.45 | 14d | 1 | 0.32mi |
| 2513 48th St SW Lehigh Acres, FL | 3.0 | 2.0 | 1423 | $1,750 | $1.23 | 16d | 1 | 0.36mi |
| 507 Peerless Cir Lehigh Acres, FL | 3.0 | 2.0 | 1408 | $2,100 | $1.49 | 24d | 1 | 0.41mi |
| 507 Peerless Cir Lehigh Acres, FL | 3.0 | 2.0 | 1408 | $2,000 | $1.42 | 3d | 1 | 0.41mi |
| 749 Alabama Rd S Unit 749 Lehigh Acres, FL | 3.0 | 2.0 | 1275 | $1,800 | $1.41 | 2d | 1 | 0.43mi |
| 177 Pennfield St Lehigh Acres, FL | 3.0 | 2.0 | 1250 | $1,850 | $1.48 | 24d | 1 | 0.43mi |
| 664 Alabama Rd S Lehigh Acres, FL | 3.0 | 2.0 | 1181 | $1,200 | $1.02 | 24d | 1 | 0.71mi |
| 577 Pierre Cir Lehigh Acres, FL | 3.0 | 2.0 | 1223 | $1,540 | $1.26 | 10d | 1 | 0.72mi |
| 662 Alabama Rd S Lehigh Acres, FL | 3.0 | 2.0 | 1181 | $1,200 | $1.02 | 24d | 1 | 0.72mi |
| 234 Pullman St Lehigh Acres, FL | 3.0 | 2.0 | 1392 | $1,800 | $1.29 | 24d | 1 | 0.76mi |
| 2517 56th St SW Lehigh Acres, FL | 3.0 | 2.0 | 1104 | $1,499 | $1.36 | 3d | 1 | 0.80mi |
| 98 Milwaukee Blvd Lehigh Acres, FL | 2.0 | 2.0 | 1221 | $1,325 | $1.09 | 3d | 1 | 0.82mi |
| 98 Milwaukee Blvd Lehigh Acres, FL | 2.0 | 2.0 | 1221 | $1,325 | $1.09 | 24d | 1 | 0.82mi |
| 115 Milwaukee Blvd Lehigh Acres, FL | 3.0 | 2.0 | 1209 | $1,600 | $1.32 | 24d | 1 | 0.84mi |
| 137 Milwaukee Blvd Lehigh Acres, FL | 3.0 | 2.0 | 1170 | $1,600 | $1.37 | 24d | 1 | 0.85mi |
| 2819 51st St SW Lehigh Acres, FL | 4.0 | 2.0 | 1472 | $2,250 | $1.53 | 24d | 1 | 0.87mi |
| 2916 42nd St SW Lehigh Acres, FL | 3.0 | 2.0 | 1399 | $1,960 | $1.40 | 3d | 1 | 0.92mi |
| 2916 42nd St SW Lehigh Acres, FL | 3.0 | 2.0 | 1399 | $1,930 | $1.38 | 2d | 1 | 0.92mi |
| 2908 51st St SW Lehigh Acres, FL | 3.0 | 2.0 | 1401 | $1,796 | $1.28 | 3d | 1 | 0.93mi |
| 430 Petite Ave Lehigh Acres, FL | 3.0 | 2.0 | 1189 | $1,850 | $1.56 | 14d | 1 | 0.94mi |
| 3001 37th St SW Lehigh Acres, FL | 3.0 | 2.5 | 1235 | $1,705 | $1.38 | 24d | 1 | 0.95mi |
| 2612 31st St Lehigh Acres, FL | 4.0 | 2.0 | 1389 | $1,799 | $1.30 | 16d | 1 | 0.96mi |
| 2612 31st St Lehigh Acres, FL | 4.0 | 2.0 | 1365 | $1,799 | $1.32 | 14d | 1 | 0.96mi |
| 320 Poplar St Lehigh Acres, FL | 3.0 | 2.0 | 1223 | $1,900 | $1.55 | 19d | 1 | 0.98mi |
| 322 Poplar St Lehigh Acres, FL | 3.0 | 2.0 | 1199 | $2,000 | $1.67 | 24d | 1 | 0.99mi |
| 19542 Fairhill Ct Lehigh Acres, FL | 3.0 | 2.0 | 1429 | $1,700 | $1.19 | 24d | 1 | 1.02mi |
| 3012 40th St SW Lehigh Acres, FL | 3.0 | 2.0 | 1427 | $1,950 | $1.37 | 24d | 1 | 1.07mi |
| 357 Grant Blvd Lehigh Acres, FL | 3.0 | 2.0 | 1200 | $1,800 | $1.50 | 16d | 1 | 1.09mi |
| 4702 Loraine Ave S Lehigh Acres, FL | 3.0 | 2.0 | 1354 | $2,000 | $1.48 | 14d | 1 | 1.10mi |
| 363 Grant Blvd Lehigh Acres, FL | 3.0 | 2.0 | 1158 | $1,700 | $1.47 | 24d | 1 | 1.11mi |
| 1112 Gifford Ave S Lehigh Acres, FL | 2.0 | 2.0 | 880 | $1,350 | $1.53 | 3d | 1 | 1.17mi |
| 1112 Gifford Ave S Lehigh Acres, FL | 2.0 | 2.0 | 880 | $1,350 | $1.53 | 24d | 1 | 1.17mi |
| 423 Morgan Cir S Lehigh Acres, FL | 3.0 | 1.0 | 920 | $1,450 | $1.58 | 24d | 1 | 1.19mi |
| 18451 Copperhead Dr #522 Lehigh Acres, FL | 2.0 | 2.0 | 1120 | $1,895 | $1.69 | 24d | 1 | 1.21mi |
| 3102 39th St SW Lehigh Acres, FL | 3.0 | 2.0 | 1097 | $1,630 | $1.49 | 21d | 1 | 1.22mi |
| 3114 39th St SW Lehigh Acres, FL | 3.0 | 2.0 | 1493 | $2,100 | $1.41 | 16d | 1 | 1.30mi |
| 3114 39th St SW Lehigh Acres, FL | 3.0 | 2.0 | 1493 | $2,100 | $1.41 | 3d | 1 | 1.30mi |
| 442 Grant Blvd Lehigh Acres, FL | 3.0 | 2.0 | 1199 | $1,625 | $1.36 | 14d | 1 | 1.32mi |
| 424 Cactus Cir Lehigh Acres, FL | 3.0 | 2.0 | 1173 | $1,495 | $1.27 | 16d | 1 | 1.34mi |
Listing history 29 events
-
2026-06-17days on market $280,000 Active 132 DOM
-
2026-06-16days on market $280,000 Active 131 DOM
-
2026-06-15days on market $280,000 Active 130 DOM
-
2026-06-13days on market $280,000 Active 128 DOM
-
2026-06-10days on market $280,000 Active 125 DOM
-
2026-06-09days on market $280,000 Active 124 DOM
-
2026-06-07days on market $280,000 Active 122 DOM
-
2026-06-02days on market $280,000 Active 117 DOM
-
2026-06-01days on market $280,000 Active 116 DOM
-
2026-06-01days on market $280,000 Active 115 DOM
-
2026-04-14price $280,000
-
2026-02-05$285,000 Active
-
2024-12-02soldstatus $32,500 Closed 555-char remark
Show marketing remark (555 chars)
No need to pay thousands for lot clean up! Discover the potential of this exceptional clear vacant land zoned for single family residential situated near Alabama Road and State road 82.This strategically located lot offers endless Possibilities. Close proximity to shopping centers and restaurants and all amenities, making it an ideal location. Near the Southwest Florida International Airport for hassle-free travel. Don't miss out on this gem! Act now and turn your real estate dreams into reality. Contact me today to seize this fantastic opportunity.
-
2024-11-19status Pending 555-char remark
Show marketing remark (555 chars)
No need to pay thousands for lot clean up! Discover the potential of this exceptional clear vacant land zoned for single family residential situated near Alabama Road and State road 82.This strategically located lot offers endless Possibilities. Close proximity to shopping centers and restaurants and all amenities, making it an ideal location. Near the Southwest Florida International Airport for hassle-free travel. Don't miss out on this gem! Act now and turn your real estate dreams into reality. Contact me today to seize this fantastic opportunity.
-
2024-07-22$32,500 Active 555-char remark
Show marketing remark (555 chars)
No need to pay thousands for lot clean up! Discover the potential of this exceptional clear vacant land zoned for single family residential situated near Alabama Road and State road 82.This strategically located lot offers endless Possibilities. Close proximity to shopping centers and restaurants and all amenities, making it an ideal location. Near the Southwest Florida International Airport for hassle-free travel. Don't miss out on this gem! Act now and turn your real estate dreams into reality. Contact me today to seize this fantastic opportunity.
-
2017-06-20soldstatus $5,000 Sold 87-char remark
Show marketing remark (87 chars)
Duplex Lot in great neighborhood. 7 other lots available if looking for a package deal.
-
2017-06-05status Pending 87-char remark
Show marketing remark (87 chars)
Duplex Lot in great neighborhood. 7 other lots available if looking for a package deal.
-
2017-05-19price $5,900 87-char remark
Show marketing remark (87 chars)
Duplex Lot in great neighborhood. 7 other lots available if looking for a package deal.
-
2017-03-31price $6,800 87-char remark
Show marketing remark (87 chars)
Duplex Lot in great neighborhood. 7 other lots available if looking for a package deal.
-
2017-02-20$6,900 Active 87-char remark
Show marketing remark (87 chars)
Duplex Lot in great neighborhood. 7 other lots available if looking for a package deal.
-
2016-11-23price $6,500
-
2016-11-23soldstatus $6,500 Sold
-
2016-11-20price $7,500
-
2016-11-14status Pending
-
2016-01-22price $7,500
-
2015-04-17price $9,900
-
2015-02-16$11,900 Active
-
2014-12-31historical
-
2010-05-19$12,500
ⓘ Source: listings_history table (triggers on properties + properties_extension) + one-shot
backfill from property_details.listing_events for pre-trigger history.
Climate risk First Street
- Flood 6/10 Major FEMA zone X (unshaded) · 68% chance over 30 yrs
- Wildfire 4/10 Moderate
- Heat 10/10 Extreme 7 d/yr ≥107°F today · 30 d/yr by 30 yrs out
- Wind 10/10 Extreme 99% chance of damaging wind over 30 yrs
- Air quality 2/10 Low 1 unhealthy d/yr today · 1 by 30 yrs out
Nearby sold comps map
Loading sold comps map…
Walkable amenities ~0.75 mi
Loading nearby amenities…
Taxation est. · year 1
- Rental income
- $22,478
- − Mortgage interest
- −$15,684
- − Property taxes
- −$4,200
- − Insurance
- −$1,400
- − Repairs & maintenance
- −$1,798
- − Management
- −$1,798
- − Depreciation
- −$8,145
- Taxable loss
- −$10,549
- Est. tax savings @ 24.0%
- +$2,532
- After-tax cash flow
- $-2,931/yr
For passive investors: Depreciation is non-cash, so a rental often shows a tax loss while cash-flowing — sheltering income. Rental losses are passive: they offset passive income freely, and up to $25,000/yr can offset ordinary (W-2) income if you actively participate and your MAGI is under $100k (phasing out to $0 by $150k); unused losses carry forward. On sale, claimed depreciation is recaptured at up to 25%, and gains may owe capital-gains tax (a 1031 exchange can defer both). Figures are a year-1 estimate at your 24.0% rate — not tax advice; consult a CPA.
Schools (NCES district)
- District
- Lee
- NCES district ID
- 1201080
- Math proficiency
- 47% ▼ -11.00%
- Reading proficiency
- 50% ▼ -4.00%
- Median HH income
- $49,518
- Composite
- 41.49/100
- National rank
- #3458
- State rank
- #42 of 73 in FL
Livability — Lehigh Acres
- Score
- 59/100
- State rank
- #826
- US rank
- #20055
Category grades
Schools grade is shown separately in the Schools card above.
Census & demographics
- Census place
- Lehigh Acres, FL
- County
- Lee County · 788,662 people
- City population
- 130,638
- Metro
- Cape Coral-Fort Myers, FL
- Population (ZIP)
- 19,927
- Household income
- $72,192
- Rent vs Own
- Severe rent burden
- 434.0
Population outlook (Lee County) Hauer SSP2
- Today (2025)
- 871,946 people
- By 2030
- 955,468 · +9.6%
- By 2040
- 1,113,587 · +27.7%
- By 2050
- 1,256,891 · +44.1%
- By 2075
- 1,560,270 · +78.9%
- By 2100
- 1,726,848 · +98.0%
Race, ethnicity, and origin ACS 2023
- Neighborhood character
- Diverse neighborhood (Simpson 0.64)
- Race & ethnicity
- Hispanic / Latino 52% Two or more races 31% White 26% Black 18%
- Hispanic origin (detail)
- Mexican 12% Puerto Rican 7% Cuban 20% Dominican 4%
- Common ancestry
- Hispanic 7% Italian 1% Portuguese 1%
- Foreign-born
- 32% · Canada, Jamaica
- Languages at home
- 48% English-only · Spanish 43% French/Haitian/Cajun 7% Other Indo-European 1%
Political lean MEDSL · Lee
- 2024 margin
- Strong R (+28.4) · D 35.5% · R 63.9%
- 2008→2024 swing
- -18.0pp toward R · 2008: -10.4pp · 2024: -28.4pp
- All cycles
- 2024: R+28.4 2020: R+19.2 2016: R+20.4 2012: R+16.6 2008: R+10.4
Not yet ingested
- Civics
- —
Market trends
- HPI YoY
- ▲ 16.53%
- Current HPI
- 303.3399
- Rent YoY
- ▼ -4.68%
- Metro
- Cape Coral-Fort Myers, FL
- State GDP YoY
- ▲ 3.28%
- F500 in state
- 36
Industry mix (Fortune 500 HQ in FL)
| Industry | F500 HQs | Revenue |
|---|---|---|
| Industrial Technology | 2 | $29B |
|
||
| Insurance | 2 | $17B |
|
||
| Retail | 1 | $60B |
|
||
| Technology Distribution | 1 | $58B |
|
||
| Homebuilding | 1 | $35B |
|
||
| Technology Manufacturing | 1 | $35B |
|
||
Price history
+2140.0% since first listed19 events — show timeline
- 2026-04-14 Price Changed $280,000 FORTMLS
- 2026-02-05 Listed $285,000 FORTMLS
- 2024-12-02 Sold (MLS) $32,500 FORTMLS
- 2024-11-19 Pending — FORTMLS
- 2024-07-22 Listed $32,500 FORTMLS
- 2017-06-20 Sold (MLS) $5,000 FORTMLS
- 2017-06-05 Pending — FORTMLS
- 2017-05-19 Price Changed $5,900 FORTMLS
- 2017-03-31 Price Changed $6,800 FORTMLS
- 2017-02-20 Listed $6,900 FORTMLS
- 2016-11-23 Price Changed $6,500 FORTMLS
- 2016-11-23 Sold (MLS) $6,500 FORTMLS
- 2016-11-20 Price Changed $7,500 FORTMLS
- 2016-11-14 Pending — FORTMLS
- 2016-01-22 Price Changed $7,500 FORTMLS
- 2015-04-17 Price Changed $9,900 FORTMLS
- 2015-02-16 Listed $11,900 FORTMLS
- 2014-12-31 Listing Removed — FORTMLS
- 2010-05-19 Listed $12,500 FORTMLS
Property tax history
+20.6%/yrLatest (2022): $309 · +12.3% YoY. Source: county tax records.
Cash-flow waterfall
monthlySold comps — $/sqft
last 12 mo · ≤1 miLoading sold comps…