1550 Gulf Shore Blvd N Unit W4 · Naples, FL
Flood risk 9/10 · Severe
- FEMA flood zone
- AE
- Chance of flooding over 30 yrs
- 0.99%
- Est. flood insurance / yr
- $1,737 – $8,500
Fire risk 1/10 · Minimal
- Est. fire insurance / yr
- $947 – $1,759
Heat risk 10/10 · Severe
- Hot days now (above 111°F)
- 7 days/yr
- Hot days in 30 yrs
- 26 days/yr
Wind risk 10/10 · Severe
- Chance of severe wind over 30 yrs
- 99.0%
Air-quality risk 2/10 · Minimal
- Unhealthy air days now
- 2 days/yr
- Unhealthy air days in 30 yrs
- 2 days/yr
Risk factors via First Street. Map © Google.
Why this score? — see what drove the B- grade
The composite is a weighted blend of 9 inputs, each scored 0–100. Each bar is that input's sub-score; the figure is the points it added to the 100-point composite (weight × sub-score).
- Cash flow +22.3/30.0
- 1% rule +8.6/10.0
- ARV discount +7.5/15.0
- DSCR +7.1/10.0
- Appreciation +7.0/10.0
- Schools +5.0/10.0
- Rent growth +4.7/5.0
- Livability +4.0/5.0
- Condition / age +2.5/5.0
$345,000
🖨 Deal sheet 📄 Offer letter ✓ Due diligence
Listing remarks
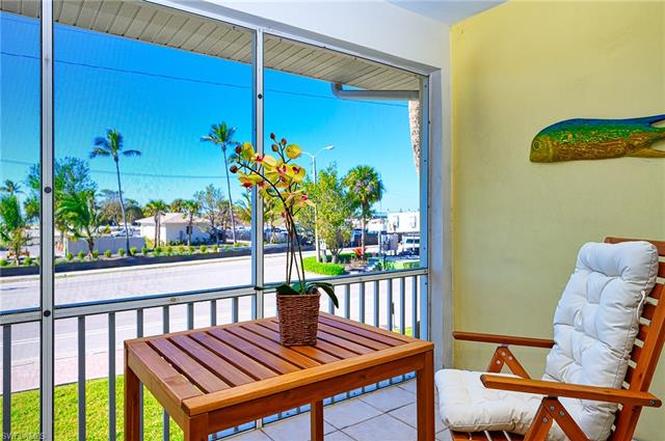
LOCATION, LOCATION, LOCATION! Motivated seller, priced to sell. This bright and airy second-floor condo is just steps from Lowdermilk Beach, offering refreshing Gulf breezes and abundant natural light throughout. Enjoy breathtaking sunsets right from your private balcony, along with peaceful water views from both the bedroom and living area. Perfectly situated for the Naples lifestyle only a short bike ride to the world-class dining, boutiques, and galleries of Fifth Avenue South and Third Street South, and close to Venetian Village and Waterside Shops. In addition to classic coastal-living perks, this residence offers outstanding water-lifestyle opportunities. Owners have easy access for l
Key facts
- Water views
- Second floor condo
- Private balcony
Tags
Property features AI
Other
- Other: Possession at closing
Finance
- Other: Part of a complex with 16 units; 8 units in building; 2 units per floor; single-floor units
- Financial info: HOA fee amount reported as $3,000 (quarterly)
- HOA & community: Mandatory HOA; Quarterly HOA fee; Professional management; Maintenance includes cable, insurance, internet/WiFi, irrigation water, lawn/land maintenance, legal/accounting, manager, master association fee, pest control (interior & exterior), reserves, sewer, street lights, trash removal, water; Community amenities include BBQ/picnic area, beach access, bike and jog path, bike storage, extra storage, fish cleaning station, fishing pier, internet access, sidewalks; Community type: Boating; Total annual recurring HOA fees: $12,000; One-time fees: $200
Exterior
- Parking: 1 assigned parking space; Driveway paved; Guest parking; Paved parking; Street parking
- Security: Impact resistant doors; Impact resistant windows
- Utilities: Central water; Central sewer; Cable available
- Home design: Residential property; Low-rise (1-3) Florida-style building; Rear exposure facing east; Located in Coquina Sands / Lago Mar development
- Marina/Dock: Composite dock with electricity and water available; Gulf access via bridges
- Construction: Concrete block construction; Tile roof; Stone exterior finish; Built in 1968; Foundation: (standard for concrete block construction)
- Exterior features: Courtyard; Storage; Across from beach access; Across from waterfront; Gulf and bay views; Central irrigation
Interior
- Kitchen: Electric cooktop; Self-cleaning oven; Dishwasher; Microwave; Refrigerator/ice maker; Disposal; Pantry
- Bedrooms: 1 bedroom
- Flooring: Carpet; Tile
- Bathrooms: Master bath with combo tub and shower; 1 full bathroom
- Heating & cooling: Wall unit heat; Wall unit cooling; Ceiling fans
- Interior features: Built-in cabinets; Cable pre-wired; High-speed internet available; Pantry; Smoke detectors; Window coverings; Dining area in living room; Family room; Screened lanai/porch; Partially furnished; Great room floor plan
- Laundry & utility: Washer and dryer in residence
Neighborhood map
What this means for you Summary
Snapshot
- This is a 1-bed/1.0-bath condo listed at $345k.
Deal economics
- At list price, monthly cash flow is $140 ($2k/yr) — positive.
- The deal already cash-flows at list — no discount required.
- Meets the 1% rule at list price ($5k rent vs $345k).
- Recommended offer: $304k (12.0% below list) — sets the bar for market timing.
Location & tenants
- Location reads 80/100 on livability (#126 in FL, #1,903 nationally) — a professional / high-income tenant draw. Strengths: crime A+, amenities A+, employment A+; Watch: commute D+, cost of living F.
- Collier (suburban): math 60% / reading 56% proficiency, ranked #16 of 73 in FL (top 22%) — acceptable for families but not a draw, mixed tenant base, ~2y average lease.
- Market conditions: Rents rising fast (+8.8%/yr); 614 active listings in the ZIP; 26 comparable units currently listed for rent nearby; rentals at typical pace (median 23d on market — plan ~3-4 weeks tenant-placement turnaround); high-income renter base; 3,520 units permitted in Collier County in 2024 (959 in 5+ unit buildings).
- This rent runs 43% of the median local income ($131k/yr) — at the standard rent-burdened threshold; future hikes will face affordability resistance.
Forward outlook
- In year one you build about $16k of equity ($2k loan paydown + $14k appreciation (4.1% local appreciation)).
- Collier County population projected at +30% by 2050 — long-run rental-demand tailwind backs the buy-and-hold thesis.
- At projected returns (4.1% appreciation + 8.0% rent growth), your $97k cash investment doubles in ~5 years — after that, you're playing with house money.
- By year 3, paydown + projected appreciation supports a ~$41k cash-out refi (75% LTV) — recoverable capital for the next deal without selling this one.
Negotiation context
- It's been on market 211 days — a 12% lower offer ($304k) is reasonable based on typical stale-listing flexibility.
- 2 sale attempts with the ask held roughly flat each time — persistent listings suggest the price (not the market) is what's stuck; bring a comps-based counter.
Risks & watch-outs
- Watch-outs: flood insurance adds $427/mo; HOA is 21% of rent.
- Climate carrying-cost: in FEMA flood zone AE (mandatory federal flood insurance); severe wind risk, 99% chance of damaging wind over 30y; extreme-heat days projected 7→26/yr by 2055 (HVAC capex compounding) — expect insurance premiums to compound above CPI over the hold.
Questions for the listing agent
- It's been on market 211 days. Have you received any prior offers? Is the seller open to a 12% concession, seller financing, or rate buy-down credit?
- Built in 1968 — when were the roof, HVAC, electrical panel, plumbing, and water heater last replaced?
- What's the actual annual flood-insurance premium (NFIP or private), and is the property in a SFHA with mandatory coverage?
- What does the HOA fee cover, when was the last increase, and are there any pending special assessments or reserve-fund shortfalls?
- Any open or pending special assessments — roof, HVAC, plumbing, elevator, façade? What's the per-unit balance and payoff schedule, and is the seller paying it off at close or rolling it to the buyer?
- Why hasn't it sold? Are there any deal-killer items the seller is aware of (foundation, flood, title, zoning, code violations)?
- Is there a deadline driving the sale (1031 exchange, divorce, estate, relocation)? That informs how much negotiation room exists.
- Schools are B-rated — typically a magnet for longer-tenancy family renters. What's the average tenant stay here, and is there a school-zone premium baked into asking?
- What's the average days-on-market for RENTAL listings here right now (not sales)? A rising rental-DOM trend means longer vacancies and softer asking-rent achievability than the comps imply.
- What's the recent tenant-quality profile in this submarket — average credit score on applications, eviction rate, late-payment / NSF rate, and stable-employment percentage? A property-management company in the area should have these aggregated.
- How much new apartment / multifamily construction is in the pipeline within 1–3 miles? Heavy new supply (>2% of stock underway) typically softens rents 12–24 months out; light construction supports rent growth.
Investment metrics
- 1% rule
- 1.36% ✓
- Cap rate
- 8.26%
- Cash-on-cash
- 7.04%
- DSCR
- 1.31
- GRM
- 6.1
CMA / ARV
No comps found within radius.
Projected returns pro-forma
4.08% appreciation · 8.0% rent growth · sell at horizon
- IRR
- 15.8%
- Equity multiple
- 2.00×
- Total profit
- $96,200
- Equity at exit
- $176,606
- IRR
- 20.0%
- Equity multiple
- 4.66×
- Total profit
- $353,410
- Equity at exit
- $290,207
Cash invested: $96,600 (down + closing). Projections, not guarantees.
Landlord ↔ Tenant lean methodology
- Overall (STATE)
- 87 Strongly Landlord-Friendly
- State Florida
- 87 Strongly Landlord-Friendly · R+3
- County
- — inherits STATE
- City
- — inherits STATE
ZIP-level market 34102
- Home prices YoY
- 1.3%
- Rents YoY
- 8.8%
- Active inventory
- 614
- Price-to-rent
- 6.1×
Monthly cashflow live
- Estimated rent
- $4,683 medium interval (Pro) →
- Mortgage (P&I)
- −$1,809
- Tax from tax record
- −$181 /mo · $2,166/yr
- Insurance
- −$144
- Flood insurance flood zone
- −$427 /mo · $5,118/yr
- HOA
- −$1,000
- Vacancy / Maint / Mgmt
- −$984
- Net cashflow
- $140
Break-even live
UW: 25.0% down · 7.5% · 30yr · 1.5% tax · 5.0% vac · 8.0% maint · 8.0% mgmt
Financing live
Cash to close
- Down payment
- $86,250
- Closing costs
- $10,350
- Reserves months
- —
- Total cash needed
- —
Loan-product check · same deal, 3 products live
Conventional
25% down · 7.5% · 30yr
- Down + closing
- —
- Monthly P&I
- —
- Monthly cashflow
- —
- DSCR
- —
- Eligible?
- —
Personal DTI + credit; lowest rate.
DSCR
20% down · 8.5% · 30yr
- Down + closing
- —
- Monthly P&I
- —
- Monthly cashflow
- —
- DSCR
- —
- Eligible?
- —
No personal income docs; deal must DSCR.
Hard money
10% down · 12.0% · 12mo
- Down + closing
- —
- Monthly P&I
- —
- Monthly cashflow
- —
- DSCR
- —
- Eligible?
- —
Short-term bridge; refi at stabilization.
Rent comps 26 comps
| Address | Beds | Baths | Sqft | Rent | $/sqft | DOM | Units | Dist |
|---|---|---|---|---|---|---|---|---|
| 1550 Gulf Shore Blvd N Unit E6 Naples, FL | 1.0 | 1.0 | 817 | $7,000 | $8.57 | 13d | 1 | 0.02mi |
| 1550 Gulf Shore Blvd N Unit E6 Naples, FL | 1.0 | 1.0 | 817 | $7,000 | $8.57 | 21d | 1 | 0.02mi |
| 1300 Gulf Shore Blvd N #406 Naples, FL | 2.0 | 2.0 | 850 | $6,500 | $7.65 | 23d | 1 | 0.15mi |
| 1300 Gulf Shore Blvd N #700 Naples, FL | 2.0 | 2.0 | 850 | $6,250 | $7.35 | 23d | 1 | 0.15mi |
| 1300 Gulf Shore Blvd N #205 Naples, FL | 2.0 | 2.0 | 850 | $5,900 | $6.94 | 23d | 1 | 0.15mi |
| 1300 Gulf Shore Blvd N #304 Naples, FL | 2.0 | 2.0 | 850 | $5,500 | $6.47 | 23d | 1 | 0.15mi |
| 1334 Crayton Rd #1 Naples, FL | 2.0 | 2.0 | 1100 | $6,800 | $6.18 | 23d | 1 | 0.22mi |
| 1100 Gulf Shore Blvd N Naples, FL | 2.0 | 2.0 | 945 | $6,000 | $6.35 | 23d | 2 | 0.30mi |
| 1910 Gulf Shore Blvd N Naples, FL | 2.0 | 2.0 | 1290 | $9,200 | $7.13 | 23d | 2 | 0.33mi |
| 1950 Gulf Shore Blvd N Naples, FL | 2.0 | 2.0 | 1060 | $7,250 | $6.84 | 23d | 2 | 0.41mi |
| 2011 Gulf Shore Blvd N #45 Naples, FL | 2.0 | 2.0 | 1100 | $8,500 | $7.73 | 23d | 1 | 0.42mi |
| 2170 Gulf Shore Blvd N Unit 41E Naples, FL | 1.0 | 1.0 | 682 | $6,000 | $8.80 | 23d | 1 | 0.67mi |
| 333 Harbour Dr #211 Naples, FL | 2.0 | 2.0 | 975 | $5,500 | $5.64 | 13d | 1 | 1.19mi |
| 820 Ketch Dr #3 Naples, FL | 2.0 | 2.0 | 1100 | $5,500 | $5.00 | 23d | 1 | 1.33mi |
| 820 Ketch Dr #2 Naples, FL | 2.0 | 2.0 | 1100 | $5,700 | $5.18 | 23d | 1 | 1.33mi |
| 3200 Gulf Shore Blvd N #105 Naples, FL | 2.0 | 2.0 | 1116 | $8,500 | $7.62 | 23d | 1 | 1.39mi |
| 3030 Binnacle Dr #201 Naples, FL | 2.0 | 2.0 | 1092 | $5,000 | $4.58 | 23d | 1 | 1.40mi |
| 766 Central Ave Naples, FL | 2.0–3.0 | 2.0 | 855 | $6,300 | $7.37 | 21d | 3 | 1.41mi |
| 766 Central Ave Naples, FL | 2.0–3.0 | 2.0 | 943 | $5,000 | $5.30 | 13d | 4 | 1.41mi |
| 101 8th St S Naples, FL | 1.0 | 1.0–2.0 | 940 | $12,600 | $13.40 | 13d | 4 | 1.47mi |
| 101 8th St S Naples, FL | 1.0 | 1.0–2.0 | 940 | $12,600 | $13.40 | 23d | 4 | 1.47mi |
| 284 4th St S #103 Naples, FL | 2.0 | 2.0 | 979 | $9,000 | $9.19 | 23d | 1 | 1.47mi |
| 282 4th St S Naples, FL | 2.0 | 2.0 | 1058 | $11,000 | $10.40 | 23d | 1 | 1.47mi |
| 290 4th St S #202 Naples, FL | 2.0 | 2.0 | 1058 | $10,000 | $9.45 | 23d | 1 | 1.47mi |
| 286 4th St S #203 Naples, FL | 2.0 | 2.0 | 1058 | $10,000 | $9.45 | 23d | 1 | 1.47mi |
| 230 3rd Ave S #4 Naples, FL | 2.0 | 2.5 | 978 | $12,000 | $12.27 | 23d | 1 | 1.50mi |
HOA detail condo
- Monthly dues
- $1,000 · $12,000/yr
- Likely covers
- water
- Assessments
- None detected in remarks — confirm with the listing agent.
Listing history 18 events
-
2026-06-18days on market $345,000 Active 211 DOM
-
2026-06-17days on market $345,000 Active 210 DOM
-
2026-06-16days on market $345,000 Active 209 DOM
-
2026-06-15days on market $345,000 Active 208 DOM
-
2026-06-10days on market $345,000 Active 203 DOM
-
2026-06-09days on market $345,000 Active 202 DOM
-
2026-06-08days on market $345,000 Active 201 DOM
-
2026-06-07days on market $345,000 Active 200 DOM
-
2026-06-03days on market $345,000 Active 196 DOM
-
2026-06-02days on market $345,000 Active 195 DOM
-
2026-06-01days on market $345,000 Active 194 DOM
-
2026-05-31days on market $345,000 Active 193 DOM
-
2026-05-30days on market $345,000 Active 192 DOM
-
2026-05-16price $345,000
-
2025-11-19$359,900 Active
-
2025-05-23historical
-
2025-03-10price $399,000
-
2025-01-10$445,000 Active
ⓘ Source: listings_history table (triggers on properties + properties_extension) + one-shot
backfill from property_details.listing_events for pre-trigger history.
Tax reassessment forecast FL · Resets to sale price
- Current annual tax
- $2,166 · $181/mo
- Projected year-2 tax
- $2,864 · $239/mo
- Expected delta
- +$697/yr (+$58/mo · 32.2%)
ⓘ Screening estimate from a state-policy table — verify with the county assessor before closing.
Climate risk First Street
- Flood 9/10 Extreme FEMA zone AE · 99% chance over 30 yrs
- Wildfire 1/10 Low
- Heat 10/10 Extreme 7 d/yr ≥111°F today · 26 d/yr by 30 yrs out
- Wind 10/10 Extreme 99% chance of damaging wind over 30 yrs
- Air quality 2/10 Low 2 unhealthy d/yr today · 2 by 30 yrs out
Nearby sold comps map
Loading sold comps map…
Walkable amenities ~0.75 mi
Loading nearby amenities…
Taxation est. · year 1
- Rental income
- $56,200
- − Mortgage interest
- −$19,325
- − Property taxes
- −$2,166
- − Insurance
- −$6,844
- − Repairs & maintenance
- −$4,496
- − Management
- −$4,496
- − HOA
- −$12,000
- − Depreciation
- −$10,036
- Taxable loss
- −$3,163
- Est. tax savings @ 24.0%
- +$759
- After-tax cash flow
- $2,437/yr
For passive investors: Depreciation is non-cash, so a rental often shows a tax loss while cash-flowing — sheltering income. Rental losses are passive: they offset passive income freely, and up to $25,000/yr can offset ordinary (W-2) income if you actively participate and your MAGI is under $100k (phasing out to $0 by $150k); unused losses carry forward. On sale, claimed depreciation is recaptured at up to 25%, and gains may owe capital-gains tax (a 1031 exchange can defer both). Figures are a year-1 estimate at your 24.0% rate — not tax advice; consult a CPA.
Schools (NCES district)
- District
- Collier
- NCES district ID
- 1200330
- Math proficiency
- 60% ▼ -4.00%
- Reading proficiency
- 56% ▼ -2.00%
- Median HH income
- $58,275
- Composite
- 50.23/100
- National rank
- #1892
- State rank
- #16 of 73 in FL
Livability — Naples
- Score
- 80/100
- State rank
- #126
- US rank
- #1903
Category grades
Schools grade is shown separately in the Schools card above.
Census & demographics
- Census place
- Naples, FL
- County
- Collier County · 396,295 people
- City population
- 344,941
- Metro
- Naples-Marco Island, FL
- Population (ZIP)
- 11,179
- Household income
- $130,929
- Rent vs Own
- Severe rent burden
- 333.0
Population outlook (Collier County) Hauer SSP2
- Today (2025)
- 420,858 people
- By 2030
- 450,054 · +6.9%
- By 2040
- 502,232 · +19.3%
- By 2050
- 544,932 · +29.5%
- By 2075
- 627,203 · +49.0%
- By 2100
- 659,015 · +56.6%
Race, ethnicity, and origin ACS 2023
- Neighborhood character
- Predominantly White (79%)
- Race & ethnicity
- White 79% Hispanic / Latino 9% Two or more races 8% Black 8% Asian 1%
- Hispanic origin (detail)
- Cuban 6%
- Common ancestry
- Hispanic 4% Lithuanian 4% Romanian 4%
- Foreign-born
- 17% · Canada, China
- Languages at home
- 87% English-only · Spanish 7% French/Haitian/Cajun 4% German/W. Germanic 1%
Political lean MEDSL · Collier
- 2024 margin
- Solid R (+33.1) · D 33.1% · R 66.2%
- 2008→2024 swing
- -10.6pp toward R · 2008: -22.5pp · 2024: -33.1pp
- All cycles
- 2024: R+33.1 2020: R+24.7 2016: R+26.0 2012: R+30.1 2008: R+22.5
Not yet ingested
- Civics
- —
Market trends
- HPI YoY
- ▲ 4.08%
- Current HPI
- 328.2755
- Rent YoY
- ▲ 8.75%
- Metro
- Naples-Marco Island, FL
- State GDP YoY
- ▲ 3.28%
- F500 in state
- 36
Industry mix (Fortune 500 HQ in FL)
| Industry | F500 HQs | Revenue |
|---|---|---|
| Industrial Technology | 2 | $29B |
|
||
| Insurance | 2 | $17B |
|
||
| Retail | 1 | $60B |
|
||
| Technology Distribution | 1 | $58B |
|
||
| Homebuilding | 1 | $35B |
|
||
| Technology Manufacturing | 1 | $35B |
|
||
Price history
-22.5% since first listed5 events — show timeline
- 2026-05-16 Price Changed $345,000 NAPLESMLS
- 2025-11-19 Listed $359,900 NAPLESMLS
- 2025-05-23 Listing Removed — NAPLESMLS
- 2025-03-10 Price Changed $399,000 NAPLESMLS
- 2025-01-10 Listed $445,000 NAPLESMLS
Property tax history
+3.9%/yrLatest (2025): $2,166 · +8.9% YoY. Source: county tax records.
Cash-flow waterfall
monthlySold comps — $/sqft
last 12 mo · ≤1 miLoading sold comps…