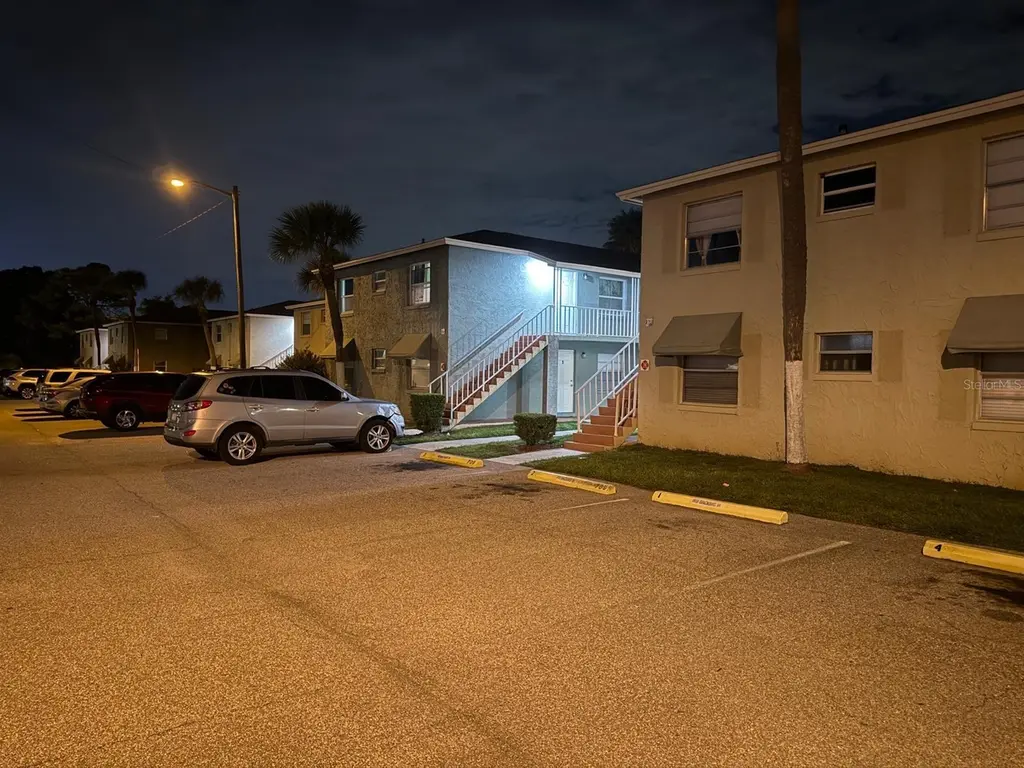
719 Michigan Ct #3 · St. Cloud, FL
Flood risk 1/10 · Minimal
- FEMA flood zone
- X (unshaded)
- Chance of flooding over 30 yrs
- 0.0%
- Est. flood insurance / yr
- $507 – $1,088
Fire risk 4/10 · Minor
- Est. fire insurance / yr
- $947 – $1,759
Heat risk 9/10 · Severe
- Hot days now (above 108°F)
- 7 days/yr
- Hot days in 30 yrs
- 24 days/yr
Wind risk 9/10 · Severe
- Chance of severe wind over 30 yrs
- 99.0%
Air-quality risk 1/10 · Minimal
- Unhealthy air days now
- 0 days/yr
- Unhealthy air days in 30 yrs
- 0 days/yr
Risk factors via First Street. Map © Google.
Why this score? — see what drove the D grade
The composite is a weighted blend of 9 inputs, each scored 0–100. Each bar is that input's sub-score; the figure is the points it added to the 100-point composite (weight × sub-score).
- Cash flow +11.7/30.0
- ARV discount +7.5/15.0
- 1% rule +6.5/10.0
- Schools +3.6/10.0
- DSCR +3.5/10.0
- Rent growth +2.8/5.0
- Livability +2.5/5.0
- Condition / age +2.5/5.0
- Appreciation +0.0/10.0
$130,000
🖨 Deal sheet 📄 Offer letter ✓ Due diligence
Listing remarks
One or more photo(s) has been virtually staged. Nice two bedrooms apartment, GREAT FOR INVESTMENT, RENTAL OR FIRST TIME BUYERS. On second floor, close to major highways. just a short distance from Elementary Middle and High School. Excellent access and close to major supermarkets, banks, shopping and restaurants. Community features swimming pool, clubhouse, playground and laundry room. Some pictures are Virtually staged. equal opportunity housing.
Key facts
- Second floor
- Excellent access
- $350 HOA
Tags
Property features AI
Finance
- Other: Unfurnished unit; Living area approximately 784 sq ft (public records); Building total area approximately 871 sq ft (public records); Unit located in Building 3; Unit on second floor, unit 3 (Palm Gardens Condo)
- Financial info: Total annual association fees: $4,200; No lease restrictions indicated
- HOA & community: Monthly condo/association fee: $350; Association covers common area taxes and pool; Association approval required; Association name: Miriam Solis; Community clubhouse; Pets allowed
Exterior
- Parking: 2-car garage
- Utilities: Public water; Public sewer; Cable available; Electricity available
- Home design: Residential condominium; One story; Second-floor unit; Faces east
- Construction: Block and stucco construction; Shingle roof; Built on slab foundation
- Exterior features: Other exterior features; Asphalt road access
Interior
- Kitchen: Convection oven; Dishwasher; Disposal; Freezer; Microwave
- Bedrooms: 2 bedrooms
- Flooring: Ceramic tile; Slab foundation
- Bathrooms: 1 full bathroom
- Heating & cooling: Central heating; Central air conditioning
- Interior features: Other interior features; Building has no elevator
- Laundry & utility: Laundry in a common area; Outdoor laundry access
Neighborhood map
What this means for you Summary
Snapshot
- This is a 2-bed/1.0-bath condo listed at $130k.
Deal economics
- At list price, monthly cash flow is $-37 ($-443/yr) — negative.
- To cash-flow at today's rent, offer at most $123k (5.0% below list).
- Meets the 1% rule at list price ($1k rent vs $130k).
- Recommended offer: $114k (12.0% below list) — sets the bar for market timing.
- Cap rate 6.0% vs local median 4.0% in St. Cloud — top-decile yield for the area; either an underpriced asset or a hidden risk that comps aren't pricing in. Stress-test before assuming the spread holds.
Location & tenants
- Location reads: area grade D — affects rentability + tenant quality, not the cash-flow math above.
- Osceola (suburban): math 39% / reading 45% proficiency, ranked #60 of 73 in FL (top 82%) — families likely to look elsewhere, expect single-tenant / working-renter base with shorter leases; 60% free/reduced lunch — lower-income household profile, screen leases tightly.
- Market conditions: Rents rising (+1.4%/yr); 258 active listings in the ZIP; 29 comparable units currently listed for rent nearby; rentals at typical pace (median 22d on market — plan ~3-4 weeks tenant-placement turnaround); 8,813 units permitted in Osceola County in 2024 (3,072 in 5+ unit buildings).
Forward outlook
- Local home prices are declining (-3.0%/yr); year-one equity from $899 of loan paydown is wiped out by about $4k of value loss. Plan a longer hold.
- Osceola County population projected at +73% by 2050 — long-run rental-demand tailwind backs the buy-and-hold thesis.
Negotiation context
- It's been on market 251 days — a 12% lower offer ($114k) is reasonable based on typical stale-listing flexibility.
- 3 sale attempts since 19y ago with the ask held roughly flat each time — persistent listings suggest the price (not the market) is what's stuck; bring a comps-based counter.
- Current owner paid $40k; list at $130k implies a 225% gain — meaningful room to come down on a strong offer.
Risks & watch-outs
- Watch-outs: HOA is 23% of rent.
- Climate carrying-cost: severe wind risk, 99% chance of damaging wind over 30y; extreme-heat days projected 7→24/yr by 2055 (HVAC capex compounding) — expect insurance premiums to compound above CPI over the hold.
Questions for the listing agent
- What do current leases actually rent for vs. the listed asking? Can we see a recent rent roll and the last 12 months of T-12 income?
- It's been on market 251 days. Have you received any prior offers? Is the seller open to a 12% concession, seller financing, or rate buy-down credit?
- Built in 1972 — when were the roof, HVAC, electrical panel, plumbing, and water heater last replaced?
- What does the HOA fee cover, when was the last increase, and are there any pending special assessments or reserve-fund shortfalls?
- Any open or pending special assessments — roof, HVAC, plumbing, elevator, façade? What's the per-unit balance and payoff schedule, and is the seller paying it off at close or rolling it to the buyer?
- Why hasn't it sold? Are there any deal-killer items the seller is aware of (foundation, flood, title, zoning, code violations)?
- Is there a deadline driving the sale (1031 exchange, divorce, estate, relocation)? That informs how much negotiation room exists.
- The area grade is low — what's the realistic commute time and amenity access for the typical tenant pool here? Any planned neighborhood developments (good or bad) we should know about?
- What's the average days-on-market for RENTAL listings here right now (not sales)? A rising rental-DOM trend means longer vacancies and softer asking-rent achievability than the comps imply.
- What's the recent tenant-quality profile in this submarket — average credit score on applications, eviction rate, late-payment / NSF rate, and stable-employment percentage? A property-management company in the area should have these aggregated.
- How much new apartment / multifamily construction is in the pipeline within 1–3 miles? Heavy new supply (>2% of stock underway) typically softens rents 12–24 months out; light construction supports rent growth.
Investment metrics
- 1% rule
- 1.15% ✓
- Cap rate
- 5.95%
- Cash-on-cash
- -1.22%
- DSCR
- 0.95
- GRM
- 7.3
CMA / ARV
No comps found within radius.
Projected returns pro-forma
-3.0% appreciation · 1.35% rent growth · sell at horizon
- IRR
- -20.7%
- Equity multiple
- 0.30×
- Total profit
- $-25,640
- Equity at exit
- $19,383
- IRR
- -19.4%
- Equity multiple
- 0.06×
- Total profit
- $-34,153
- Equity at exit
- $11,240
Cash invested: $36,400 (down + closing). Projections, not guarantees.
Landlord ↔ Tenant lean methodology
- Overall (STATE)
- 87 Strongly Landlord-Friendly
- State Florida
- 87 Strongly Landlord-Friendly · R+3
- County
- — inherits STATE
- City
- — inherits STATE
ZIP-level market 34769
- Home prices YoY
- -24.6%
- Rents YoY
- 1.4%
- Active inventory
- 258
- Price-to-rent
- 7.3×
Monthly cashflow live
- Estimated rent
- $1,493 high interval (Pro) →
- Mortgage (P&I)
- −$682
- Tax from tax record
- −$131 /mo · $1,569/yr
- Insurance
- −$54
- HOA
- −$350
- Vacancy / Maint / Mgmt
- −$314
- Net cashflow
- $-37
Break-even live
UW: 25.0% down · 7.5% · 30yr · 1.5% tax · 5.0% vac · 8.0% maint · 8.0% mgmt
Financing live
Cash to close
- Down payment
- $32,500
- Closing costs
- $3,900
- Reserves months
- —
- Total cash needed
- —
Loan-product check · same deal, 3 products live
Conventional
25% down · 7.5% · 30yr
- Down + closing
- —
- Monthly P&I
- —
- Monthly cashflow
- —
- DSCR
- —
- Eligible?
- —
Personal DTI + credit; lowest rate.
DSCR
20% down · 8.5% · 30yr
- Down + closing
- —
- Monthly P&I
- —
- Monthly cashflow
- —
- DSCR
- —
- Eligible?
- —
No personal income docs; deal must DSCR.
Hard money
10% down · 12.0% · 12mo
- Down + closing
- —
- Monthly P&I
- —
- Monthly cashflow
- —
- DSCR
- —
- Eligible?
- —
Short-term bridge; refi at stabilization.
Rent comps 29 comps
| Address | Beds | Baths | Sqft | Rent | $/sqft | DOM | Units | Dist |
|---|---|---|---|---|---|---|---|---|
| 715 Michigan Ct #3 Saint Cloud, FL | 2.0 | 1.0 | 784 | $1,300 | $1.66 | 23d | 1 | 0.03mi |
| 712 Michigan Ct #3 Saint Cloud, FL | 2.0 | 1.0 | 900 | $1,600 | $1.78 | 3d | 1 | 0.04mi |
| 714 Michigan Ct #4 Saint Cloud, FL | 2.0 | 1.0 | 784 | $1,350 | $1.72 | 16d | 1 | 0.04mi |
| 720 Michigan Ct #2 Saint Cloud, FL | 2.0 | 1.0 | 784 | $1,199 | $1.53 | 23d | 1 | 0.05mi |
| 720 Michigan Ct #4 Saint Cloud, FL | 2.0 | 1.0 | 784 | $1,295 | $1.65 | 23d | 1 | 0.05mi |
| 698 Michigan Ct #1 Saint Cloud, FL | 2.0 | 1.0 | 784 | $1,225 | $1.56 | 21d | 1 | 0.06mi |
| 731 Michigan Ct St Cloud, FL | 2.0 | 1.0 | 784 | $1,350 | $1.72 | 7d | 1 | 0.06mi |
| 733 Michigan Ct St Cloud, FL | 2.0 | 1.0 | 784 | $1,295 | $1.65 | 23d | 1 | 0.07mi |
| 736 Michigan Ct #4 Saint Cloud, FL | 2.0 | 1.0 | 784 | $1,300 | $1.66 | 12d | 1 | 0.07mi |
| 1400 Carolina Ave Saint Cloud, FL | 2.0 | 1.5 | 920 | $1,495 | $1.62 | 23d | 1 | 0.43mi |
| 1818 Minnesota Ave Unit B St Cloud, FL | 1.0 | 1.5 | 700 | $1,600 | $2.29 | 23d | 1 | 0.57mi |
| 1007 Florida Ave Saint Cloud, FL | 1.0–2.0 | 1.0 | 800 | $1,350 | $1.69 | 16d | 2 | 0.62mi |
| 821 Pennsylvania Ave Saint Cloud, FL | 3.0 | 1.0 | 1048 | $1,695 | $1.62 | 7d | 1 | 0.72mi |
| 1022 Oregon Ave Saint Cloud, FL | 2.0 | 2.0 | 768 | $1,700 | $2.21 | 7d | 1 | 0.73mi |
| 1871 Cactus Ct Saint Cloud, FL | 3.0 | 2.0 | 900 | $1,400 | $1.56 | 17d | 1 | 0.74mi |
| 91 10th St Unit 91 St Cloud, FL | 2.0 | 1.0 | 1000 | $1,700 | $1.70 | 23d | 1 | 0.79mi |
| 706 New York Ave Saint Cloud, FL | 1.0 | 1.0 | 750 | $1,425 | $1.90 | 23d | 1 | 0.86mi |
| 610 Carolina Ave Saint Cloud, FL | 2.0 | 1.0 | 1015 | $2,500 | $2.46 | 23d | 1 | 0.87mi |
| 616 Massachusetts Ave Unit A St Cloud, FL | 2.0 | 1.0 | 900 | $999 | $1.11 | 21d | 1 | 0.92mi |
| 616 Massachusetts Ave Unit A St Cloud, FL | 2.0 | 1.0 | 900 | $999 | $1.11 | 23d | 1 | 0.92mi |
| 1400 Dakota Ave Saint Cloud, FL | 2.0 | 1.0 | 690 | $1,650 | $2.39 | 23d | 1 | 1.02mi |
| 608 Missouri Ave Saint Cloud, FL | 2.0 | 1.0 | 956 | $1,395 | $1.46 | 3d | 1 | 1.09mi |
| 9 E 5th St St Cloud, FL | 3.0 | 2.0 | 1110 | $1,495 | $1.35 | 23d | 1 | 1.09mi |
| 2400 16th St Saint Cloud, FL | 3.0 | 2.0 | 1040 | $1,799 | $1.73 | 17d | 1 | 1.13mi |
| 517 Jersey Ave Saint Cloud, FL | 1.0 | 1.0 | 600 | $1,250 | $2.08 | 7d | 1 | 1.19mi |
| 607 Alabama Ave Saint Cloud, FL | 2.0 | 2.0 | 952 | $2,000 | $2.10 | 14d | 1 | 1.36mi |
| 1423 Montana Ave Unit 1423 St Cloud, FL | 3.0 | 2.0 | 1062 | $1,895 | $1.78 | 14d | 1 | 1.38mi |
| 1423 Montana Ave Saint Cloud, FL | 3.0 | 2.0 | 1062 | $1,895 | $1.78 | 12d | 1 | 1.38mi |
| 1404 Montana Ave Saint Cloud, FL | 2.0 | 1.5 | 1000 | $1,800 | $1.80 | 23d | 1 | 1.42mi |
HOA detail condo
- Monthly dues
- $350 · $4,200/yr
- Likely covers
- pool
- Assessments
- None detected in remarks — confirm with the listing agent.
Listing history 20 events
-
2026-06-18days on market $130,000 Active 251 DOM
-
2026-06-17days on market $130,000 Active 250 DOM
-
2026-06-16days on market $130,000 Active 249 DOM
-
2026-06-15days on market $130,000 Active 248 DOM
-
2026-06-13days on market $130,000 Active 246 DOM
-
2026-06-13days on market $130,000 Active 245 DOM
-
2026-06-10days on market $130,000 Active 242 DOM
-
2026-06-08days on market $130,000 Active 241 DOM
-
2026-06-07days on market $130,000 Active 240 DOM
-
2026-06-04days on market $130,000 Active 237 DOM
-
2026-06-03days on market $130,000 Active 236 DOM
-
2026-06-02days on market $130,000 Active 235 DOM
-
2026-06-02days on market $130,000 Active 234 DOM
-
2026-05-31days on market $130,000 Active 233 DOM
-
2026-02-25historical $1,300
-
2025-10-10$130,000 Active
-
2025-10-08$1,300
-
2007-12-13$72,500
-
1996-05-17soldstatus $40,000
-
1992-07-21soldstatus $40,000
ⓘ Source: listings_history table (triggers on properties + properties_extension) + one-shot
backfill from property_details.listing_events for pre-trigger history.
Tax reassessment forecast FL · Resets to sale price
- Current annual tax
- $1,569 · $131/mo
- Projected year-2 tax
- $1,569 · $131/mo
- Expected delta
- $0/yr ($0/mo · 0.0%)
ⓘ Screening estimate from a state-policy table — verify with the county assessor before closing.
Climate risk First Street
- Flood 1/10 Low FEMA zone X (unshaded) · 0% chance over 30 yrs
- Wildfire 4/10 Moderate
- Heat 9/10 Extreme 7 d/yr ≥108°F today · 24 d/yr by 30 yrs out
- Wind 9/10 Extreme 99% chance of damaging wind over 30 yrs
- Air quality 1/10 Low 0 unhealthy d/yr today · 0 by 30 yrs out
Nearby sold comps map
Loading sold comps map…
Walkable amenities ~0.75 mi
Loading nearby amenities…
Taxation est. · year 1
- Rental income
- $17,919
- − Mortgage interest
- −$7,282
- − Property taxes
- −$1,569
- − Insurance
- −$650
- − Repairs & maintenance
- −$1,434
- − Management
- −$1,434
- − HOA
- −$4,200
- − Depreciation
- −$3,782
- Taxable loss
- −$2,430
- Est. tax savings @ 24.0%
- +$583
- After-tax cash flow
- $140/yr
For passive investors: Depreciation is non-cash, so a rental often shows a tax loss while cash-flowing — sheltering income. Rental losses are passive: they offset passive income freely, and up to $25,000/yr can offset ordinary (W-2) income if you actively participate and your MAGI is under $100k (phasing out to $0 by $150k); unused losses carry forward. On sale, claimed depreciation is recaptured at up to 25%, and gains may owe capital-gains tax (a 1031 exchange can defer both). Figures are a year-1 estimate at your 24.0% rate — not tax advice; consult a CPA.
Schools (NCES district)
- District
- Osceola
- NCES district ID
- 1201470
- Math proficiency
- 39% ▼ -9.00%
- Reading proficiency
- 45% ▼ -4.00%
- Median HH income
- $45,528
- Composite
- 35.7/100
- National rank
- #4865
- State rank
- #60 of 73 in FL
Livability — St. Cloud
No livability data for this city. (Only ~50 U.S. cities are tracked.)
Census & demographics
- Census place
- St. Cloud, FL
- County
- Osceola County · 410,217 people
- City population
- 29,247
- Metro
- Orlando-Kissimmee-Sanford, FL
- Population (ZIP)
- 30,204
- Household income
- $67,148
- Rent vs Own
- Severe rent burden
- 1138.0
Population outlook (Osceola County) Hauer SSP2
- Today (2025)
- 447,624 people
- By 2030
- 511,823 · +14.3%
- By 2040
- 642,986 · +43.6%
- By 2050
- 774,552 · +73.0%
- By 2075
- 1,078,144 · +140.9%
- By 2100
- 1,269,660 · +183.6%
Race, ethnicity, and origin ACS 2023
- Neighborhood character
- Diverse neighborhood (Simpson 0.60)
- Race & ethnicity
- White 50% Hispanic / Latino 38% Two or more races 17% Black 4%
- Hispanic origin (detail)
- Mexican 1% Puerto Rican 21% Dominican 5%
- Common ancestry
- Romanian 3% Lithuanian 3% Russian 2%
- Foreign-born
- 12% · Canada, Jamaica
- Languages at home
- 66% English-only · Spanish 31% French/Haitian/Cajun 2% Other Indo-European 1%
Political lean MEDSL · Osceola
- 2024 margin
- Toss-up / Even · D 48.7% · R 50.2% · Other 1.1%
- 2008→2024 swing
- -21.2pp toward R · 2008: 19.7pp · 2024: -1.4pp
- All cycles
- 2024: R+1.4 2020: D+13.8 2016: D+25.0 2012: D+24.5 2008: D+19.7
Not yet ingested
- Civics
- —
Market trends
- HPI YoY
- ▼ -106.08%
- Current HPI
- 324.6715
- Rent YoY
- ▲ 1.35%
- Metro
- Orlando-Kissimmee-Sanford, FL
- State GDP YoY
- ▲ 3.28%
- F500 in state
- 36
Industry mix (Fortune 500 HQ in FL)
| Industry | F500 HQs | Revenue |
|---|---|---|
| Industrial Technology | 2 | $29B |
|
||
| Insurance | 2 | $17B |
|
||
| Retail | 1 | $60B |
|
||
| Technology Distribution | 1 | $58B |
|
||
| Homebuilding | 1 | $35B |
|
||
| Technology Manufacturing | 1 | $35B |
|
||
Price history
-96.8% since first listed6 events — show timeline
- 2026-02-25 Rental Removed $1,300 STELLARMLS
- 2025-10-10 Listed $130,000 Stellar MLS as Distributed by MLS Grid
- 2025-10-08 Listed for Rent $1,300 STELLARMLS
- 2007-12-13 Listed $72,500 Stellar MLS as Distributed by MLS Grid
- 1996-05-17 Sold (Public Records) $40,000 Public Records
- 1992-07-21 Sold (Public Records) $40,000 Public Records
Property tax history
+5.7%/yrLatest (2025): $1,569 · +0.3% YoY. Source: county tax records.
Cash-flow waterfall
monthlySold comps — $/sqft
last 12 mo · ≤1 miLoading sold comps…