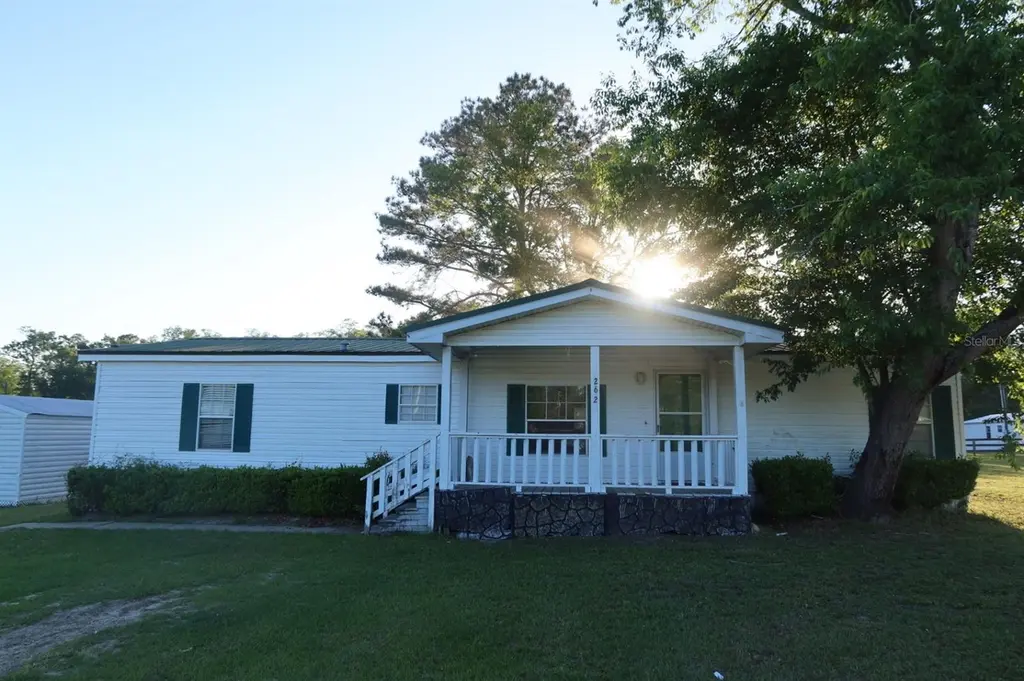
262 SW Lynnwood Ave · Lake City, FL
Flood risk 1/10 · Minimal
- FEMA flood zone
- X (unshaded)
- Chance of flooding over 30 yrs
- 0.0%
- Est. flood insurance / yr
- $507 – $1,088
Fire risk 7/10 · Major
- Est. fire insurance / yr
- $947 – $1,759
Heat risk 8/10 · Major
- Hot days now (above 107°F)
- 7 days/yr
- Hot days in 30 yrs
- 21 days/yr
Wind risk 9/10 · Severe
- Chance of severe wind over 30 yrs
- 99.0%
Air-quality risk 5/10 · Moderate
- Unhealthy air days now
- 9 days/yr
- Unhealthy air days in 30 yrs
- 10 days/yr
Risk factors via First Street. Map © Google.
Why this score? — see what drove the B+ grade
The composite is a weighted blend of 9 inputs, each scored 0–100. Each bar is that input's sub-score; the figure is the points it added to the 100-point composite (weight × sub-score).
- Cash flow +23.9/30.0
- ARV discount +15.0/15.0
- Appreciation +10.0/10.0
- DSCR +7.7/10.0
- 1% rule +5.4/10.0
- Schools +4.5/10.0
- Livability +3.7/5.0
- Rent growth +2.5/5.0
- Condition / age +2.5/5.0
$179,900
🖨 Deal sheet 📄 Offer letter ✓ Due diligence
Listing remarks
Discover the perfect blend of space, privacy, and convenience with this rare larger lot in beautiful North Florida! Nestled just minutes from town, this property offers the best of both worlds, peaceful country living with easy access to shopping, dining, schools, and everyday essentials. Situated on an oversized lot, this well-maintained 1997 doublewide features 3 bedrooms and 2 full bathrooms with a comfortable, open layout designed for everyday living. The spacious yard provides plenty of room for outdoor activities, gardening, pets, or future additions, making it ideal for anyone looking to spread out and enjoy the Florida lifestyle. Whether you're looking for a primary residence, renta
Key facts
- 0.85 acre lot
- Built 1997
- Listed 62 days
Property features AI
Finance
- Other: Property is homesteaded
- HOA & community: No HOA/association
Exterior
- Parking: No parking details provided
- Utilities: No public water source listed; Private sewer; Other utilities
- Home design: Residential manufactured home (double wide); One story; Faces east; Entry on one level
- Construction: Vinyl siding; Metal roof; Crawlspace foundation; Built as double wide manufactured home
- Exterior features: Storage shed(s); Chain link fencing; Cleared lot; Asphalt road access
Interior
- Kitchen: Cooktop; Dishwasher; Microwave; Refrigerator
- Bedrooms: 3 bedrooms
- Flooring: Laminate
- Bathrooms: 2 full bathrooms
- Heating & cooling: No heating specified; Central air conditioning
- Interior features: Open floorplan; Wood-burning fireplace
- Laundry & utility: Inside laundry
Neighborhood map
What this means for you Summary
Snapshot
- This is a 3-bed/2.0-bath manufactured listed at $180k.
Deal economics
- At list price, monthly cash flow is $350 ($4k/yr) — positive.
- The deal already cash-flows at list — no discount required.
- Meets the 1% rule at list price ($2k rent vs $180k).
- Recommended offer: $169k (6.0% below list) — sets the bar for market timing.
- Cap rate 8.6% vs local median 3.7% in Lake City — top-decile yield for the area; either an underpriced asset or a hidden risk that comps aren't pricing in. Stress-test before assuming the spread holds.
Location & tenants
- Location reads 73/100 on livability (#304 in FL) — a middle-class / working-renter tenant base. Strengths: cost of living A+, housing A+, health & safety A+; Watch: amenities C-, commute F, employment F.
- Columbia (town): math 53% / reading 54% proficiency, ranked #25 of 73 in FL (top 34%) — acceptable for families but not a draw, mixed tenant base, ~2y average lease.
- Market conditions: 206 active listings in the ZIP; 178 units permitted in Columbia County in 2024 (0 in 5+ unit buildings).
Forward outlook
- In year one you build about $19k of equity ($1k loan paydown + $18k appreciation (10.0% local appreciation)).
- Columbia County population projected to shrink 7% by 2050 — rents likely to lag national; underwrite the cash flow, not the appreciation.
- At projected returns (10.0% appreciation + 3.0% rent growth), your $50k cash investment doubles in ~3 years — after that, you're playing with house money.
- By year 2, paydown + projected appreciation supports a ~$31k cash-out refi (75% LTV) — recoverable capital for the next deal without selling this one.
Negotiation context
- It's been on market 63 days — a 6% lower offer ($169k) is reasonable based on typical stale-listing flexibility.
Risks & watch-outs
- Climate carrying-cost: severe wind risk, 99% chance of damaging wind over 30y; major wildfire risk; extreme-heat days projected 7→21/yr by 2055 (HVAC capex compounding) — expect insurance premiums to compound above CPI over the hold.
Questions for the listing agent
- It's been on market 63 days. Have you received any prior offers? Is the seller open to a 6% concession, seller financing, or rate buy-down credit?
- Why hasn't it sold? Are there any deal-killer items the seller is aware of (foundation, flood, title, zoning, code violations)?
- Is there a deadline driving the sale (1031 exchange, divorce, estate, relocation)? That informs how much negotiation room exists.
- Schools are B-rated — typically a magnet for longer-tenancy family renters. What's the average tenant stay here, and is there a school-zone premium baked into asking?
- What's the average days-on-market for RENTAL listings here right now (not sales)? A rising rental-DOM trend means longer vacancies and softer asking-rent achievability than the comps imply.
- What's the recent tenant-quality profile in this submarket — average credit score on applications, eviction rate, late-payment / NSF rate, and stable-employment percentage? A property-management company in the area should have these aggregated.
- How much new for-sale + rental construction is in the pipeline within 1–3 miles? Heavy new supply typically softens prices + rents 12–24 months out; constrained supply supports both.
Investment metrics
- 1% rule
- 1.04% ✓
- Cap rate
- 8.63%
- Cash-on-cash
- 8.34%
- DSCR
- 1.37
- GRM
- 8.0
CMA / ARV
- ARV (on-the-fly)
- $244,944
- Comps found
- 2
Show comp detail 2 sales within ~0.75 mi
| Address | Dist | Beds/Ba | Sqft | Sold | Price | $/sf | Match |
|---|---|---|---|---|---|---|---|
| 768 SW Troy St | 0.66mi | 3/2.0 | 1,450 (-4%) | 3mo | $235,000 | $162 | 60 |
| 306 SW Sunset Way | 0.57mi | 3/2.0 | 1,296 (-14%) | 9mo | $60,000 | $46 | 42 |
Match score weights: distance 35% · size 25% · config 20% · recency 20%. Top-matched comps best support the ARV.
Projected returns pro-forma
10.0% appreciation · 3.0% rent growth · sell at horizon
- IRR
- 30.3%
- Equity multiple
- 3.39×
- Total profit
- $120,235
- Equity at exit
- $162,068
- IRR
- 26.3%
- Equity multiple
- 7.68×
- Total profit
- $336,459
- Equity at exit
- $349,506
Cash invested: $50,372 (down + closing). Projections, not guarantees.
Landlord ↔ Tenant lean methodology
- Overall (STATE)
- 87 Strongly Landlord-Friendly
- State Florida
- 87 Strongly Landlord-Friendly · R+3
- County
- — inherits STATE
- City
- — inherits STATE
ZIP-level market 32024
- Home prices YoY
- 7.6%
- Active inventory
- 206
- Price-to-rent
- 8.0×
Monthly cashflow live
- Estimated rent
- $1,876 medium interval (Pro) →
- Mortgage (P&I)
- −$943
- Tax from tax record
- −$114 /mo · $1,363/yr
- Insurance
- −$75
- HOA
- −$0
- Vacancy / Maint / Mgmt
- −$394
- Net cashflow
- $350
Break-even live
UW: 25.0% down · 7.5% · 30yr · 1.5% tax · 5.0% vac · 8.0% maint · 8.0% mgmt
Financing live
Cash to close
- Down payment
- $44,975
- Closing costs
- $5,397
- Reserves months
- —
- Total cash needed
- —
Loan-product check · same deal, 3 products live
Conventional
25% down · 7.5% · 30yr
- Down + closing
- —
- Monthly P&I
- —
- Monthly cashflow
- —
- DSCR
- —
- Eligible?
- —
Personal DTI + credit; lowest rate.
DSCR
20% down · 8.5% · 30yr
- Down + closing
- —
- Monthly P&I
- —
- Monthly cashflow
- —
- DSCR
- —
- Eligible?
- —
No personal income docs; deal must DSCR.
Hard money
10% down · 12.0% · 12mo
- Down + closing
- —
- Monthly P&I
- —
- Monthly cashflow
- —
- DSCR
- —
- Eligible?
- —
Short-term bridge; refi at stabilization.
Listing history 17 events
-
2026-06-19days on market $179,900 Active 63 DOM
-
2026-06-18days on market $179,900 Active 62 DOM
-
2026-06-17days on market $179,900 Active 61 DOM
-
2026-06-16days on market $179,900 Active 60 DOM
-
2026-06-15days on market $179,900 Active 59 DOM
-
2026-06-14days on market $179,900 Active 57 DOM
-
2026-06-12days on market $179,900 Active 56 DOM
-
2026-06-09days on market $179,900 Active 53 DOM
-
2026-06-08days on market $179,900 Active 52 DOM
-
2026-06-07days on market $179,900 Active 51 DOM
-
2026-06-05days on market $179,900 Active 48 DOM
-
2026-06-03days on market $179,900 Active 47 DOM
-
2026-06-02days on market $179,900 Active 46 DOM
-
2026-06-01days on market $179,900 Active 45 DOM
-
2026-05-31days on market $179,900 Active 44 DOM
-
2026-05-30days on market $179,900 Active 43 DOM
-
2026-04-17$184,900 Active
ⓘ Source: listings_history table (triggers on properties + properties_extension) + one-shot
backfill from property_details.listing_events for pre-trigger history.
Tax reassessment forecast FL · Resets to sale price
- Current annual tax
- $1,363 · $114/mo
- Projected year-2 tax
- $1,493 · $124/mo
- Expected delta
- +$130/yr (+$11/mo · 9.5%)
ⓘ Screening estimate from a state-policy table — verify with the county assessor before closing.
Climate risk First Street
- Flood 1/10 Low FEMA zone X (unshaded) · 0% chance over 30 yrs
- Wildfire 7/10 Severe
- Heat 8/10 Severe 7 d/yr ≥107°F today · 21 d/yr by 30 yrs out
- Wind 9/10 Extreme 99% chance of damaging wind over 30 yrs
- Air quality 5/10 Major 9 unhealthy d/yr today · 10 by 30 yrs out
Nearby sold comps map
Loading sold comps map…
Walkable amenities ~0.75 mi
Loading nearby amenities…
Taxation est. · year 1
- Rental income
- $22,512
- − Mortgage interest
- −$10,077
- − Property taxes
- −$1,363
- − Insurance
- −$900
- − Repairs & maintenance
- −$1,801
- − Management
- −$1,801
- − Depreciation
- −$5,233
- Taxable income
- $1,337
- Est. tax owed @ 24.0%
- −$321
- After-tax cash flow
- $3,880/yr
For passive investors: Depreciation is non-cash, so a rental often shows a tax loss while cash-flowing — sheltering income. Rental losses are passive: they offset passive income freely, and up to $25,000/yr can offset ordinary (W-2) income if you actively participate and your MAGI is under $100k (phasing out to $0 by $150k); unused losses carry forward. On sale, claimed depreciation is recaptured at up to 25%, and gains may owe capital-gains tax (a 1031 exchange can defer both). Figures are a year-1 estimate at your 24.0% rate — not tax advice; consult a CPA.
Schools (NCES district)
- District
- Columbia
- NCES district ID
- 1200360
- Math proficiency
- 53% ▼ -10.00%
- Reading proficiency
- 54% ▼ -3.00%
- Median HH income
- $40,053
- Composite
- 44.74/100
- National rank
- #2750
- State rank
- #25 of 73 in FL
Livability — Lake City
- Score
- 73/100
- State rank
- #304
- US rank
- #5154
Category grades
Schools grade is shown separately in the Schools card above.
Census & demographics
- City population
- 40,507
- Population (ZIP)
- 20,644
Population outlook (Columbia County) Hauer SSP2
- Today (2025)
- 68,129 people
- By 2030
- 67,501 · -0.9%
- By 2040
- 65,465 · -3.9%
- By 2050
- 63,058 · -7.4%
- By 2075
- 56,291 · -17.4%
- By 2100
- 45,243 · -33.6%
Race, ethnicity, and origin ACS 2023
- Neighborhood character
- Predominantly White (78%)
- Race & ethnicity
- White 78% Hispanic / Latino 10% Two or more races 7% Black 6% Asian 2%
- Hispanic origin (detail)
- Mexican 2% Puerto Rican 3%
- Common ancestry
- Italian 2% Portuguese 1% Lithuanian 1%
- Foreign-born
- 5% · Canada, Jamaica
- Languages at home
- 91% English-only · Spanish 8% Vietnamese 1%
Political lean MEDSL · Columbia
- 2024 margin
- Solid R (+50.2) · D 24.6% · R 74.7%
- 2008→2024 swing
- -16.4pp toward R · 2008: -33.8pp · 2024: -50.2pp
- All cycles
- 2024: R+50.2 2020: R+45.2 2016: R+44.5 2012: R+36.7 2008: R+33.8
Not yet ingested
- Civics
- —
Market trends
- HPI YoY
- ▲ 19.05%
- Current HPI
- 269.4659
- Rent YoY
- —
- Metro
- —
- State GDP YoY
- ▲ 3.28%
- F500 in state
- 36
Industry mix (Fortune 500 HQ in FL)
| Industry | F500 HQs | Revenue |
|---|---|---|
| Industrial Technology | 2 | $29B |
|
||
| Insurance | 2 | $17B |
|
||
| Retail | 1 | $60B |
|
||
| Technology Distribution | 1 | $58B |
|
||
| Homebuilding | 1 | $35B |
|
||
| Technology Manufacturing | 1 | $35B |
|
||
Price history
1 event — show timeline
- 2026-04-17 Listed $184,900 Stellar MLS as Distributed by MLS Grid
Property tax history
+2.5%/yrLatest (2025): $1,363 · +4.1% YoY. Source: county tax records.
Cash-flow waterfall
monthlySold comps — $/sqft
last 12 mo · ≤1 miLoading sold comps…