 Multi-family
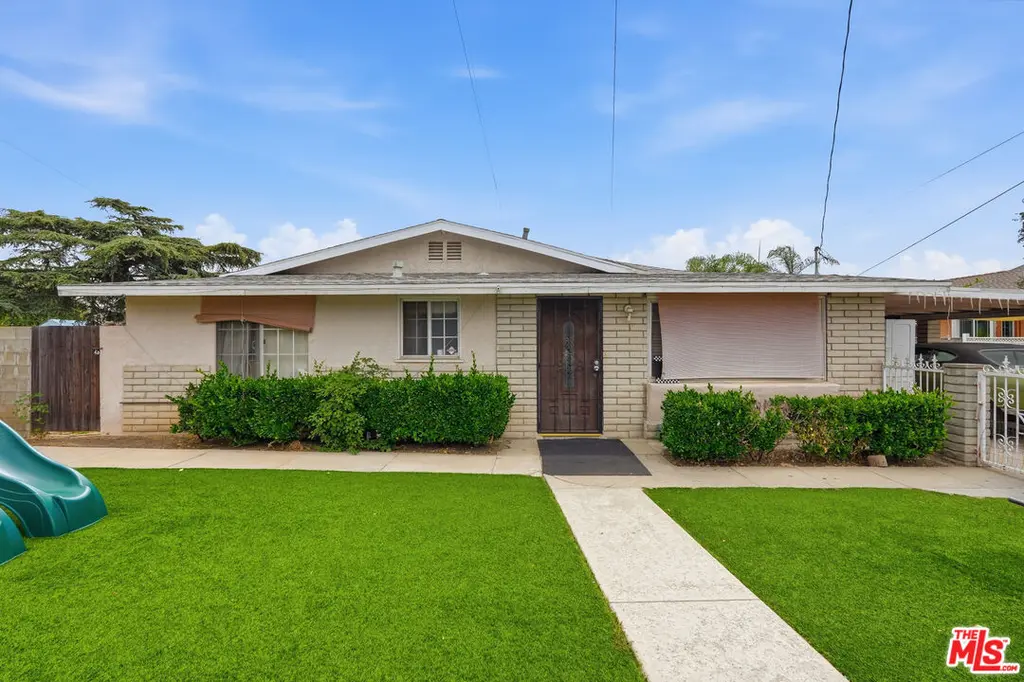
2228 Park Rose Ave · Duarte, CA
Flood risk 1/10 · Minimal
- FEMA flood zone
- X (unshaded)
- Chance of flooding over 30 yrs
- 0.0%
- Est. flood insurance / yr
- $507 – $1,088
Fire risk 1/10 · Minimal
- Est. fire insurance / yr
- $659 – $1,223
Heat risk 7/10 · Major
- Hot days now (above 101°F)
- 7 days/yr
- Hot days in 30 yrs
- 21 days/yr
Wind risk 1/10 · Minimal
- Chance of severe wind over 30 yrs
- —
Air-quality risk 7/10 · Major
- Unhealthy air days now
- 12 days/yr
- Unhealthy air days in 30 yrs
- 14 days/yr
Risk factors via First Street. Map © Google.
Why this score? — see what drove the C+ grade
The composite is a weighted blend of 9 inputs, each scored 0–100. Each bar is that input's sub-score; the figure is the points it added to the 100-point composite (weight × sub-score).
- Cash flow +26.6/30.0
- DSCR +9.1/10.0
- ARV discount +7.5/15.0
- 1% rule +6.7/10.0
- Livability +3.8/5.0
- Schools +3.4/10.0
- Condition / age +2.5/5.0
- Rent growth +1.9/5.0
- Appreciation +0.0/10.0
$825,000
🖨 Deal sheet 📄 Offer letter ✓ Due diligence
Multi-family units
County records classify this as Multi-Family (2-4 Unit). Listing-text estimate: 1 unit. estimate disagrees with records
Listing remarks MLS
Two beautifully remodeled homes on a huge lot (13,007) and a third guest unit in the middle. All new interior and exterior painting, new carpeting and tile flooring. Great opportunity to live in one and rent the other. Gated front yard and lush fruit trees in the back. Priced to sell fast.
Key facts
- Expansive lot
- Income potential
- Potential lot split
Tags
Property features AI
Finance
- Other: Unit 1 actual rent: $2,900 (projected $4,500); Unit 2 actual rent: $1,750 (projected $2,900)
- Financial info: Gross income reported as $55,800; Gross operating income reported as $54,126; Net operating income reported as $36,465; Total annual expenses reported as $17,661; Insurance expense reported as $3,000; Maintenance expense reported as $2,706; Tax expense reported as $10,315; Trash expense reported as $840; Licenses expense reported as $300; Pest expense reported as $500; Gross rent multiplier reported as 14.8; Scheduled rents listed as actual
- HOA & community: Two units in the complex
Exterior
- Parking: Total of 8 parking spaces; 1 covered parking space; 7 open parking spaces; Driveway access
- Utilities: Water heaters present
- Home design: Residential income property; Detached unit types; Two buildings; One-level structures
- Exterior features: Guest house on the property; Lot zoning: DUR16500*; Lot dimensions approximately 66 x 210
Interior
- Bedrooms: One unit with 3 bedrooms; One unit with 2 bedrooms
- Bathrooms: One unit with 2 bathrooms; One unit with 1 bathroom
- Heating & cooling: Central heating; Wall heating; Central air conditioning; Wall/window air conditioning units
- Interior features: Rent control applies; Tenant rights for possession
- Laundry & utility: Property has water heaters
Neighborhood map
What this means for you Summary
Snapshot
- This is a 1-bed/1.0-bath multifamily listed at $825k.
Deal economics
- At list price, monthly cash flow is $2k ($26k/yr) — positive.
- The deal already cash-flows at list — no discount required.
- Meets the 1% rule at list price ($10k rent vs $825k).
- Recommended offer: $813k (1.5% below list) — sets the bar for market timing.
- Cap rate 9.5% vs local median 3.0% in Duarte — top-decile yield for the area; either an underpriced asset or a hidden risk that comps aren't pricing in. Stress-test before assuming the spread holds.
Location & tenants
- Location reads 76/100 on livability (#97 in CA, #3,529 nationally) — a middle-class / working-renter tenant base. Strengths: amenities A+, commute A+, employment A+; Watch: health & safety D, cost of living F.
- Duarte Unified (suburban): math 31% / reading 44% proficiency, ranked #241 of 517 in CA (top 47%) — families likely to look elsewhere, expect single-tenant / working-renter base with shorter leases.
- Market conditions: Rents soft (-2.5%/yr); 37 active listings in the ZIP; 9 comparable units currently listed for rent nearby; rentals leasing fast (median 2d on market — plan ~1-2 weeks tenant-placement turnaround); solid renter incomes; 19,697 units permitted in Los Angeles County in 2024 (9,426 in 5+ unit buildings).
- At $9,651/mo this rent would consume 113% of the median local household income ($103k/yr) (locally 844% of renters already pay >50% of income on rent) — very limited rent-growth headroom before tenants either downsize or default.
Forward outlook
- Local home prices are declining (-3.0%/yr); year-one equity from $6k of loan paydown is wiped out by about $25k of value loss. Plan a longer hold.
- Los Angeles County population projected at +9% by 2050 — modest demand growth; plan on rents tracking national, not racing it.
Negotiation context
- It's been on market 17 days — a 2% lower offer ($813k) is reasonable based on typical stale-listing flexibility.
- 2 sale attempts since 13y ago with the ask held roughly flat each time — persistent listings suggest the price (not the market) is what's stuck; bring a comps-based counter.
- Current owner paid $510k; list at $825k implies a 62% gain — meaningful room to come down on a strong offer.
Risks & watch-outs
- Watch-outs: built in 1935 — expect roof / HVAC / electrical / plumbing capex.
- Climate carrying-cost: extreme-heat days projected 7→21/yr by 2055 (HVAC capex compounding) — expect insurance premiums to compound above CPI over the hold.
Questions for the listing agent
- Built in 1935 — when were the roof, HVAC, electrical panel, plumbing, and water heater last replaced?
- Is there a deadline driving the sale (1031 exchange, divorce, estate, relocation)? That informs how much negotiation room exists.
- What's the average days-on-market for RENTAL listings here right now (not sales)? A rising rental-DOM trend means longer vacancies and softer asking-rent achievability than the comps imply.
- What's the recent tenant-quality profile in this submarket — average credit score on applications, eviction rate, late-payment / NSF rate, and stable-employment percentage? A property-management company in the area should have these aggregated.
- How much new apartment / multifamily construction is in the pipeline within 1–3 miles? Heavy new supply (>2% of stock underway) typically softens rents 12–24 months out; light construction supports rent growth.
Investment metrics
- 1% rule
- 1.17% ✓
- Cap rate
- 9.49%
- Cash-on-cash
- 11.43%
- DSCR
- 1.51
- GRM
- 7.1
CMA / ARV
No comps found within radius.
Projected returns pro-forma
-3.0% appreciation · 0.0% rent growth · sell at horizon
- IRR
- -2.6%
- Equity multiple
- 0.91×
- Total profit
- $-21,905
- Equity at exit
- $123,010
- IRR
- 3.6%
- Equity multiple
- 1.22×
- Total profit
- $51,908
- Equity at exit
- $71,331
Cash invested: $231,000 (down + closing). Projections, not guarantees.
Landlord ↔ Tenant lean methodology
- Overall (STATE)
- 18 Strongly Tenant-Friendly
- State California
- 18 Strongly Tenant-Friendly · D+13
- County
- — inherits STATE
- City
- — inherits STATE
ZIP-level market 91010
- Rents YoY
- -2.5%
- Active inventory
- 37
- Price-to-rent
- 19.3×
Monthly cashflow live
- Estimated rent
- $9,651 high interval (Pro) →
- Mortgage (P&I)
- −$4,326
- Tax from tax record
- −$755 /mo · $9,056/yr
- Insurance
- −$344
- HOA
- −$0
- Vacancy / Maint / Mgmt
- −$2,027
- Net cashflow
- $2,200
Break-even live
3-unit breakdown (identical units grouped — click to expand)
| Units | Beds | Baths | Est. rent |
|---|---|---|---|
| 1× unit | 3 | 2 | $3,564 |
| 2× units | 2 | 1 | $6,086 |
| #2 | 2 | 1 | $3,043 |
| #3 | 2 | 1 | $3,043 |
| Total (3 units) | $9,651 | ||
UW: 25.0% down · 7.5% · 30yr · 1.5% tax · 5.0% vac · 8.0% maint · 8.0% mgmt
Financing live
Cash to close
- Down payment
- $206,250
- Closing costs
- $24,750
- Reserves months
- —
- Total cash needed
- —
Loan-product check · same deal, 3 products live
Conventional
25% down · 7.5% · 30yr
- Down + closing
- —
- Monthly P&I
- —
- Monthly cashflow
- —
- DSCR
- —
- Eligible?
- —
Personal DTI + credit; lowest rate.
DSCR
20% down · 8.5% · 30yr
- Down + closing
- —
- Monthly P&I
- —
- Monthly cashflow
- —
- DSCR
- —
- Eligible?
- —
No personal income docs; deal must DSCR.
Hard money
10% down · 12.0% · 12mo
- Down + closing
- —
- Monthly P&I
- —
- Monthly cashflow
- —
- DSCR
- —
- Eligible?
- —
Short-term bridge; refi at stabilization.
Rent comps 9 comps
| Address | Beds | Baths | Sqft | Rent | $/sqft | DOM | Units | Dist |
|---|---|---|---|---|---|---|---|---|
| 226 E Atara St Monrovia, CA | 1.0 | 1.0 | 650 | $2,135 | $3.28 | 2d | 1 | 0.80mi |
| 2425 S Myrtle Ave Unit A Monrovia, CA | 1.0 | 1.0 | 500 | $1,980 | $3.96 | 24d | 1 | 0.85mi |
| 1960 Peck Rd Unit 4 Monrovia, CA | 1.0 | 1.0 | 500 | $1,895 | $3.79 | 43d | 1 | 1.01mi |
| 1608 Cotter Ave Duarte, CA | 1.0 | 1.0 | 650 | $3,100 | $4.77 | 43d | 1 | 1.11mi |
| 225 W Duarte Rd Monrovia, CA | 2.0 | 1.0–3.0 | 1537 | $5,248 | $3.41 | 1d | 109 | 1.18mi |
| 1750 Fasana Rd Duarte, CA | 4.0 | 1.0–4.0 | 1480 | $3,177 | $2.15 | 1d | 37 | 1.29mi |
| 1700 Fasana Rd Duarte, CA | 3.0 | 1.0–3.0 | 851 | $2,878 | $3.38 | 1d | 51 | 1.29mi |
| 1625 S Magnolia Ave Monrovia, CA | 1.0–3.0 | 1.0–2.0 | 1094 | $2,512 | $2.30 | 1d | 48 | 1.32mi |
| 1214 S Primrose Ave Monrovia, CA | 1.0 | 1.0 | 650 | $2,300 | $3.54 | 43d | 1 | 1.40mi |
Listing history 13 events
-
2026-06-18days on market $825,000 Active 17 DOM
-
2026-06-17days on market $825,000 Active 16 DOM
-
2026-06-16days on market $825,000 Active 15 DOM
-
2026-06-15days on market $825,000 Active 14 DOM
-
2026-06-13days on market $825,000 Active 12 DOM
-
2026-06-13days on market $825,000 Active 11 DOM
-
2026-06-09days on market $825,000 Active 8 DOM
-
2026-06-08days on market $825,000 Active 7 DOM
-
2026-06-07days on market $825,000 Active 6 DOM
-
2026-06-04days on market $825,000 Active 3 DOM
-
2026-06-03days on market $825,000 Active 2 DOM
-
2026-06-02remarks 699-char remark
-
2026-06-02$825,000 Active 1 DOM
ⓘ Source: listings_history table (triggers on properties + properties_extension) + one-shot
backfill from property_details.listing_events for pre-trigger history.
Tax reassessment forecast CA · Resets to sale price
- Current annual tax
- $9,056 · $755/mo
- Projected year-2 tax
- $9,056 · $755/mo
- Expected delta
- $0/yr ($0/mo · 0.0%)
ⓘ Screening estimate from a state-policy table — verify with the county assessor before closing.
Climate risk First Street
- Flood 1/10 Low FEMA zone X (unshaded) · 0% chance over 30 yrs
- Wildfire 1/10 Low
- Heat 7/10 Severe 7 d/yr ≥101°F today · 21 d/yr by 30 yrs out
- Wind 1/10 Low
- Air quality 7/10 Severe 12 unhealthy d/yr today · 14 by 30 yrs out
Nearby sold comps map
Loading sold comps map…
Walkable amenities ~0.75 mi
Loading nearby amenities…
Taxation est. · year 1
- Rental income
- $115,812
- − Mortgage interest
- −$46,213
- − Property taxes
- −$9,056
- − Insurance
- −$4,125
- − Repairs & maintenance
- −$9,265
- − Management
- −$9,265
- − Depreciation
- −$24,000
- Taxable income
- $13,889
- Est. tax owed @ 24.0%
- −$3,333
- After-tax cash flow
- $23,061/yr
For passive investors: Depreciation is non-cash, so a rental often shows a tax loss while cash-flowing — sheltering income. Rental losses are passive: they offset passive income freely, and up to $25,000/yr can offset ordinary (W-2) income if you actively participate and your MAGI is under $100k (phasing out to $0 by $150k); unused losses carry forward. On sale, claimed depreciation is recaptured at up to 25%, and gains may owe capital-gains tax (a 1031 exchange can defer both). Figures are a year-1 estimate at your 24.0% rate — not tax advice; consult a CPA.
Schools (NCES district)
- District
- Duarte Unified
- NCES district ID
- 0611520
- Math proficiency
- 31% ▼ -10.00%
- Reading proficiency
- 44% ▼ -11.00%
- Median HH income
- $63,411
- Composite
- 33.66/100
- National rank
- #5392
- State rank
- #241 of 517 in CA
Livability — Duarte
- Score
- 76/100
- State rank
- #97
- US rank
- #3529
Category grades
Schools grade is shown separately in the Schools card above.
Census & demographics
- Census place
- Duarte, CA
- County
- Los Angeles County · 9,444,647 people
- City population
- 27,589
- Metro
- Los Angeles-Long Beach-Anaheim, CA
- Population (ZIP)
- 27,589
- Household income
- $102,705
- Rent vs Own
- Severe rent burden
- 844.0
Population outlook (Los Angeles County) Hauer SSP2
- Today (2025)
- 10,940,515 people
- By 2030
- 11,256,481 · +2.9%
- By 2040
- 11,729,929 · +7.2%
- By 2050
- 11,948,407 · +9.2%
- By 2075
- 11,818,114 · +8.0%
- By 2100
- 10,842,928 · -0.9%
Race, ethnicity, and origin ACS 2023
- Neighborhood character
- Diverse neighborhood (Simpson 0.62)
- Race & ethnicity
- Hispanic / Latino 56% Two or more races 21% White 20% Asian 16% Black 5% Native American 1%
- Hispanic origin (detail)
- Mexican 42%
- Common ancestry
- Lithuanian 2% Slovak 1% Romanian 1%
- Foreign-born
- 33% · Canada, China, South Korea
- Languages at home
- 42% English-only · Spanish 42% Chinese 6% Tagalog/Filipino 4%
Political lean MEDSL · Los Angeles
- 2024 margin
- Solid D (+32.9) · D 64.8% · R 31.9% · Other 3.3%
- 2008→2024 swing
- -7.4pp toward R · 2008: 40.4pp · 2024: 32.9pp
- All cycles
- 2024: D+32.9 2020: D+44.2 2016: D+48.0 2012: D+40.0 2008: D+40.4
Not yet ingested
- Civics
- —
Market trends
- HPI YoY
- ▼ -790.18%
- Current HPI
- 381.0753
- Rent YoY
- ▼ -2.46%
- Metro
- Los Angeles-Long Beach-Anaheim, CA
- State GDP YoY
- ▲ 3.21%
- F500 in state
- 116
Industry mix (Fortune 500 HQ in CA)
| Industry | F500 HQs | Revenue |
|---|---|---|
| Technology | 27 | $1,492B |
|
||
| Financial Services | 3 | $174B |
|
||
| Retail | 3 | $44B |
|
||
| Insurance | 3 | $26B |
|
||
| Media / Entertainment | 2 | $115B |
|
||
| Pharmaceuticals / Biotech | 2 | $62B |
|
||
Price history
+5400.0% since first listed5 events — show timeline
- 2026-06-01 Listed $825,000 TheMLS
- 2013-07-25 Sold (Public Records) $510,000 Public Records
- 2013-07-25 Sold (MLS) $510,000 TheMLS
- 2013-07-15 Listed $499,000 TheMLS
- 1969-08-07 Sold (Public Records) $15,000 Public Records
Property tax history
+12.4%/yrLatest (2025): $9,056 · +3.3% YoY. Source: county tax records.
Cash-flow waterfall
monthlySold comps — $/sqft
last 12 mo · ≤1 miLoading sold comps…