14578 Bass Dr #18 · Mountain Gate, CA
Flood risk 1/10 · Minimal
- FEMA flood zone
- X (unshaded)
- Chance of flooding over 30 yrs
- 0.0%
- Est. flood insurance / yr
- $507 – $1,088
Fire risk 8/10 · Major
- Est. fire insurance / yr
- $659 – $1,223
Heat risk 8/10 · Major
- Hot days now (above 105°F)
- 7 days/yr
- Hot days in 30 yrs
- 17 days/yr
Wind risk 1/10 · Minimal
- Chance of severe wind over 30 yrs
- —
Air-quality risk 10/10 · Severe
- Unhealthy air days now
- 45 days/yr
- Unhealthy air days in 30 yrs
- 48 days/yr
Risk factors via First Street. Map © Google.
Why this score? — see what drove the B grade
The composite is a weighted blend of 9 inputs, each scored 0–100. Each bar is that input's sub-score; the figure is the points it added to the 100-point composite (weight × sub-score).
- Cash flow +30.0/30.0
- 1% rule +10.0/10.0
- DSCR +10.0/10.0
- ARV discount +9.0/15.0
- Rent growth +4.0/5.0
- Schools +2.5/10.0
- Condition / age +2.5/5.0
- Livability +2.4/5.0
- Appreciation +0.0/10.0
$88,500
🖨 Deal sheet 📄 Offer letter ✓ Due diligence
Listing remarks MLS
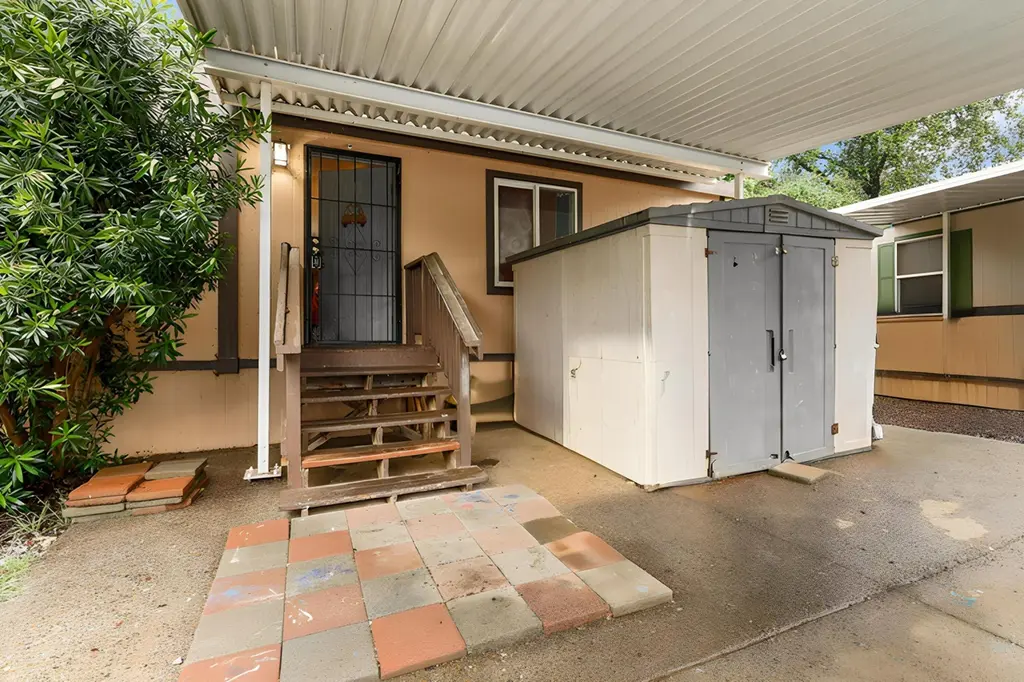
Affordable and well-kept mobile home in Mountain Gate! This home offers a comfortable layout with plenty of natural light, a functional kitchen, and cozy living spaces. Great opportunity to own in a desirable community!
Key facts
- Parking
- Listed 69 days
Neighborhood map
What this means for you Summary
Snapshot
- This is a 3-bed/2.0-bath manufactured listed at $88k.
Deal economics
- At list price, monthly cash flow is $1k ($14k/yr) — positive.
- The deal already cash-flows at list — no discount required.
- Meets the 1% rule at list price ($2k rent vs $88k).
- Recommended offer: $83k (6.0% below list) — sets the bar for market timing.
Location & tenants
- Location reads 47/100 on livability (#1,255 in CA) — a working-class tenant base; expect higher turnover. Watch: cost of living D+, schools F, crime F.
- Gateway Unified (suburban): math 25% / reading 35% proficiency, ranked #355 of 517 in CA (top 69%) — families likely to look elsewhere, expect single-tenant / working-renter base with shorter leases.
- Market conditions: Rents rising fast (+6.0%/yr); 391 active listings in the ZIP; 246 units permitted in Shasta County in 2024 (0 in 5+ unit buildings).
- This rent runs 36% of the median local income ($72k/yr) — at the standard rent-burdened threshold; future hikes will face affordability resistance.
Forward outlook
- Local home prices are declining (-3.0%/yr); year-one equity from $612 of loan paydown is wiped out by about $3k of value loss. Plan a longer hold.
- Shasta County population projected to shrink 9% by 2050 — rents likely to lag national; underwrite the cash flow, not the appreciation.
- At projected returns (-3.0% appreciation + 6.0% rent growth), your $25k cash investment doubles in ~2 years — after that, you're playing with house money.
Negotiation context
- It's been on market 70 days — a 6% lower offer ($83k) is reasonable based on typical stale-listing flexibility.
- 3 sale attempts since 5y ago; this cycle's ask has dropped $10k (11%) from the opening price — seller is motivated, your offer sets the floor, not the list.
- Current owner paid $77k; 15% above their basis — modest negotiation headroom, anchor on the comps not their cost.
Risks & watch-outs
- Climate carrying-cost: severe wildfire risk; extreme-heat days projected 7→17/yr by 2055 (HVAC capex compounding) — expect insurance premiums to compound above CPI over the hold.
Questions for the listing agent
- It's been on market 70 days. Have you received any prior offers? Is the seller open to a 6% concession, seller financing, or rate buy-down credit?
- Why hasn't it sold? Are there any deal-killer items the seller is aware of (foundation, flood, title, zoning, code violations)?
- Is there a deadline driving the sale (1031 exchange, divorce, estate, relocation)? That informs how much negotiation room exists.
- Schools are F-rated, which usually means shorter tenancies and higher turnover. Who's the typical renter profile here, and what's been the actual vacancy rate?
- Crime grade is F in this area — have there been break-ins, vandalism, or insurance claims at this property in the last 3 years? What carrier currently insures it and at what premium?
- What's the average days-on-market for RENTAL listings here right now (not sales)? A rising rental-DOM trend means longer vacancies and softer asking-rent achievability than the comps imply.
- What's the recent tenant-quality profile in this submarket — average credit score on applications, eviction rate, late-payment / NSF rate, and stable-employment percentage? A property-management company in the area should have these aggregated.
- How much new for-sale + rental construction is in the pipeline within 1–3 miles? Heavy new supply typically softens prices + rents 12–24 months out; constrained supply supports both.
Investment metrics
- 1% rule
- 2.44% ✓
- Cap rate
- 22.36%
- Cash-on-cash
- 57.38%
- DSCR
- 3.55
- GRM
- 3.4
CMA / ARV
- ARV (median comp)
- $91,631
- List price
- $88,500
- Delta
- -3.42%
- Verdict
- FAIR
- Comps
- 20 within 1.0 mi
Show comp detail 8 sales within ~0.75 mi
| Address | Dist | Beds/Ba | Sqft | Sold | Price | $/sf | Match |
|---|---|---|---|---|---|---|---|
| 14578 Bass Dr #7 | 0.00mi | 3/2.0 | 1,180 (-5%) | 3mo | $55,000 | $47 | 89 |
| 14578 Bass Dr #14 | 0.00mi | 3/2.0 | 1,080 (-14%) | 13mo | $40,000 | $37 | 67 |
| 14740 Bass Dr #23 | 0.38mi | 3/2.0 | 1,200 (-4%) | 11mo | $99,000 | $83 | 67 |
| 14740 Bass Dr #4 | 0.36mi | 3/2.0 | 1,296 (+4%) | 13mo | $97,990 | $76 | 66 |
| 14740 Bass Dr #36 | 0.38mi | 3/2.0 | 1,152 (-8%) | 7mo | $119,990 | $104 | 64 |
| 14740 Bass Dr #8 | 0.38mi | 3/2.0 | 1,064 (-15%) | 3mo | $105,000 | $99 | 56 |
| 14740 Bass Dr #11 | 0.38mi | 3/2.0 | 1,065 (-15%) | 11mo | $89,000 | $84 | 48 |
| 19821 Califontana Way Way | 0.74mi | 3/2.0 | 1,152 (-8%) | 19mo | $204,000 | $177 | 37 |
Match score weights: distance 35% · size 25% · config 20% · recency 20%. Top-matched comps best support the ARV.
Projected returns pro-forma
-3.0% appreciation · 5.98% rent growth · sell at horizon
- IRR
- 59.0%
- Equity multiple
- 3.74×
- Total profit
- $67,779
- Equity at exit
- $13,196
- IRR
- 64.8%
- Equity multiple
- 8.48×
- Total profit
- $185,246
- Equity at exit
- $7,652
Cash invested: $24,780 (down + closing). Projections, not guarantees.
Landlord ↔ Tenant lean methodology
- Overall (STATE)
- 18 Strongly Tenant-Friendly
- State California
- 18 Strongly Tenant-Friendly · D+13
- County
- — inherits STATE
- City
- — inherits STATE
ZIP-level market 96003
- Rents YoY
- 6.0%
- Active inventory
- 391
- Price-to-rent
- 3.4×
Monthly cashflow live
- Estimated rent
- $2,164 medium interval (Pro) →
- Mortgage (P&I)
- −$464
- Tax from tax record
- −$23 /mo · $281/yr
- Insurance
- −$37
- HOA
- −$0
- Vacancy / Maint / Mgmt
- −$454
- Net cashflow
- $1,185
Break-even live
UW: 25.0% down · 7.5% · 30yr · 1.5% tax · 5.0% vac · 8.0% maint · 8.0% mgmt
Financing live
Cash to close
- Down payment
- $22,125
- Closing costs
- $2,655
- Reserves months
- —
- Total cash needed
- —
Loan-product check · same deal, 3 products live
Conventional
25% down · 7.5% · 30yr
- Down + closing
- —
- Monthly P&I
- —
- Monthly cashflow
- —
- DSCR
- —
- Eligible?
- —
Personal DTI + credit; lowest rate.
DSCR
20% down · 8.5% · 30yr
- Down + closing
- —
- Monthly P&I
- —
- Monthly cashflow
- —
- DSCR
- —
- Eligible?
- —
No personal income docs; deal must DSCR.
Hard money
10% down · 12.0% · 12mo
- Down + closing
- —
- Monthly P&I
- —
- Monthly cashflow
- —
- DSCR
- —
- Eligible?
- —
Short-term bridge; refi at stabilization.
Listing history 20 events
-
2026-06-19days on market $88,500 Active 70 DOM
-
2026-06-18days on market $88,500 Active 69 DOM
-
2026-06-17days on market $88,500 Active 68 DOM
-
2026-06-16days on market $88,500 Active 67 DOM
-
2026-06-15days on market $88,500 Active 66 DOM
-
2026-06-14days on market $88,500 Active 64 DOM
-
2026-06-13days on market $88,500 Active 63 DOM
-
2026-06-10days on market $88,500 Active 61 DOM
-
2026-06-09days on market $88,500 Active 60 DOM
-
2026-06-08days on market $88,500 Active 59 DOM
-
2026-06-07pricedays on market $88,500 Active 58 DOM
-
2026-06-03days on market $99,000 Active 54 DOM
-
2026-06-02days on market $99,000 Active 53 DOM
-
2026-06-01days on market $99,000 Active 52 DOM
-
2026-05-31days on market $99,000 Active 51 DOM
-
2026-05-30days on market $99,000 Active 50 DOM
-
2026-04-10$99,000 Active 219-char remark
Show marketing remark (219 chars)
Affordable and well-kept mobile home in Mountain Gate! This home offers a comfortable layout with plenty of natural light, a functional kitchen, and cozy living spaces. Great opportunity to own in a desirable community!
-
2022-05-05soldstatus $76,900 581-char remark
Show marketing remark (581 chars)
Remodeled 3 bedroom 2 bath mobile home conveniently located near Bridge Bay, Shasta Lake, Shasta Dam and more! Step into a light and bright open split floorplan with updated flooring, cabinets and new appliances. All appliances, including washer & dryer will remain in the home!! New Master Cool evaportive cooler recently added with digital controller. Large master ensuite with garden tub in bathroom. Mobile home is front facing & perfectly placed on a large corner lot, with new low maintence landscape. Offering plenty of parking and extra storage in outdoor shed.
-
2021-12-31$76,900 581-char remark
Show marketing remark (581 chars)
Remodeled 3 bedroom 2 bath mobile home conveniently located near Bridge Bay, Shasta Lake, Shasta Dam and more! Step into a light and bright open split floorplan with updated flooring, cabinets and new appliances. All appliances, including washer & dryer will remain in the home!! New Master Cool evaportive cooler recently added with digital controller. Large master ensuite with garden tub in bathroom. Mobile home is front facing & perfectly placed on a large corner lot, with new low maintence landscape. Offering plenty of parking and extra storage in outdoor shed.
-
2021-09-17$81,500
ⓘ Source: listings_history table (triggers on properties + properties_extension) + one-shot
backfill from property_details.listing_events for pre-trigger history.
Tax reassessment forecast CA · Resets to sale price
- Current annual tax
- $281 · $23/mo
- Projected year-2 tax
- $673 · $56/mo
- Expected delta
- +$392/yr (+$33/mo · 139.4%)
ⓘ Screening estimate from a state-policy table — verify with the county assessor before closing.
Climate risk First Street
- Flood 1/10 Low FEMA zone X (unshaded) · 0% chance over 30 yrs
- Wildfire 8/10 Severe
- Heat 8/10 Severe 7 d/yr ≥105°F today · 17 d/yr by 30 yrs out
- Wind 1/10 Low
- Air quality 10/10 Extreme 45 unhealthy d/yr today · 48 by 30 yrs out
Nearby sold comps map
Loading sold comps map…
Walkable amenities ~0.75 mi
Loading nearby amenities…
Taxation est. · year 1
- Rental income
- $25,962
- − Mortgage interest
- −$4,957
- − Property taxes
- −$281
- − Insurance
- −$442
- − Repairs & maintenance
- −$2,077
- − Management
- −$2,077
- − Depreciation
- −$2,575
- Taxable income
- $13,553
- Est. tax owed @ 24.0%
- −$3,253
- After-tax cash flow
- $10,965/yr
For passive investors: Depreciation is non-cash, so a rental often shows a tax loss while cash-flowing — sheltering income. Rental losses are passive: they offset passive income freely, and up to $25,000/yr can offset ordinary (W-2) income if you actively participate and your MAGI is under $100k (phasing out to $0 by $150k); unused losses carry forward. On sale, claimed depreciation is recaptured at up to 25%, and gains may owe capital-gains tax (a 1031 exchange can defer both). Figures are a year-1 estimate at your 24.0% rate — not tax advice; consult a CPA.
Schools (NCES district)
- District
- Gateway Unified
- NCES district ID
- 0614950
- Math proficiency
- 25% ▼ -5.00%
- Reading proficiency
- 35% ▲ 2.00%
- Median HH income
- $41,888
- Composite
- 25.39/100
- National rank
- #7465
- State rank
- #355 of 517 in CA
Livability — Mountain Gate
- Score
- 47/100
- State rank
- #1255
- US rank
- #26371
Category grades
Schools grade is shown separately in the Schools card above.
Census & demographics
- Census place
- Mountain Gate, CA
- County
- Shasta County · 147,641 people
- Metro
- Redding, CA
- Population (ZIP)
- 44,923
- Household income
- $72,445
- Rent vs Own
- Severe rent burden
- 1668.0
Population outlook (Shasta County) Hauer SSP2
- Today (2025)
- 179,231 people
- By 2030
- 176,953 · -1.3%
- By 2040
- 169,982 · -5.2%
- By 2050
- 162,547 · -9.3%
- By 2075
- 145,649 · -18.7%
- By 2100
- 123,025 · -31.4%
Race, ethnicity, and origin ACS 2023
- Neighborhood character
- Predominantly White (76%)
- Race & ethnicity
- White 76% Hispanic / Latino 11% Two or more races 10% Asian 4% Native American 1% Black 1%
- Hispanic origin (detail)
- Mexican 7%
- Common ancestry
- Italian 5% Slovak 3% Lithuanian 3%
- Foreign-born
- 6% · Canada, China
- Languages at home
- 92% English-only · Spanish 3% German/W. Germanic 1% Other Asian/Pacific 1%
Political lean MEDSL · Shasta
- 2024 margin
- Solid R (+36.5) · D 30.5% · R 67.0% · Other 2.5%
- 2008→2024 swing
- -10.7pp toward R · 2008: -25.8pp · 2024: -36.5pp
- All cycles
- 2024: R+36.5 2020: R+33.1 2016: R+37.4 2012: R+30.3 2008: R+25.8
Not yet ingested
- Civics
- —
Market trends
- HPI YoY
- ▼ -181.66%
- Current HPI
- 152.3069
- Rent YoY
- ▲ 5.98%
- Metro
- Redding, CA
- State GDP YoY
- ▲ 3.21%
- F500 in state
- 116
Industry mix (Fortune 500 HQ in CA)
| Industry | F500 HQs | Revenue |
|---|---|---|
| Technology | 27 | $1,492B |
|
||
| Financial Services | 3 | $174B |
|
||
| Retail | 3 | $44B |
|
||
| Insurance | 3 | $26B |
|
||
| Media / Entertainment | 2 | $115B |
|
||
| Pharmaceuticals / Biotech | 2 | $62B |
|
||
Price history
+21.5% since first listed4 events — show timeline
- 2026-04-10 Listed $99,000 SAOR
- 2022-05-05 Sold (MLS) $76,900 SAOR
- 2021-12-31 Listed $76,900 SAOR
- 2021-09-17 Listed $81,500 SAOR
Property tax history
-4.2%/yrLatest (2020): $281 · +1.2% YoY. Source: county tax records.
Cash-flow waterfall
monthlySold comps — $/sqft
last 12 mo · ≤1 miLoading sold comps…