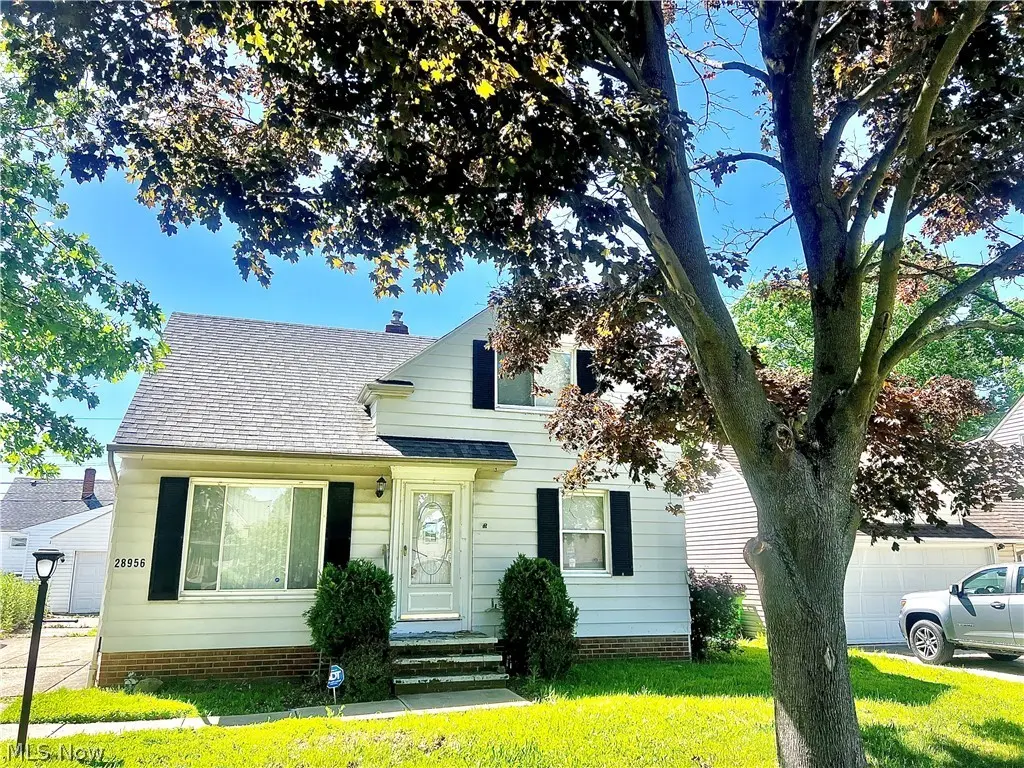
28956 Weber Ave · Wickliffe, OH
Flood risk 3/10 · Minor
- FEMA flood zone
- X (unshaded)
- Chance of flooding over 30 yrs
- 0.2%
- Est. flood insurance / yr
- $473 – $860
Fire risk 1/10 · Minimal
- Est. fire insurance / yr
- $713 – $1,323
Heat risk 3/10 · Minor
- Hot days now (above 94°F)
- 7 days/yr
- Hot days in 30 yrs
- 17 days/yr
Wind risk 1/10 · Minimal
- Chance of severe wind over 30 yrs
- —
Air-quality risk 3/10 · Minor
- Unhealthy air days now
- 3 days/yr
- Unhealthy air days in 30 yrs
- 4 days/yr
Risk factors via First Street. Map © Google.
Why this score? — see what drove the B grade
The composite is a weighted blend of 9 inputs, each scored 0–100. Each bar is that input's sub-score; the figure is the points it added to the 100-point composite (weight × sub-score).
- Cash flow +24.6/30.0
- ARV discount +15.0/15.0
- 1% rule +8.1/10.0
- DSCR +8.0/10.0
- Schools +4.6/10.0
- Rent growth +4.5/5.0
- Livability +4.1/5.0
- Condition / age +2.5/5.0
- Appreciation +0.0/10.0
$125,000
🖨 Deal sheet (PDF) 📄 Offer letter ✓ Due diligence
Listing remarks MLS
3 bedroom, 1 bath home with a fireplace. In the basement there is an additional full bathroom. Property is HUD owned and is being sold "As-Is" without any guarantee or warranty by seller. It is FHA "IE" which means it can be FHA financed (Insured with Escrow). Please visit SageAcq and HudHomeStore websites for more info and property disclosure data (like LBP, PCR, Radon, Mold, etc. ). * * Note: Sewer dye test failed. Buyer to assume any and all violations. City notice of violations in Supplements.
Key facts
- Eat-in kitchen
- Convenient location
- Versatile floor plan
Tags
Property features AI
Exterior
- Parking: Detached garage; 2 garage spaces
- Utilities: Public water; Public sewer
- Home design: Above-grade finished area reported as 1,330 (assessor); Below-grade finished area reported as 610 (assessor)
- Construction: Aluminum and vinyl siding; Asphalt/fiberglass roof
- Exterior features: Public records list lot size as 0.0569 acres; Partially finished below-grade finished area
Interior
- Bedrooms: 2 main-level bedrooms
- Bathrooms: 2 full bathrooms; 1 main-level bathroom
- Heating & cooling: Gas heating; Central air conditioning
- Interior features: Partially finished basement
Neighborhood map
What this means for you Summary
Snapshot
- This is a 4-bed/1.5-bath single-family listed at $125k.
Deal economics
- At list price, monthly cash flow is $259 ($3k/yr) — positive.
- The deal already cash-flows at list — no discount required.
- Meets the 1% rule at list price ($2k rent vs $125k).
- Cap rate 8.8% vs local median 4.7% in Wickliffe — top-decile yield for the area; either an underpriced asset or a hidden risk that comps aren't pricing in. Stress-test before assuming the spread holds.
Location & tenants
- Location reads 82/100 on livability (#85 in OH, #1,236 nationally) — a professional / high-income tenant draw. Strengths: crime A+, cost of living A+, housing A+; Watch: amenities C-, commute F.
- Wickliffe City (suburban): math 48% / reading 60% proficiency, ranked #386 of 656 in OH (top 59%) — acceptable for families but not a draw, mixed tenant base, ~2y average lease.
- Market conditions: Rents rising fast (+8.0%/yr); 69 active listings in the ZIP; 15 comparable units currently listed for rent nearby; rentals at typical pace (median 16d on market — plan ~3-4 weeks tenant-placement turnaround); 448 units permitted in Lake County in 2024 (0 in 5+ unit buildings).
Forward outlook
- Local home prices are declining (-3.0%/yr); year-one equity from $864 of loan paydown is wiped out by about $4k of value loss. Plan a longer hold.
- Lake County population projected to shrink 8% by 2050 — rents likely to lag national; underwrite the cash flow, not the appreciation.
- At projected returns (-3.0% appreciation + 8.0% rent growth), your $35k cash investment doubles in ~8 years — after that, you're playing with house money.
Negotiation context
- Only 3 days on market — expect competitive offers; lowballing is unlikely to land.
- 4 sale attempts since 35y ago with the ask held roughly flat each time — persistent listings suggest the price (not the market) is what's stuck; bring a comps-based counter.
- Current owner paid $68k; list at $125k implies a 84% gain — meaningful room to come down on a strong offer.
Risks & watch-outs
- Watch-outs: property tax is 3.2% of price; built in 1953 — expect roof / HVAC / electrical / plumbing capex.
Questions for the listing agent
- Built in 1953 — when were the roof, HVAC, electrical panel, plumbing, and water heater last replaced?
- Property tax is high relative to price — has the assessment been appealed recently, and will the sale trigger a re-assessment?
- Is there a deadline driving the sale (1031 exchange, divorce, estate, relocation)? That informs how much negotiation room exists.
- Schools are A-rated — typically a magnet for longer-tenancy family renters. What's the average tenant stay here, and is there a school-zone premium baked into asking?
- What's the average days-on-market for RENTAL listings here right now (not sales)? A rising rental-DOM trend means longer vacancies and softer asking-rent achievability than the comps imply.
- What's the recent tenant-quality profile in this submarket — average credit score on applications, eviction rate, late-payment / NSF rate, and stable-employment percentage? A property-management company in the area should have these aggregated.
- How much new for-sale + rental construction is in the pipeline within 1–3 miles? Heavy new supply typically softens prices + rents 12–24 months out; constrained supply supports both.
Investment metrics
- 1% rule
- 1.31% ✓
- Cap rate
- 8.78%
- Cash-on-cash
- 8.88%
- DSCR
- 1.40
- GRM
- 6.3
CMA / ARV
- ARV (on-the-fly)
- $230,860
- Comps found
- 12
Show comp detail 12 sales within ~0.75 mi
| Address | Dist | Beds/Ba | Sqft | Sold | Price | $/sf | Match |
|---|---|---|---|---|---|---|---|
| 630 Birch Ave | 0.13mi | 3/2.0 (-1) | 1,907 (-2%) | 8mo | $220,000 | $115 | 77 |
| 815 E 272nd St | 0.40mi | 4/1.5 | 1,972 (+2%) | 3mo | $130,000 | $66 | 76 |
| 1030 Lloyd Rd | 0.23mi | 5/2.0 (+1) | 1,907 (-2%) | 11mo | $256,500 | $135 | 71 |
| 584 Sycamore Dr | 0.23mi | 3/2.0 (-1) | 1,959 (+1%) | 14mo | $240,000 | $123 | 69 |
| 580 Walnut Dr | 0.17mi | 3/2.0 (-1) | 1,821 (-6%) | 9mo | $234,900 | $129 | 68 |
| 546 Walnut Dr | 0.25mi | 3/2.0 (-1) | 1,761 (-9%) | 7mo | $185,000 | $105 | 60 |
| 26931 Shoreview Ave | 0.48mi | 4/1.5 | 1,728 (-11%) | 3mo | $110,000 | $64 | 57 |
| 929 Lloyd Rd | 0.31mi | 4/1.5 | 2,167 (+12%) | 12mo | $258,750 | $119 | 56 |
| 29566 Shaker Dr | 0.61mi | 4/3.0 | 1,852 (-4%) | 3mo | $270,214 | $146 | 55 |
| 26381 Shoreview Ave | 0.66mi | 3/1.5 (-1) | 1,864 (-4%) | 8mo | $143,000 | $77 | 52 |
| 415 E 266 St | 0.67mi | 4/2.0 | 1,818 (-6%) | 7mo | $215,000 | $118 | 50 |
| 27540 Parkwood Ave | 0.74mi | 4/2.5 | 1,720 (-11%) | 13mo | $247,001 | $144 | 32 |
Match score weights: distance 35% · size 25% · config 20% · recency 20%. Top-matched comps best support the ARV.
Projected returns pro-forma
-3.0% appreciation · 8.0% rent growth · sell at horizon
- IRR
- 3.5%
- Equity multiple
- 1.14×
- Total profit
- $5,050
- Equity at exit
- $18,638
- IRR
- 17.8%
- Equity multiple
- 2.88×
- Total profit
- $65,676
- Equity at exit
- $10,808
Cash invested: $35,000 (down + closing). Projections, not guarantees.
Landlord ↔ Tenant lean methodology
- Overall (STATE)
- 73 Landlord-Friendly
- State Ohio
- 73 Landlord-Friendly · R+6
- County
- — inherits STATE
- City
- — inherits STATE
ZIP-level market 44092
- Rents YoY
- 8.0%
- Active inventory
- 69
- Price-to-rent
- 6.3×
Monthly cashflow live
- Estimated rent
- $1,642 high interval (Pro) →
- Mortgage (P&I)
- −$656
- Tax from tax record
- −$331 /mo · $3,970/yr
- Insurance
- −$52
- HOA
- −$0
- Vacancy / Maint / Mgmt
- −$345
- Net cashflow
- $259
Break-even live
Sensitivity live
| Price | -10% $330 | -5% $294 | +0% $259 | +5% $224 | +10% $188 |
|---|---|---|---|---|---|
| Rent | -10% $129 | -5% $194 | +0% $259 | +5% $324 | +10% $389 |
| Rate | -1.0pp $322 | -0.5pp $291 | base $259 | +0.5pp $227 | +1.0pp $194 |
UW: 25.0% down · 7.5% · 30yr · 1.5% tax · 5.0% vac · 8.0% maint · 8.0% mgmt
Financing live
Cash to close
- Down payment
- $31,250
- Closing costs
- $3,750
- Reserves months
- —
- Total cash needed
- —
Loan-product check · same deal, 3 products live
Conventional
25% down · 7.5% · 30yr
- Down + closing
- —
- Monthly P&I
- —
- Monthly cashflow
- —
- DSCR
- —
- Eligible?
- —
Personal DTI + credit; lowest rate.
DSCR
20% down · 8.5% · 30yr
- Down + closing
- —
- Monthly P&I
- —
- Monthly cashflow
- —
- DSCR
- —
- Eligible?
- —
No personal income docs; deal must DSCR.
Hard money
10% down · 12.0% · 12mo
- Down + closing
- —
- Monthly P&I
- —
- Monthly cashflow
- —
- DSCR
- —
- Eligible?
- —
Short-term bridge; refi at stabilization.
Rent comps 15 comps
| Address | Beds | Baths | Sqft | Rent | $/sqft | DOM | Units | Dist |
|---|---|---|---|---|---|---|---|---|
| 27190 Zeman Ave Euclid, OH | 4.0 | 1.0 | 1465 | $1,800 | $1.23 | 22d | 1 | 0.35mi |
| 27151 Farringdon Ave Euclid, OH | 5.0 | 2.0 | 1541 | $1,800 | $1.17 | 16d | 1 | 0.37mi |
| 27471 Forestview Ave Euclid, OH | 3.0 | 1.0 | 1282 | $1,495 | $1.17 | 45d | 1 | 0.44mi |
| 26900 Zeman Ave Euclid, OH | 4.0 | 1.5 | 1241 | $1,531 | $1.23 | 21d | 1 | 0.46mi |
| 26450 Drakefield Ave Euclid, OH | 4.0 | 1.5 | 1241 | $1,700 | $1.37 | 3d | 1 | 0.62mi |
| 26351 Farringdon Ave Euclid, OH | 3.0 | 1.0 | 1257 | $1,495 | $1.19 | 3d | 1 | 0.65mi |
| 26230 Briardale Ave Euclid, OH | 3.0 | 2.0 | 1290 | $1,600 | $1.24 | 3d | 1 | 0.71mi |
| 371 E 271st St Euclid, OH | 3.0 | 2.5 | 2432 | $1,695 | $0.70 | 3d | 1 | 0.72mi |
| 245 E 262nd St Euclid, OH | 3.0 | 2.0 | 1226 | $1,840 | $1.50 | 3d | 1 | 0.95mi |
| 26611 Lakeshore Blvd Unit UP Euclid, OH | 3.0 | 2.0 | 1400 | $1,275 | $0.91 | 21d | 1 | 0.99mi |
| 386 Walworth Ave Unit 1496104P Euclid, OH | 4.0 | 3.0 | 1862 | $6,861 | $3.68 | 3d | 1 | 1.02mi |
| 368 E 248th St Euclid, OH | 3.0 | 1.0 | 1440 | $1,395 | $0.97 | 45d | 1 | 1.20mi |
| 459 Clarmont Rd Willowick, OH | 4.0 | 2.0 | 1488 | $1,875 | $1.26 | 45d | 1 | 1.35mi |
| 884 E 248th St Euclid, OH | 3.0 | 2.0 | 1440 | $1,699 | $1.18 | 3d | 1 | 1.48mi |
| 655 E 240th St Euclid, OH | 3.0 | 1.0 | 1341 | $1,550 | $1.16 | 45d | 1 | 1.50mi |
Listing history 4 events
-
2026-06-09status $125,000 Pending 3 DOM
-
2026-06-08days on market $125,000 Active 3 DOM
-
2026-06-07remarks 699-char remark
-
2026-06-07$125,000 Active 2 DOM
ⓘ Source: listings_history table (triggers on properties + properties_extension) + one-shot
backfill from property_details.listing_events for pre-trigger history.
Tax reassessment forecast OH · Partial reset (capped growth)
- Current annual tax
- $3,970 · $331/mo
- Projected year-2 tax
- $3,970 · $331/mo
- Expected delta
- $0/yr ($0/mo · 0.0%)
ⓘ Screening estimate from a state-policy table — verify with the county assessor before closing.
Climate risk First Street
- Flood 3/10 Moderate FEMA zone X (unshaded) · 20% chance over 30 yrs
- Wildfire 1/10 Low
- Heat 3/10 Moderate 7 d/yr ≥94°F today · 17 d/yr by 30 yrs out
- Wind 1/10 Low
- Air quality 3/10 Moderate 3 unhealthy d/yr today · 4 by 30 yrs out
Nearby sold comps map
Loading sold comps map…
Walkable amenities ~0.75 mi
Loading nearby amenities…
Taxation est. · year 1
- Rental income
- $19,707
- − Mortgage interest
- −$7,002
- − Property taxes
- −$3,970
- − Insurance
- −$625
- − Repairs & maintenance
- −$1,577
- − Management
- −$1,577
- − Depreciation
- −$3,636
- Taxable income
- $1,321
- Est. tax owed @ 24.0%
- −$317
- After-tax cash flow
- $2,791/yr
For passive investors: Depreciation is non-cash, so a rental often shows a tax loss while cash-flowing — sheltering income. Rental losses are passive: they offset passive income freely, and up to $25,000/yr can offset ordinary (W-2) income if you actively participate and your MAGI is under $100k (phasing out to $0 by $150k); unused losses carry forward. On sale, claimed depreciation is recaptured at up to 25%, and gains may owe capital-gains tax (a 1031 exchange can defer both). Figures are a year-1 estimate at your 24.0% rate — not tax advice; consult a CPA.
Schools (NCES district)
- District
- Wickliffe City
- NCES district ID
- 3904508
- Math proficiency
- 48% ▼ -14.00%
- Reading proficiency
- 60% ▼ -8.00%
- Median HH income
- $48,233
- Composite
- 45.89/100
- National rank
- #2551
- State rank
- #386 of 656 in OH
Livability — Wickliffe
- Score
- 82/100
- State rank
- #85
- US rank
- #1236
Category grades
Schools grade is shown separately in the Schools card above.
Census & demographics
- Census place
- Wickliffe, OH
- County
- Lake County · 204,927 people
- City population
- 17,587
- Metro
- Cleveland-Elyria, OH
- Population (ZIP)
- 17,587
- Household income
- $70,801
- Rent vs Own
- Severe rent burden
- 572.0
Population outlook (Lake County) Hauer SSP2
- Today (2025)
- 230,022 people
- By 2030
- 228,151 · -0.8%
- By 2040
- 221,018 · -3.9%
- By 2050
- 212,754 · -7.5%
- By 2075
- 200,309 · -12.9%
- By 2100
- 183,315 · -20.3%
Race, ethnicity, and origin ACS 2023
- Neighborhood character
- Predominantly White (78%)
- Race & ethnicity
- White 78% Black 12% Two or more races 4% Hispanic / Latino 3% Asian 2%
- Common ancestry
- Romanian 4% Scotch-Irish 2% Iranian 2%
- Foreign-born
- 4% · Canada, Vietnam
- Languages at home
- 93% English-only · Russian/Polish/Slavic 3% Spanish 1% Other Indo-European 1%
Political lean MEDSL · Lake
- 2024 margin
- R (+14.3) · D 42.4% · R 56.7%
- 2008→2024 swing
- -15.2pp toward R · 2008: 0.8pp · 2024: -14.3pp
- All cycles
- 2024: R+14.3 2020: R+13.6 2016: R+15.6 2012: R+1.7 2008: D+0.8
Not yet ingested
- Civics
- —
Market trends
- HPI YoY
- ▼ -126.67%
- Current HPI
- 161.3288
- Rent YoY
- ▲ 8.03%
- Metro
- Cleveland-Elyria, OH
- State GDP YoY
- ▲ 1.98%
- F500 in state
- 48
Industry mix (Fortune 500 HQ in OH)
| Industry | F500 HQs | Revenue |
|---|---|---|
| Insurance | 3 | $145B |
|
||
| Industrial Machinery | 3 | $49B |
|
||
| Financial Services | 3 | $24B |
|
||
| Consumer Goods | 2 | $93B |
|
||
| Aerospace / Defense | 2 | $47B |
|
||
| Utilities | 2 | $33B |
|
||
Price history
+56.4% since first listed14 events — show timeline
- 2026-06-05 Listed $125,000 MLSNOW
- 2020-01-31 Sold (MLS) $68,000 MLSNOW
- 2019-11-06 Pending — MLSNOW
- 2019-10-25 Contingent — MLSNOW
- 2019-10-23 Relisted — MLSNOW
- 2019-08-21 Pending — MLSNOW
- 2019-08-14 Contingent — MLSNOW
- 2019-07-30 Listed $70,000 MLSNOW
- 2018-11-29 Sold (Public Records) $76,000 Public Records
- 2005-05-26 Sold (Public Records) $132,000 Public Records
- 1992-03-11 Sold (Public Records) $74,000 Public Records
- 1992-03-11 Sold (Public Records) $74,000 Public Records
- 1992-03-11 Sold (MLS) $74,000 MLSNOW
- 1991-07-20 Listed $79,900 MLSNOW
Property tax history
+3.8%/yrLatest (2025): $3,970 · +5.2% YoY. Source: county tax records.
Cash-flow waterfall
monthlySold comps — $/sqft
last 12 mo · ≤1 miLoading sold comps…