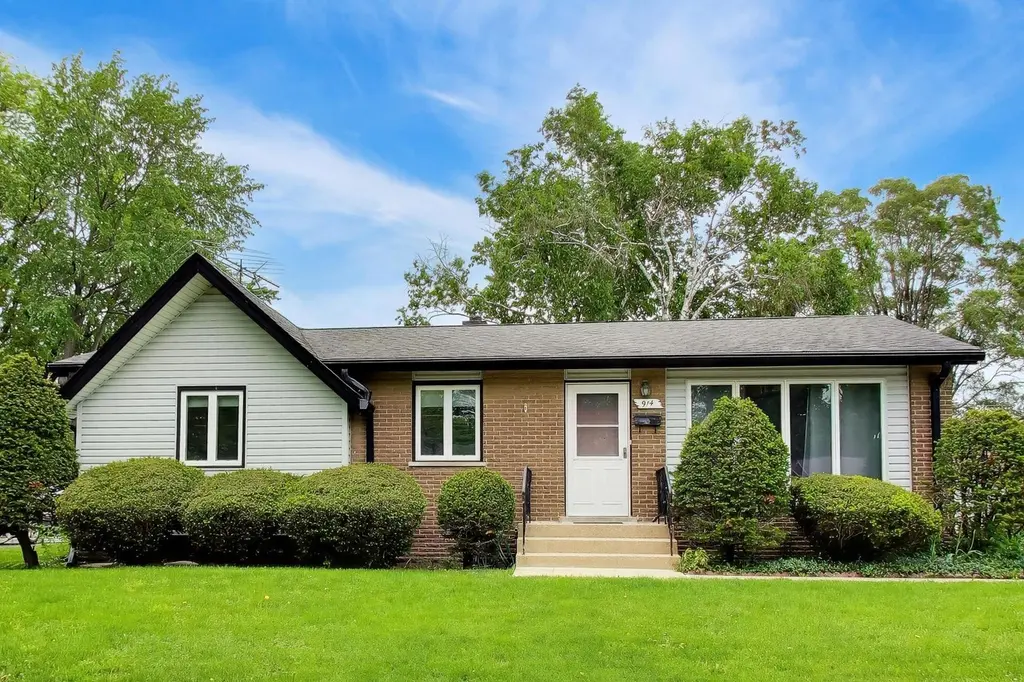
914 Coach Rd · Homewood, IL
Flood risk 1/10 · Minimal
- FEMA flood zone
- X (unshaded)
- Chance of flooding over 30 yrs
- 0.0%
- Est. flood insurance / yr
- $473 – $860
Fire risk 1/10 · Minimal
- Est. fire insurance / yr
- $804 – $1,492
Heat risk 3/10 · Minor
- Hot days now (above 101°F)
- 7 days/yr
- Hot days in 30 yrs
- 15 days/yr
Wind risk 2/10 · Minimal
- Chance of severe wind over 30 yrs
- —
Air-quality risk 2/10 · Minimal
- Unhealthy air days now
- 2 days/yr
- Unhealthy air days in 30 yrs
- 2 days/yr
Risk factors via First Street. Map © Google.
Why this score? — see what drove the D+ grade
The composite is a weighted blend of 9 inputs, each scored 0–100. Each bar is that input's sub-score; the figure is the points it added to the 100-point composite (weight × sub-score).
- Cash flow +18.6/30.0
- 1% rule +6.2/10.0
- DSCR +5.9/10.0
- ARV discount +5.5/15.0
- Livability +4.0/5.0
- Rent growth +2.5/5.0
- Condition / age +2.5/5.0
- Schools +2.4/10.0
- Appreciation +0.0/10.0
$250,000
🖨 Deal sheet 📄 Offer letter ✓ Due diligence
Listing remarks
Welcome to 914 Coach Rd in the heart of Homewood, a charming and well-maintained ranch-style home offering timeless curb appeal and comfortable everyday living. This 3-bedroom, 1.5-bath residence features a functional layout with spacious living areas, abundant natural light, and a detached garage for added convenience. Situated on a generously sized lot in a great neighborhood, the home is just minutes from parks, shopping, dining, Metra access, and award-winning Homewood-Flossmoor schools. A wonderful opportunity to enjoy suburban living with easy access to everything Homewood has to offer. Being sold AS-IS.
Key facts
- 2 garage spots
- Built 1961
- Listed 19 days
Property features AI
Finance
- HOA & community: No master association fee required
Exterior
- Parking: Detached garage (2 garage spaces, 2 total parking spaces); Owned garage
- Utilities: Water source: Lake Michigan; Public sewer
- Home design: Detached single-family home; One-story; Fee simple ownership; Built before 1978 (61–70 years old); Vinyl siding and brick exterior
- Construction: Vinyl siding and brick construction; Built approximately 61–70 years ago; Not rebuilt or rehabilitated
- Exterior features: Less than 0.25 acre lot; Lot dimensions listed
Interior
- Kitchen: Cooktop; Oven; Microwave; Refrigerator
- Bedrooms: 3 bedrooms (all on main level); Primary bedroom on main level
- Bathrooms: 1 full bathroom; 1 half bathroom; Basement has a bathroom
- Heating & cooling: Natural gas forced air heating; Central air conditioning; Ceiling fan(s)
- Interior features: Unfinished full basement; 7 total rooms; Recreation room (basement)
- Laundry & utility: Laundry room; Washer; Dryer; Sump pump
Neighborhood map
What this means for you Summary
Snapshot
- This is a 3-bed/1.5-bath single-family listed at $250k.
Deal economics
- At list price, monthly cash flow is $245 ($3k/yr) — positive.
- The deal already cash-flows at list — no discount required.
- Meets the 1% rule at list price ($3k rent vs $250k).
- Recommended offer: $246k (1.5% below list) — sets the bar for market timing.
- Cap rate 7.5% vs local median 6.1% in Homewood — meaningfully above typical; check what's discounted (condition, days-on-market, listing class) to confirm the premium yield is real.
Location & tenants
- Location reads 81/100 on livability (#81 in IL, #1,314 nationally) — a professional / high-income tenant draw. Strengths: commute A+, employment A+, cost of living A+; Watch: schools D+, amenities F.
- Homewood Flossmoor Chsd 233 (suburban): math 21% / reading 27% proficiency, ranked #272 of 620 in IL (top 44%) — low school quality limits family demand, transient renter base, plan for 1-2y turnover.
- Market conditions: 101 active listings in the ZIP; 1 comparable units currently listed for rent nearby; 6,272 units permitted in Cook County in 2024 (4,658 in 5+ unit buildings).
Forward outlook
- Local home prices are declining (-3.0%/yr); year-one equity from $2k of loan paydown is wiped out by about $8k of value loss. Plan a longer hold.
Negotiation context
- It's been on market 19 days — a 2% lower offer ($246k) is reasonable based on typical stale-listing flexibility.
Risks & watch-outs
- Watch-outs: property tax is 2.7% of price.
Questions for the listing agent
- Built in 1961 — when were the roof, HVAC, electrical panel, plumbing, and water heater last replaced?
- Property tax is high relative to price — has the assessment been appealed recently, and will the sale trigger a re-assessment?
- Is there a deadline driving the sale (1031 exchange, divorce, estate, relocation)? That informs how much negotiation room exists.
- Schools are D-rated, which usually means shorter tenancies and higher turnover. Who's the typical renter profile here, and what's been the actual vacancy rate?
- The area grade is low — what's the realistic commute time and amenity access for the typical tenant pool here? Any planned neighborhood developments (good or bad) we should know about?
- What's the average days-on-market for RENTAL listings here right now (not sales)? A rising rental-DOM trend means longer vacancies and softer asking-rent achievability than the comps imply.
- What's the recent tenant-quality profile in this submarket — average credit score on applications, eviction rate, late-payment / NSF rate, and stable-employment percentage? A property-management company in the area should have these aggregated.
- How much new for-sale + rental construction is in the pipeline within 1–3 miles? Heavy new supply typically softens prices + rents 12–24 months out; constrained supply supports both.
Investment metrics
- 1% rule
- 1.12% ✓
- Cap rate
- 7.47%
- Cash-on-cash
- 4.19%
- DSCR
- 1.19
- GRM
- 7.4
CMA / ARV
- ARV (on-the-fly)
- $239,400
- Comps found
- 12
Show comp detail 12 sales within ~0.75 mi
| Address | Dist | Beds/Ba | Sqft | Sold | Price | $/sf | Match |
|---|---|---|---|---|---|---|---|
| 914 Coach Rd | 0.00mi | 3/1.5 | 1,197 (0%) | 0mo | $275,000 | $230 | 100 |
| 945 W 187th St | 0.06mi | 4/1.5 (+1) | 1,197 (0%) | 4mo | $244,000 | $204 | 89 |
| 18430 Aberdeen St | 0.45mi | 3/2.0 | 1,223 (+2%) | 0mo | $242,000 | $198 | 73 |
| 900 W Strieff Ln | 0.38mi | 3/1.5 | 1,269 (+6%) | 3mo | $210,000 | $165 | 70 |
| 18815 Morgan St | 0.13mi | 4/3.0 (+1) | 1,262 (+5%) | 7mo | $262,000 | $208 | 68 |
| 330 N Illinois Ave | 0.27mi | 3/1.5 | 1,309 (+9%) | 5mo | $235,000 | $180 | 68 |
| 214 N Gay Ct | 0.20mi | 4/2.0 (+1) | 1,088 (-9%) | 3mo | $294,000 | $270 | 66 |
| 1129 183rd St | 0.62mi | 3/2.0 | 1,216 (+2%) | 5mo | $219,150 | $180 | 62 |
| 807 W Manor Ct W | 0.66mi | 4/1.5 (+1) | 1,232 (+3%) | 1mo | $245,000 | $199 | 59 |
| 527 N Virginia Ave | 0.49mi | 4/2.0 (+1) | 1,100 (-8%) | 0mo | $297,797 | $271 | 56 |
| 18243 Center Ave | 0.71mi | 3/1.0 | 1,079 (-10%) | 5mo | $216,000 | $200 | 44 |
| 313 N Park Dr | 0.67mi | 4/2.0 (+1) | 1,064 (-11%) | 2mo | $210,000 | $197 | 41 |
Match score weights: distance 35% · size 25% · config 20% · recency 20%. Top-matched comps best support the ARV.
Projected returns pro-forma
-3.0% appreciation · 3.0% rent growth · sell at horizon
- IRR
- -9.7%
- Equity multiple
- 0.65×
- Total profit
- $-24,739
- Equity at exit
- $37,276
- IRR
- -0.1%
- Equity multiple
- 0.99×
- Total profit
- $-707
- Equity at exit
- $21,615
Cash invested: $70,000 (down + closing). Projections, not guarantees.
Landlord ↔ Tenant lean methodology
- Overall (STATE)
- 43 Moderately Tenant-Leaning
- State Illinois
- 43 Moderately Tenant-Leaning · D+7
- County
- — inherits STATE
- City
- — inherits STATE
ZIP-level market 60430
- Home prices YoY
- -32.1%
- Active inventory
- 101
- Price-to-rent
- 7.4×
Monthly cashflow live
- Estimated rent
- $2,800 medium interval (Pro) →
- Mortgage (P&I)
- −$1,311
- Tax from tax record
- −$552 /mo · $6,626/yr
- Insurance
- −$104
- HOA
- −$0
- Vacancy / Maint / Mgmt
- −$588
- Net cashflow
- $245
Break-even live
UW: 25.0% down · 7.5% · 30yr · 1.5% tax · 5.0% vac · 8.0% maint · 8.0% mgmt
Financing live
Cash to close
- Down payment
- $62,500
- Closing costs
- $7,500
- Reserves months
- —
- Total cash needed
- —
Loan-product check · same deal, 3 products live
Conventional
25% down · 7.5% · 30yr
- Down + closing
- —
- Monthly P&I
- —
- Monthly cashflow
- —
- DSCR
- —
- Eligible?
- —
Personal DTI + credit; lowest rate.
DSCR
20% down · 8.5% · 30yr
- Down + closing
- —
- Monthly P&I
- —
- Monthly cashflow
- —
- DSCR
- —
- Eligible?
- —
No personal income docs; deal must DSCR.
Hard money
10% down · 12.0% · 12mo
- Down + closing
- —
- Monthly P&I
- —
- Monthly cashflow
- —
- DSCR
- —
- Eligible?
- —
Short-term bridge; refi at stabilization.
Rent comps 1 comps
| Address | Beds | Baths | Sqft | Rent | $/sqft | DOM | Units | Dist |
|---|---|---|---|---|---|---|---|---|
| 18117 Loomis Ave Homewood, IL | 4.0 | 2.0 | 1500 | $2,800 | $1.87 | 3d | 1 | 0.99mi |
Listing history 11 events
-
2026-06-10status $250,000 Pending 19 DOM
-
2026-06-09days on market $250,000 Contingent - Continue to Show 19 DOM
-
2026-06-08days on market $250,000 Contingent - Continue to Show 18 DOM
-
2026-06-07days on market $250,000 Contingent - Continue to Show 17 DOM
-
2026-06-04days on market $250,000 Contingent - Continue to Show 14 DOM
-
2026-06-03days on market $250,000 Contingent - Continue to Show 13 DOM
-
2026-06-02days on market $250,000 Contingent - Continue to Show 12 DOM
-
2026-06-01days on market $250,000 Contingent - Continue to Show 11 DOM
-
2026-05-31days on market $250,000 Contingent - Continue to Show 10 DOM
-
2026-05-21$250,000 Active
-
2026-05-20historical $250,000
ⓘ Source: listings_history table (triggers on properties + properties_extension) + one-shot
backfill from property_details.listing_events for pre-trigger history.
Tax reassessment forecast IL · Partial reset (capped growth)
- Current annual tax
- $6,626 · $552/mo
- Projected year-2 tax
- $6,626 · $552/mo
- Expected delta
- $0/yr ($0/mo · 0.0%)
ⓘ Screening estimate from a state-policy table — verify with the county assessor before closing.
Climate risk First Street
- Flood 1/10 Low FEMA zone X (unshaded) · 0% chance over 30 yrs
- Wildfire 1/10 Low
- Heat 3/10 Moderate 7 d/yr ≥101°F today · 15 d/yr by 30 yrs out
- Wind 2/10 Low
- Air quality 2/10 Low 2 unhealthy d/yr today · 2 by 30 yrs out
Nearby sold comps map
Loading sold comps map…
Walkable amenities ~0.75 mi
Loading nearby amenities…
Taxation est. · year 1
- Rental income
- $33,600
- − Mortgage interest
- −$14,004
- − Property taxes
- −$6,626
- − Insurance
- −$1,250
- − Repairs & maintenance
- −$2,688
- − Management
- −$2,688
- − Depreciation
- −$7,273
- Taxable loss
- −$928
- Est. tax savings @ 24.0%
- +$223
- After-tax cash flow
- $3,159/yr
For passive investors: Depreciation is non-cash, so a rental often shows a tax loss while cash-flowing — sheltering income. Rental losses are passive: they offset passive income freely, and up to $25,000/yr can offset ordinary (W-2) income if you actively participate and your MAGI is under $100k (phasing out to $0 by $150k); unused losses carry forward. On sale, claimed depreciation is recaptured at up to 25%, and gains may owe capital-gains tax (a 1031 exchange can defer both). Figures are a year-1 estimate at your 24.0% rate — not tax advice; consult a CPA.
Schools (NCES district)
- District
- Homewood Flossmoor Chsd 233
- NCES district ID
- 1719560
- Math proficiency
- 21% ▼ -15.00%
- Reading proficiency
- 27% ▼ -13.00%
- Median HH income
- $83,564
- Composite
- 24.42/100
- National rank
- #7681
- State rank
- #272 of 620 in IL
Livability — Homewood
- Score
- 81/100
- State rank
- #81
- US rank
- #1314
Category grades
Schools grade is shown separately in the Schools card above.
Census & demographics
- Census place
- Homewood, IL
- City population
- 19,993
- Population (ZIP)
- 19,993
Population outlook (Cook County) Hauer SSP2
- Today (2025)
- 5,347,519 people
- By 2030
- 5,357,703 · +0.2%
- By 2040
- 5,324,924 · -0.4%
- By 2050
- 5,230,762 · -2.2%
- By 2075
- 4,785,735 · -10.5%
- By 2100
- 4,188,836 · -21.7%
Race, ethnicity, and origin ACS 2023
- Neighborhood character
- Diverse neighborhood (Simpson 0.62)
- Race & ethnicity
- Black 44% White 42% Hispanic / Latino 9% Two or more races 6% Asian 1%
- Hispanic origin (detail)
- Mexican 7%
- Common ancestry
- Romanian 5% Iranian 2% Italian 2%
- Foreign-born
- 6% · Canada, Dominican Republic
- Languages at home
- 91% English-only · Spanish 5% Russian/Polish/Slavic 1% German/W. Germanic 1%
Political lean MEDSL · Cook
- 2024 margin
- Solid D (+42.0) · D 70.4% · R 28.4% · Other 1.2%
- 2008→2024 swing
- -11.4pp toward R · 2008: 53.4pp · 2024: 42.0pp
- All cycles
- 2024: D+42.0 2020: D+50.3 2016: D+53.0 2012: D+49.4 2008: D+53.4
Not yet ingested
- Civics
- —
Market trends
- HPI YoY
- ▼ -105.00%
- Current HPI
- 222.2923
- Rent YoY
- —
- Metro
- —
- State GDP YoY
- ▲ 1.59%
- F500 in state
- 60
Industry mix (Fortune 500 HQ in IL)
| Industry | F500 HQs | Revenue |
|---|---|---|
| Insurance | 4 | $201B |
|
||
| Consumer Goods | 4 | $87B |
|
||
| Industrial Machinery | 3 | $64B |
|
||
| Healthcare | 2 | $55B |
|
||
| Retail / Pharmacy | 1 | $148B |
|
||
| Agriculture / Food | 1 | $86B |
|
||
Price history
+0.0% since first listed2 events — show timeline
- 2026-05-21 Listed $250,000 MRED as Distributed by MLS Grid
- 2026-05-20 Coming Soon $250,000 MRED as Distributed by MLS Grid
Property tax history
+4.8%/yrLatest (2023): $6,626 · +27.2% YoY. Source: county tax records.
Cash-flow waterfall
monthlySold comps — $/sqft
last 12 mo · ≤1 miLoading sold comps…