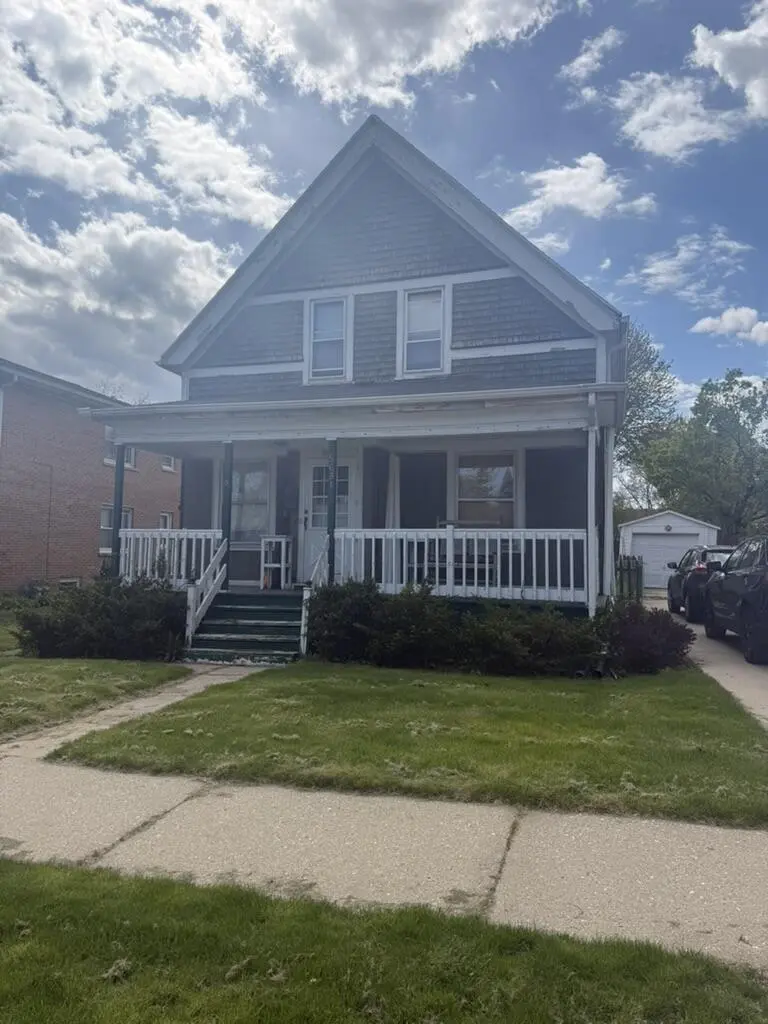
5681 N 42nd St · Milwaukee, WI
Flood risk 4/10 · Minor
- FEMA flood zone
- X (unshaded)
- Chance of flooding over 30 yrs
- 0.22%
- Est. flood insurance / yr
- $473 – $860
Fire risk 1/10 · Minimal
- Est. fire insurance / yr
- $636 – $1,182
Heat risk 2/10 · Minimal
- Hot days now (above 98°F)
- 7 days/yr
- Hot days in 30 yrs
- 13 days/yr
Wind risk 2/10 · Minimal
- Chance of severe wind over 30 yrs
- —
Air-quality risk 2/10 · Minimal
- Unhealthy air days now
- 2 days/yr
- Unhealthy air days in 30 yrs
- 2 days/yr
Risk factors via First Street. Map © Google.
Why this score? — see what drove the B+ grade
The composite is a weighted blend of 9 inputs, each scored 0–100. Each bar is that input's sub-score; the figure is the points it added to the 100-point composite (weight × sub-score).
- Cash flow +29.6/30.0
- ARV discount +15.0/15.0
- DSCR +10.0/10.0
- 1% rule +8.5/10.0
- Rent growth +4.7/5.0
- Livability +4.0/5.0
- Condition / age +2.5/5.0
- Schools +1.2/10.0
- Appreciation +0.0/10.0
$110,000
🖨 Deal sheet 📄 Offer letter ✓ Due diligence
Listing remarks MLS
Better Than New - Updated 3 Bed/2BA New Custom KitchenCabinets, Appliances, Hard-Wood Flooring, Center Island Natural Woodwork & Charm, Dining Rm w/ Bay Window- 3 Large Bd Full Bath 2nd Floor - Loads of Storeage in Basement -Fenced Deep Lot w/ Patio - 1 Car GarageGreat Family Home - Near School -Many Updates: Roof & Concrete Drive in 2005,New Windows, Kitchen, Microwave & Dishwasher in 2009 - Lower Porch Rebuilt in 2003 - Low Taxes - Quick Occupancy - Great Front Porch for Swing
Key facts
- Well built farm home
- Solid foundation
- Fenced in yard
Tags
Property features AI
Exterior
- Parking: Detached 1-car garage
- Utilities: Municipal water; Municipal sewer
- Home design: 1.5-story single-family home; Less than 1/2 acre lot (approximately 0.18 acre); Zoned RS6
- Construction: Assessor/public record used for year built
- Exterior features: Wood exterior; Other exterior materials
Interior
- Kitchen: Kitchen on main level — 16 x 12
- Bedrooms: Master bedroom (Upper) — 14 x 12; Bedroom 2 (Upper) — 13 x 12; Bedroom 3 (Upper) — 11 x 9
- Bathrooms: 2 full bathrooms
- Heating & cooling: Radiant / hot water heating; Other heating/cooling features noted
- Interior features: Full basement
Neighborhood map
What this means for you Summary
Snapshot
- This is a 3-bed/1.0-bath single-family listed at $110k.
Deal economics
- At list price, monthly cash flow is $399 ($5k/yr) — positive.
- The deal already cash-flows at list — no discount required.
- Meets the 1% rule at list price ($1k rent vs $110k).
- Cap rate 10.6% vs local median 5.1% in Milwaukee — top-decile yield for the area; either an underpriced asset or a hidden risk that comps aren't pricing in. Stress-test before assuming the spread holds.
Location & tenants
- Location reads 81/100 on livability (#55 in WI, #1,534 nationally) — a professional / high-income tenant draw. Strengths: amenities A+, commute A+, cost of living A+; Watch: employment D+, schools F, crime F.
- Milwaukee School District (urban): math 10% / reading 18% proficiency, ranked #337 of 342 in WI (top 98%) — low school quality limits family demand, transient renter base, plan for 1-2y turnover; 77% free/reduced lunch — lower-income household profile, screen leases tightly.
- Market conditions: Rents rising fast (+8.6%/yr); 168 active listings in the ZIP; 37 comparable units currently listed for rent nearby; rentals at typical pace (median 24d on market — plan ~3-4 weeks tenant-placement turnaround); 1,017 units permitted in Milwaukee County in 2024 (803 in 5+ unit buildings).
- This rent runs 37% of the median local income ($48k/yr) — at the standard rent-burdened threshold; future hikes will face affordability resistance.
Forward outlook
- Local home prices are declining (-3.0%/yr); year-one equity from $761 of loan paydown is wiped out by about $3k of value loss. Plan a longer hold.
- Milwaukee County population projected at +4% by 2050 — modest demand growth; plan on rents tracking national, not racing it.
- At projected returns (-3.0% appreciation + 8.0% rent growth), your $31k cash investment doubles in ~6 years — after that, you're playing with house money.
Negotiation context
- Only 12 days on market — expect competitive offers; lowballing is unlikely to land.
- 3 sale attempts since 13y ago with the ask held roughly flat each time — persistent listings suggest the price (not the market) is what's stuck; bring a comps-based counter.
- Current owner paid $30k; list at $110k implies a 272% gain — meaningful room to come down on a strong offer.
Risks & watch-outs
- Watch-outs: built in 1913 — expect roof / HVAC / electrical / plumbing capex.
Questions for the listing agent
- Built in 1913 — when were the roof, HVAC, electrical panel, plumbing, and water heater last replaced?
- Is there a deadline driving the sale (1031 exchange, divorce, estate, relocation)? That informs how much negotiation room exists.
- Schools are F-rated, which usually means shorter tenancies and higher turnover. Who's the typical renter profile here, and what's been the actual vacancy rate?
- Crime grade is F in this area — have there been break-ins, vandalism, or insurance claims at this property in the last 3 years? What carrier currently insures it and at what premium?
- What's the average days-on-market for RENTAL listings here right now (not sales)? A rising rental-DOM trend means longer vacancies and softer asking-rent achievability than the comps imply.
- What's the recent tenant-quality profile in this submarket — average credit score on applications, eviction rate, late-payment / NSF rate, and stable-employment percentage? A property-management company in the area should have these aggregated.
- How much new for-sale + rental construction is in the pipeline within 1–3 miles? Heavy new supply typically softens prices + rents 12–24 months out; constrained supply supports both.
Investment metrics
- 1% rule
- 1.35% ✓
- Cap rate
- 10.64%
- Cash-on-cash
- 15.53%
- DSCR
- 1.69
- GRM
- 6.2
CMA / ARV
- ARV (on-the-fly)
- $151,290
- Comps found
- 12
Show comp detail 12 sales within ~0.75 mi
| Address | Dist | Beds/Ba | Sqft | Sold | Price | $/sf | Match |
|---|---|---|---|---|---|---|---|
| 5931 N 42nd St | 0.31mi | 3/1.5 | 1,183 (-4%) | 0mo | $220,000 | $186 | 77 |
| 5730 N 35th St | 0.46mi | 2/1.0 (-1) | 1,216 (-1%) | 4mo | $162,000 | $133 | 68 |
| 5324 N 49th St | 0.64mi | 3/1.0 | 1,269 (+3%) | 1mo | $130,000 | $102 | 64 |
| 5331 N 37th St | 0.54mi | 3/1.0 | 1,306 (+6%) | 0mo | $133,000 | $102 | 64 |
| 5549 N 33rd St | 0.57mi | 3/2.5 | 1,241 (+1%) | 3mo | $176,000 | $142 | 64 |
| 3207 W Oriole Dr | 0.61mi | 3/1.0 | 1,194 (-3%) | 4mo | $179,000 | $150 | 63 |
| 5866 N 39th St | 0.31mi | 3/1.0 | 1,052 (-14%) | 1mo | $85,000 | $81 | 60 |
| 5342 N 51st Blvd | 0.71mi | 3/1.0 | 1,285 (+4%) | 3mo | $195,000 | $152 | 57 |
| 5936 N 35th St | 0.55mi | 3/1.0 | 1,358 (+10%) | 1mo | $163,000 | $120 | 56 |
| 5515 N 52nd St | 0.69mi | 4/1.0 (+1) | 1,146 (-7%) | 2mo | $109,000 | $95 | 50 |
| 5378 N 36th St | 0.54mi | 4/2.0 (+1) | 1,345 (+9%) | 1mo | $165,000 | $123 | 49 |
| 5324 N 34th St | 0.68mi | 4/1.0 (+1) | 1,324 (+8%) | 2mo | $75,000 | $57 | 49 |
Match score weights: distance 35% · size 25% · config 20% · recency 20%. Top-matched comps best support the ARV.
Projected returns pro-forma
-3.0% appreciation · 8.0% rent growth · sell at horizon
- IRR
- 11.9%
- Equity multiple
- 1.50×
- Total profit
- $15,458
- Equity at exit
- $16,401
- IRR
- 24.6%
- Equity multiple
- 3.66×
- Total profit
- $82,068
- Equity at exit
- $9,511
Cash invested: $30,800 (down + closing). Projections, not guarantees.
Landlord ↔ Tenant lean methodology
- Overall (STATE)
- 73 Landlord-Friendly
- State Wisconsin
- 73 Landlord-Friendly · R+2
- County
- — inherits STATE
- City
- — inherits STATE
ZIP-level market 53209
- Rents YoY
- 8.6%
- Active inventory
- 168
- Price-to-rent
- 6.2×
Monthly cashflow live
- Estimated rent
- $1,488 high interval (Pro) →
- Mortgage (P&I)
- −$577
- Tax from tax record
- −$154 /mo · $1,848/yr
- Insurance
- −$46
- HOA
- −$0
- Vacancy / Maint / Mgmt
- −$312
- Net cashflow
- $399
Break-even live
UW: 25.0% down · 7.5% · 30yr · 1.5% tax · 5.0% vac · 8.0% maint · 8.0% mgmt
Financing live
Cash to close
- Down payment
- $27,500
- Closing costs
- $3,300
- Reserves months
- —
- Total cash needed
- —
Loan-product check · same deal, 3 products live
Conventional
25% down · 7.5% · 30yr
- Down + closing
- —
- Monthly P&I
- —
- Monthly cashflow
- —
- DSCR
- —
- Eligible?
- —
Personal DTI + credit; lowest rate.
DSCR
20% down · 8.5% · 30yr
- Down + closing
- —
- Monthly P&I
- —
- Monthly cashflow
- —
- DSCR
- —
- Eligible?
- —
No personal income docs; deal must DSCR.
Hard money
10% down · 12.0% · 12mo
- Down + closing
- —
- Monthly P&I
- —
- Monthly cashflow
- —
- DSCR
- —
- Eligible?
- —
Short-term bridge; refi at stabilization.
Rent comps 37 comps
| Address | Beds | Baths | Sqft | Rent | $/sqft | DOM | Units | Dist |
|---|---|---|---|---|---|---|---|---|
| 5696 N 42nd St Milwaukee, WI | 4.0 | 1.0 | 1023 | $1,495 | $1.46 | 23d | 1 | 0.04mi |
| 5435 N 40th St Milwaukee, WI | 2.0 | 1.0 | 850 | $1,150 | $1.35 | 17d | 1 | 0.34mi |
| 5541 N 35th St #5543 Milwaukee, WI | 3.0 | 1.0 | 1130 | $1,195 | $1.06 | 4d | 1 | 0.46mi |
| 5884 N 35th St Milwaukee, WI | 2.0 | 1.0 | 1200 | $1,500 | $1.25 | 43d | 1 | 0.53mi |
| 3931 W Kaul Ave Milwaukee, WI | 3.0 | 1.0 | 1400 | $1,695 | $1.21 | 43d | 1 | 0.56mi |
| 6110 N 39th St Milwaukee, WI | 2.0 | 1.0 | 703 | $1,395 | $1.98 | 4d | 1 | 0.61mi |
| 6148 N 39th St Milwaukee, WI | 2.0 | 1.0 | 792 | $1,175 | $1.48 | 43d | 1 | 0.66mi |
| 4334 W Eggert Pl Milwaukee, WI | 4.0 | 1.0 | 1077 | $1,695 | $1.57 | 23d | 1 | 0.70mi |
| 4340 W Eggert Pl Milwaukee, WI | 4.0 | 1.0 | 1066 | $1,695 | $1.59 | 23d | 1 | 0.70mi |
| 5165-5167 N 45th St Unit 5165 Milwaukee, WI | 3.0 | 1.0 | 1020 | $1,200 | $1.18 | 17d | 1 | 0.70mi |
| 4610 W Eggert Pl #4612 Milwaukee, WI | 3.0 | 1.0 | 852 | $1,095 | $1.29 | 23d | 1 | 0.74mi |
| 5237 N 34th St Unit 5237 Lower Milwaukee, WI | 2.0 | 1.0 | 956 | $1,350 | $1.41 | 23d | 1 | 0.75mi |
| 5050 N 47th St Milwaukee, WI | 2.0 | 1.0 | 1092 | $1,700 | $1.56 | 43d | 1 | 0.85mi |
| 5073 N 48th St Milwaukee, WI | 4.0 | 1.0 | 1152 | $1,595 | $1.38 | 14d | 1 | 0.86mi |
| 5688 N 56th St Milwaukee, WI | 3.0 | 1.0 | 850 | $1,445 | $1.70 | 12d | 1 | 0.88mi |
| 5032 N 32nd St Milwaukee, WI | 3.0 | 2.0 | 1089 | $1,750 | $1.61 | 12d | 1 | 1.04mi |
| 5657 N 60th St #5659 Milwaukee, WI | 3.0 | 1.0 | 878 | $995 | $1.13 | 17d | 1 | 1.09mi |
| 4852 N 48th St Unit 4852 Milwaukee, WI | 2.0 | 1.0 | 830 | $995 | $1.20 | 2d | 1 | 1.11mi |
| 5830 N 61st St Milwaukee, WI | 3.0 | 1.0 | 1024 | $1,450 | $1.42 | 43d | 1 | 1.13mi |
| 6046 N 61st St Unit 1 Milwaukee, WI | 3.0 | 1.0 | 1200 | $1,345 | $1.12 | 23d | 1 | 1.20mi |
| 6046 N 61st St Unit 2 Milwaukee, WI | 3.0 | 1.0 | 1250 | $1,395 | $1.12 | 43d | 1 | 1.20mi |
| 6221 W Thurston Ave #6223 Milwaukee, WI | 3.0 | 1.0 | 800 | $1,100 | $1.38 | 20d | 1 | 1.21mi |
| 4727 N 46th St Milwaukee, WI | 3.0 | 1.0 | 936 | $1,700 | $1.82 | 43d | 1 | 1.26mi |
| 4702 N 44th St Milwaukee, WI | 3.0 | 2.0 | 1050 | $1,850 | $1.76 | 43d | 1 | 1.27mi |
| 4703 N 45th St Milwaukee, WI | 3.0 | 1.0 | 1031 | $1,695 | $1.64 | 23d | 1 | 1.28mi |
| 4661 N 38th St Unit 4661 Milwaukee, WI | 2.0 | 1.0 | 1000 | $845 | $0.84 | 14d | 1 | 1.32mi |
| 5659 N 64th St Unit 5659A Milwaukee, WI | 2.0 | 1.0 | 1091 | $1,300 | $1.19 | 43d | 1 | 1.34mi |
| 4651 N 36th St #4 Milwaukee, WI | 2.0 | 1.0 | 747 | $945 | $1.27 | 23d | 1 | 1.36mi |
| 5820 N 65th St #5822 Milwaukee, WI | 2.0 | 1.0 | 700 | $1,245 | $1.78 | 43d | 1 | 1.38mi |
| 5823 N 65th St Unit Upper Milwaukee, WI | 2.0 | 1.0 | 768 | $1,295 | $1.69 | 43d | 1 | 1.41mi |
| 5831 N 65th St Unit 5831 Milwaukee, WI | 3.0 | 1.0 | 900 | $1,195 | $1.33 | 43d | 1 | 1.41mi |
| 4900 N 58th St Milwaukee, WI | 3.0 | 1.0 | 1455 | $1,450 | $1.00 | 4d | 1 | 1.41mi |
| 4640 N 51st Blvd Milwaukee, WI | 2.0 | 1.0 | 1075 | $1,275 | $1.19 | 43d | 1 | 1.45mi |
| 6600 N Sidney Pl Glendale, WI | 1.0–2.0 | 1.0 | 800 | $1,587 | $1.98 | 3d | 13 | 1.46mi |
| 6762 N 52nd St Milwaukee, WI | 2.0 | 2.0 | 1309 | $1,500 | $1.15 | 14d | 1 | 1.48mi |
| 6535 N 58th St Milwaukee, WI | 2.0 | 1.0 | 962 | $1,195 | $1.24 | 17d | 1 | 1.48mi |
| 5905 N 66th St Unit 66th Lower Milwaukee, WI | 3.0 | 1.0 | 1000 | $1,600 | $1.60 | 16d | 1 | 1.48mi |
Listing history 9 events
-
2026-06-17status $110,000 Pending 12 DOM
-
2026-06-16days on market $110,000 Active 12 DOM
-
2026-06-15pricedays on market $110,000 Active 11 DOM
-
2026-06-13days on market $115,000 Active 9 DOM
-
2026-06-13days on market $115,000 Active 8 DOM
-
2026-06-09days on market $115,000 Active 5 DOM
-
2026-06-08days on market $115,000 Active 4 DOM
-
2026-06-07remarks 544-char remark
-
2026-06-07$115,000 Active 3 DOM
ⓘ Source: listings_history table (triggers on properties + properties_extension) + one-shot
backfill from property_details.listing_events for pre-trigger history.
Tax reassessment forecast WI · Partial reset (capped growth)
- Current annual tax
- $1,848 · $154/mo
- Projected year-2 tax
- $1,941 · $162/mo
- Expected delta
- +$94/yr (+$8/mo · 5.1%)
ⓘ Screening estimate from a state-policy table — verify with the county assessor before closing.
Climate risk First Street
- Flood 4/10 Moderate FEMA zone X (unshaded) · 22% chance over 30 yrs
- Wildfire 1/10 Low
- Heat 2/10 Low 7 d/yr ≥98°F today · 13 d/yr by 30 yrs out
- Wind 2/10 Low
- Air quality 2/10 Low 2 unhealthy d/yr today · 2 by 30 yrs out
Nearby sold comps map
Loading sold comps map…
Walkable amenities ~0.75 mi
Loading nearby amenities…
Taxation est. · year 1
- Rental income
- $17,853
- − Mortgage interest
- −$6,162
- − Property taxes
- −$1,848
- − Insurance
- −$550
- − Repairs & maintenance
- −$1,428
- − Management
- −$1,428
- − Depreciation
- −$3,200
- Taxable income
- $3,237
- Est. tax owed @ 24.0%
- −$777
- After-tax cash flow
- $4,007/yr
For passive investors: Depreciation is non-cash, so a rental often shows a tax loss while cash-flowing — sheltering income. Rental losses are passive: they offset passive income freely, and up to $25,000/yr can offset ordinary (W-2) income if you actively participate and your MAGI is under $100k (phasing out to $0 by $150k); unused losses carry forward. On sale, claimed depreciation is recaptured at up to 25%, and gains may owe capital-gains tax (a 1031 exchange can defer both). Figures are a year-1 estimate at your 24.0% rate — not tax advice; consult a CPA.
Schools (NCES district)
- District
- Milwaukee School District
- NCES district ID
- 5509600
- Math proficiency
- 10% ▼ -5.00%
- Reading proficiency
- 18% ▬ 0.00%
- Median HH income
- $36,339
- Composite
- 11.61/100
- National rank
- #9696
- State rank
- #337 of 342 in WI
Livability — Milwaukee
- Score
- 81/100
- State rank
- #55
- US rank
- #1534
Category grades
Schools grade is shown separately in the Schools card above.
Census & demographics
- Census place
- Milwaukee, WI
- County
- Milwaukee County · 926,379 people
- City population
- 573,768
- Metro
- Milwaukee-Waukesha, WI
- Population (ZIP)
- 45,170
- Household income
- $48,486
- Rent vs Own
- Severe rent burden
- 3390.0
Population outlook (Milwaukee County) Hauer SSP2
- Today (2025)
- 995,758 people
- By 2030
- 1,009,124 · +1.3%
- By 2040
- 1,028,128 · +3.3%
- By 2050
- 1,040,066 · +4.4%
- By 2075
- 1,057,849 · +6.2%
- By 2100
- 1,039,774 · +4.4%
Race, ethnicity, and origin ACS 2023
- Neighborhood character
- Predominantly Black (66%)
- Race & ethnicity
- Black 66% White 22% Hispanic / Latino 5% Two or more races 5% Asian 2%
- Hispanic origin (detail)
- Mexican 2% Puerto Rican 3%
- Common ancestry
- Romanian 3% Portuguese 1% Iranian 1%
- Foreign-born
- 3% · Canada
- Languages at home
- 92% English-only · Spanish 4% Other Asian/Pacific 1% Russian/Polish/Slavic 1%
Political lean MEDSL · Milwaukee
- 2024 margin
- Solid D (+38.5) · D 68.3% · R 29.8% · Other 1.8%
- 2008→2024 swing
- +2.7pp toward D · 2008: 35.9pp · 2024: 38.5pp
- All cycles
- 2024: D+38.5 2020: D+39.9 2016: D+37.5 2012: D+34.6 2008: D+35.9
Not yet ingested
- Civics
- —
Market trends
- HPI YoY
- ▼ -194.98%
- Current HPI
- 172.4275
- Rent YoY
- ▲ 8.61%
- Metro
- Milwaukee-Waukesha, WI
- State GDP YoY
- ▲ 2.10%
- F500 in state
- 20
Industry mix (Fortune 500 HQ in WI)
| Industry | F500 HQs | Revenue |
|---|---|---|
| Industrial Machinery | 4 | $23B |
|
||
| Industrial Technology | 2 | $36B |
|
||
| Insurance | 1 | $36B |
|
||
| Professional Services | 1 | $19B |
|
||
| Utilities | 1 | $9B |
|
||
| Consumer Goods | 1 | $3B |
|
||
Price history
+313.7% since first listed8 events — show timeline
- 2026-06-04 Listed $115,000 METROMLS
- 2018-03-28 Sold (Public Records) $29,600 Public Records
- 2013-02-09 Listing Removed — METROMLS
- 2013-02-09 Listed $89,900 METROMLS
- 2013-02-02 Listing Removed — METROMLS
- 2013-02-02 Listed $129,900 METROMLS
- 1989-06-01 Sold (Public Records) $27,500 Public Records
- 1984-05-01 Sold (Public Records) $27,800 Public Records
Property tax history
+2.4%/yrLatest (2024): $1,848 · +19.6% YoY. Source: county tax records.
Cash-flow waterfall
monthlySold comps — $/sqft
last 12 mo · ≤1 miLoading sold comps…