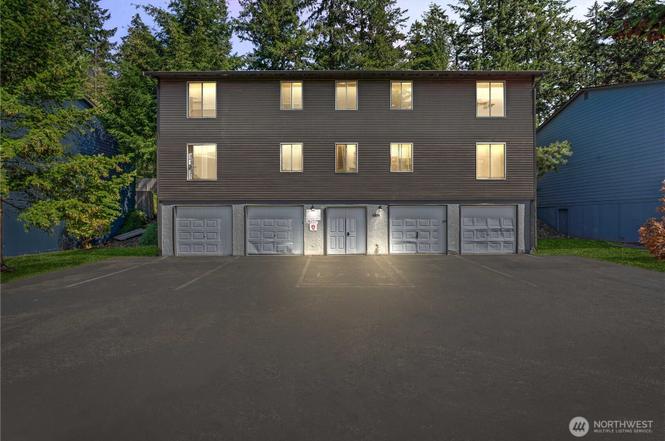
 Fourplex
9405 S Ash St Unit A-D · Tacoma, WA
Flood risk 1/10 · Minimal
- FEMA flood zone
- X (unshaded)
- Chance of flooding over 30 yrs
- 0.0%
- Est. flood insurance / yr
- $507 – $1,088
Fire risk 1/10 · Minimal
- Est. fire insurance / yr
- $604 – $1,122
Heat risk 3/10 · Minor
- Hot days now (above 86°F)
- 6 days/yr
- Hot days in 30 yrs
- 12 days/yr
Wind risk 1/10 · Minimal
- Chance of severe wind over 30 yrs
- —
Air-quality risk 7/10 · Major
- Unhealthy air days now
- 11 days/yr
- Unhealthy air days in 30 yrs
- 12 days/yr
Risk factors via First Street. Map © Google.
Why this score? — see what drove the D grade
The composite is a weighted blend of 9 inputs, each scored 0–100. Each bar is that input's sub-score; the figure is the points it added to the 100-point composite (weight × sub-score).
- Appreciation +10.0/10.0
- Cash flow +7.5/30.0
- ARV discount +7.5/15.0
- Schools +4.2/10.0
- Livability +3.9/5.0
- Rent growth +3.2/5.0
- Condition / age +2.5/5.0
- 1% rule +2.4/10.0
- DSCR +1.6/10.0
$850,000
🖨 Deal sheet (PDF) 📄 Offer letter ✓ Due diligence
Multi-family units
County records classify this as Multi-Family (2-4 Unit). Listing-text estimate: 4 units. confirmed
Listing remarks
RARE investment opportunity in a prime location! Close to JBLM and all main attractions that Tacoma-Lakewood has to offer. This well-maintained Fourplex offers large units w/ 2 bedroom(s), 1 bathroom(s). Large decks on top units, & spacious back yard for lower units. Rock face-Fireplace(s) in all units. One of the top units is spacious & completely remodeled, plenty of storage, in-unit laundry & Vacant to view! This 4-Plex comes with 4 separate garages for tenant's vehicles & storage space. The large lot means plenty of privacy and room for additional parking. Gated community. It’s not often you come by a Fourplex with this much to offer–don’t wait o
Key facts
- Completely remodeled
- In-unit laundry
- Spacious back yard
Tags
Property features AI
Finance
- Other: Four total units in the building; No units below grade; Calculated building area reported as 3,456 square feet; Lot dimensions: 76' x 142' x 75' x 151'; Lot size approximately 0.2533 acres; Zoned by the city
- Financial info: Gross scheduled income reported at $63,283; Gross adjusted income reported at $62,282; Total monthly income reported at $6,520; Total expenses reported at $13,517; Electric expense reported at $408; Insurance expense reported at $1,817; Other expenses reported at $2,208; Listing terms: Cash, Conventional, VA Loan; Current rents by unit: Units A and D at $1,700 each; Units B and C at $1,500 each
- HOA & community: Has HOA with an annual fee of $2,200
Exterior
- Parking: Four covered/garage spaces; Four uncovered open parking spaces (total open parking 8 spaces reported); Garage area approximately 1,728 square feet
- Security: Partially fenced (listed under security features)
- Utilities: Electric energy source; Water service by TPU; Power service by TPU; Sewer available; STEP sewer serviced by TPU
- Home design: Residential income property (multi-family); Quadruplex; Three stories; Entry addresses labeled A–D; Built in 1998 (effective year)
- Construction: Wood construction; Composition roof; Poured concrete foundation; Effective year built 1998
- Exterior features: Wood exterior; Wood products detailing; Partially fenced yard; Patio; Paved site
Interior
- Kitchen: Each unit includes a range/oven; Each unit includes a refrigerator; Each unit includes a dishwasher
- Bedrooms: Four 2-bedroom units (each unit has 2 bedrooms)
- Bathrooms: Four 1-bath units (each unit has 1 bathroom)
- Heating & cooling: Baseboard heating; No central cooling
- Interior features: Fireplaces in each unit; Partially fenced property
- Laundry & utility: Each unit includes a washer and dryer
Neighborhood map
What this means for you Summary
Snapshot
- This is a 4 × 2-bed/1.0-bath units multifamily listed at $850k.
Deal economics
- At list price, monthly cash flow is $-1k ($-13k/yr) — negative. Per door: $-265/mo.
- To cash-flow at today's rent, offer at most $697k (18.0% below list).
- To meet the 1% rule (rent ≥ 1% of price), the offer needs to be $633k (25.6% below list).
- Recommended offer: $633k (25.6% below list) — sets the bar for 1% rule.
- Cap rate 4.8% vs local median 2.9% in Tacoma — top-decile yield for the area; either an underpriced asset or a hidden risk that comps aren't pricing in. Stress-test before assuming the spread holds.
Location & tenants
- Location reads 78/100 on livability (#127 in WA, #2,535 nationally) — a middle-class / working-renter tenant base. Strengths: amenities A+, commute A+, housing A+; Watch: cost of living D, crime F.
- Tacoma School District (urban): math 40% / reading 53% proficiency, ranked #169 of 291 in WA (top 58%) — families likely to look elsewhere, expect single-tenant / working-renter base with shorter leases.
- Zoned schools: Helen Stafford Elementary School (451 students, 71% FRL); Baker Middle School (694 students, 74% FRL); Mount Tahoma High School (1,430 students, 71% FRL) — zoned schools average 72% FRL vs 53% district-wide (19 pts higher); higher-poverty schools than district average — tighter screening recommended.
- Market conditions: Rents rising (+2.9%/yr); 159 active listings in the ZIP; 3,209 units permitted in Pierce County in 2024 (1,269 in 5+ unit buildings).
- At $6,327/mo this rent would consume 116% of the median local household income ($65k/yr) (locally 2169% of renters already pay >50% of income on rent) — very limited rent-growth headroom before tenants either downsize or default.
Forward outlook
- In year one you build about $91k of equity ($6k loan paydown + $85k appreciation (10.0% local appreciation)).
- Pierce County population projected at +26% by 2050 — long-run rental-demand tailwind backs the buy-and-hold thesis.
- By year 2, paydown + projected appreciation supports a ~$146k cash-out refi (75% LTV) — recoverable capital for the next deal without selling this one.
Negotiation context
- It's been on market 146 days — a 12% lower offer ($748k) is reasonable based on typical stale-listing flexibility.
- 2 sale attempts; this cycle's ask has dropped $45k (5%) from the opening price — seller is motivated, your offer sets the floor, not the list.
Questions for the listing agent
- What do current leases actually rent for vs. the listed asking? Can we see a recent rent roll and the last 12 months of T-12 income?
- It's been on market 146 days. Have you received any prior offers? Is the seller open to a 26% concession, seller financing, or rate buy-down credit?
- Can we see the unit-by-unit rent roll, current vacancy, and any below-market leases? What's the average tenancy length?
- What capital expenditures (roof, boiler, parking lot, exteriors) have been made in the last 5 years, and what's planned in the next 2?
- What does the HOA fee cover, when was the last increase, and are there any pending special assessments or reserve-fund shortfalls?
- Why hasn't it sold? Are there any deal-killer items the seller is aware of (foundation, flood, title, zoning, code violations)?
- Is there a deadline driving the sale (1031 exchange, divorce, estate, relocation)? That informs how much negotiation room exists.
- Schools are B-rated — typically a magnet for longer-tenancy family renters. What's the average tenant stay here, and is there a school-zone premium baked into asking?
- Crime grade is F in this area — have there been break-ins, vandalism, or insurance claims at this property in the last 3 years? What carrier currently insures it and at what premium?
- The area grade is low — what's the realistic commute time and amenity access for the typical tenant pool here? Any planned neighborhood developments (good or bad) we should know about?
- What's the average days-on-market for RENTAL listings here right now (not sales)? A rising rental-DOM trend means longer vacancies and softer asking-rent achievability than the comps imply.
- What's the recent tenant-quality profile in this submarket — average credit score on applications, eviction rate, late-payment / NSF rate, and stable-employment percentage? A property-management company in the area should have these aggregated.
- How much new apartment / multifamily construction is in the pipeline within 1–3 miles? Heavy new supply (>2% of stock underway) typically softens rents 12–24 months out; light construction supports rent growth.
Investment metrics
- 1% rule
- 0.74% ✗
- Cap rate
- 4.80%
- Cash-on-cash
- -5.34%
- DSCR
- 0.76
- GRM
- 11.2
CMA / ARV
No comps found within radius.
Projected returns pro-forma
10.0% appreciation · 2.93% rent growth · sell at horizon
- IRR
- 20.5%
- Equity multiple
- 2.66×
- Total profit
- $395,258
- Equity at exit
- $765,747
- IRR
- 18.6%
- Equity multiple
- 6.11×
- Total profit
- $1,216,513
- Equity at exit
- $1,651,363
Cash invested: $238,000 (down + closing). Projections, not guarantees.
Landlord ↔ Tenant lean methodology
- Overall (STATE)
- 28 Tenant-Leaning
- State Washington
- 28 Tenant-Leaning · D+8
- County
- — inherits STATE
- City
- — inherits STATE
ZIP-level market 98444
- Home prices YoY
- 3.6%
- Rents YoY
- 2.9%
- Active inventory
- 159
- Price-to-rent
- 44.8×
Monthly cashflow live
- Estimated rent
- $6,327 high interval (Pro) →
- Mortgage (P&I)
- −$4,457
- Tax est. 1.5%
- −$1,062 /mo · $12,750/yr
- Insurance
- −$354
- HOA
- −$183
- Vacancy / Maint / Mgmt
- −$1,329
- Net cashflow
- $-1,059
Break-even live
Sensitivity live
| Price | -10% $-471 | -5% $-765 | +0% $-1,059 | +5% $-1,353 | +10% $-1,646 |
|---|---|---|---|---|---|
| Rent | -10% $-1,559 | -5% $-1,309 | +0% $-1,059 | +5% $-809 | +10% $-559 |
| Rate | -1.0pp $-631 | -0.5pp $-843 | base $-1,059 | +0.5pp $-1,279 | +1.0pp $-1,503 |
4-unit breakdown (identical units grouped — click to expand)
| Units | Beds | Baths | Est. rent |
|---|---|---|---|
| 4× units | 2 | 1 | $6,328 |
| #1 | 2 | 1 | $1,582 |
| #2 | 2 | 1 | $1,582 |
| #3 | 2 | 1 | $1,582 |
| #4 | 2 | 1 | $1,582 |
| Total (4 units) | $6,327 | ||
UW: 25.0% down · 7.5% · 30yr · 1.5% tax · 5.0% vac · 8.0% maint · 8.0% mgmt
Financing live
Cash to close
- Down payment
- $212,500
- Closing costs
- $25,500
- Reserves months
- —
- Total cash needed
- —
Loan-product check · same deal, 3 products live
Conventional
25% down · 7.5% · 30yr
- Down + closing
- —
- Monthly P&I
- —
- Monthly cashflow
- —
- DSCR
- —
- Eligible?
- —
Personal DTI + credit; lowest rate.
DSCR
20% down · 8.5% · 30yr
- Down + closing
- —
- Monthly P&I
- —
- Monthly cashflow
- —
- DSCR
- —
- Eligible?
- —
No personal income docs; deal must DSCR.
Hard money
10% down · 12.0% · 12mo
- Down + closing
- —
- Monthly P&I
- —
- Monthly cashflow
- —
- DSCR
- —
- Eligible?
- —
Short-term bridge; refi at stabilization.
HOA detail
- Monthly dues
- $183 · $2,196/yr
- Likely covers
- security
Listing history 18 events
-
2026-06-21days on market $850,000 Active 146 DOM
-
2026-06-18days on market $850,000 Active 143 DOM
-
2026-06-17days on market $850,000 Active 142 DOM
-
2026-06-16days on market $850,000 Active 141 DOM
-
2026-06-15days on market $850,000 Active 140 DOM
-
2026-06-13days on market $850,000 Active 138 DOM
-
2026-06-13days on market $850,000 Active 137 DOM
-
2026-06-09days on market $850,000 Active 134 DOM
-
2026-06-08days on market $850,000 Active 133 DOM
-
2026-06-07pricedays on market $850,000 Active 132 DOM
-
2026-06-04days on market $865,000 Active 129 DOM
-
2026-06-03days on market $865,000 Active 128 DOM
-
2026-06-02days on market $865,000 Active 127 DOM
-
2026-06-01days on market $865,000 Active 126 DOM
-
2026-05-31days on market $865,000 Active 125 DOM
-
2026-04-23status Active
-
2026-02-13price $865,000
-
2026-01-13$895,000 Active
ⓘ Source: listings_history table (triggers on properties + properties_extension) + one-shot
backfill from property_details.listing_events for pre-trigger history.
Climate risk First Street
- Flood 1/10 Low FEMA zone X (unshaded) · 0% chance over 30 yrs
- Wildfire 1/10 Low
- Heat 3/10 Moderate 6 d/yr ≥86°F today · 12 d/yr by 30 yrs out
- Wind 1/10 Low
- Air quality 7/10 Severe 11 unhealthy d/yr today · 12 by 30 yrs out
Nearby sold comps map
Loading sold comps map…
Walkable amenities ~0.75 mi
Loading nearby amenities…
Taxation est. · year 1
- Rental income
- $75,924
- − Mortgage interest
- −$47,613
- − Property taxes
- −$12,750
- − Insurance
- −$4,250
- − Repairs & maintenance
- −$6,074
- − Management
- −$6,074
- − HOA
- −$2,196
- − Depreciation
- −$24,727
- Taxable loss
- −$27,760
- Est. tax savings @ 24.0%
- +$6,662
- After-tax cash flow
- $-6,043/yr
For passive investors: Depreciation is non-cash, so a rental often shows a tax loss while cash-flowing — sheltering income. Rental losses are passive: they offset passive income freely, and up to $25,000/yr can offset ordinary (W-2) income if you actively participate and your MAGI is under $100k (phasing out to $0 by $150k); unused losses carry forward. On sale, claimed depreciation is recaptured at up to 25%, and gains may owe capital-gains tax (a 1031 exchange can defer both). Figures are a year-1 estimate at your 24.0% rate — not tax advice; consult a CPA.
Schools (NCES district)
- District
- Tacoma School District
- NCES district ID
- 5308700
- Math proficiency
- 40% ▬ 0.00%
- Reading proficiency
- 53% ▲ 1.00%
- Median HH income
- $52,467
- Composite
- 42.25/100
- National rank
- #6987
- State rank
- #169 of 291 in WA
Livability — Tacoma
- Score
- 78/100
- State rank
- #127
- US rank
- #2535
Category grades
Schools grade is shown separately in the Schools card above.
Census & demographics
- Census place
- Tacoma, WA
- County
- Pierce County · 788,257 people
- City population
- 212,935
- Metro
- Seattle-Tacoma-Bellevue, WA
- Population (ZIP)
- 35,754
- Household income
- $65,342
- Rent vs Own
- Severe rent burden
- 2169.0
Population outlook (Pierce County) Hauer SSP2
- Today (2025)
- 956,648 people
- By 2030
- 1,010,862 · +5.7%
- By 2040
- 1,113,170 · +16.4%
- By 2050
- 1,206,524 · +26.1%
- By 2075
- 1,436,425 · +50.2%
- By 2100
- 1,563,654 · +63.5%
Race, ethnicity, and origin ACS 2023
- Neighborhood character
- Highly diverse neighborhood (Simpson 0.77)
- Race & ethnicity
- White 40% Hispanic / Latino 19% Two or more races 17% Black 16% Asian 11% Pacific Islander 4% Native American 1%
- Hispanic origin (detail)
- Mexican 13% Puerto Rican 1%
- Common ancestry
- Portuguese 3% Scotch-Irish 2% Swedish 1%
- Foreign-born
- 21% · Canada, South Korea, Vietnam
- Languages at home
- 68% English-only · Spanish 13% Other Asian/Pacific 6% Korean 3%
Political lean MEDSL · Pierce
- 2024 margin
- D (+10.8) · D 53.9% · R 43.1% · Other 3.0%
- 2008→2024 swing
- -1.4pp toward R · 2008: 12.2pp · 2024: 10.8pp
- All cycles
- 2024: D+10.8 2020: D+11.2 2016: D+7.5 2012: D+11.0 2008: D+12.2
Not yet ingested
- Civics
- —
Market trends
- HPI YoY
- ▲ 45.01%
- Current HPI
- 1297.51
- Rent YoY
- ▲ 2.93%
- Metro
- Seattle-Tacoma-Bellevue, WA
- State GDP YoY
- ▲ 4.65%
- F500 in state
- 22
Industry mix (Fortune 500 HQ in WA)
| Industry | F500 HQs | Revenue |
|---|---|---|
| Retail | 2 | $269B |
|
||
| Technology / Retail | 1 | $638B |
|
||
| Technology | 1 | $245B |
|
||
| Telecommunications | 1 | $38B |
|
||
| Food / Beverage | 1 | $36B |
|
||
| Automotive / Trucks | 1 | $34B |
|
||
Price history
-3.4% since first listed3 events — show timeline
- 2026-04-23 Relisted — NWMLS as Distributed by MLS Grid
- 2026-02-13 Price Changed $865,000 NWMLS as Distributed by MLS Grid
- 2026-01-13 Listed $895,000 NWMLS as Distributed by MLS Grid
Cash-flow waterfall
monthlySold comps — $/sqft
last 12 mo · ≤1 miLoading sold comps…