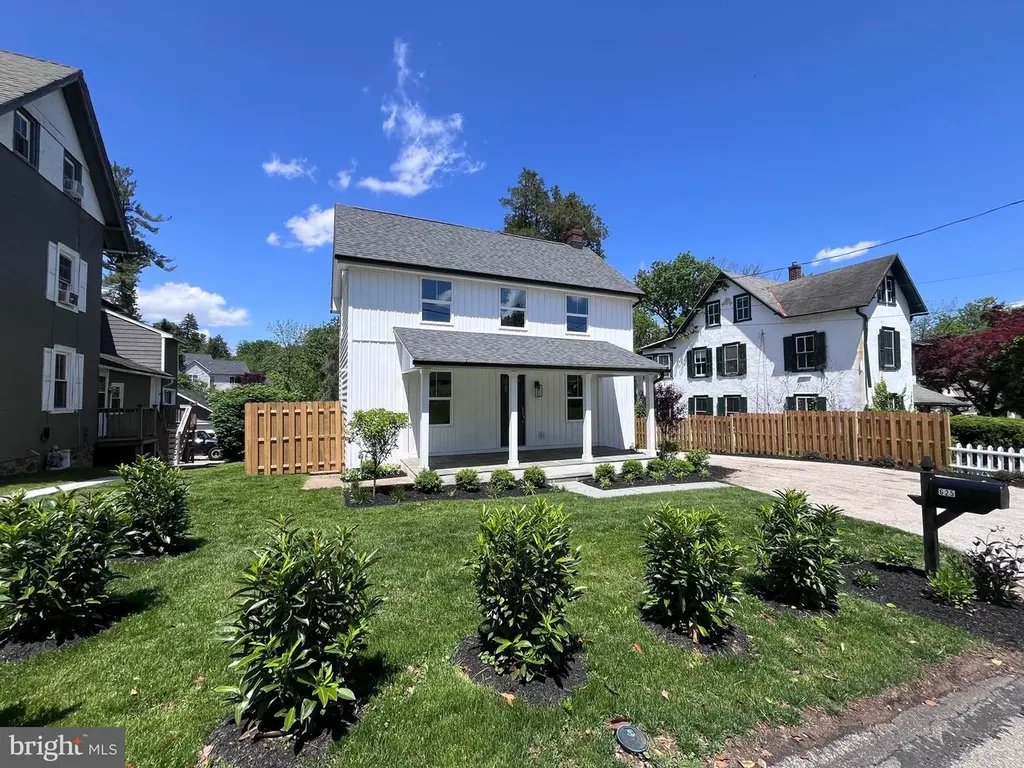
625 Conestoga Rd · St. Davids, PA
Flood risk 6/10 · Moderate
- FEMA flood zone
- X (unshaded)
- Chance of flooding over 30 yrs
- 0.71%
- Est. flood insurance / yr
- $473 – $860
Fire risk 1/10 · Minimal
- Est. fire insurance / yr
- $511 – $949
Heat risk 6/10 · Moderate
- Hot days now (above 101°F)
- 7 days/yr
- Hot days in 30 yrs
- 15 days/yr
Wind risk 6/10 · Moderate
- Chance of severe wind over 30 yrs
- 27.0%
Air-quality risk 3/10 · Minor
- Unhealthy air days now
- 3 days/yr
- Unhealthy air days in 30 yrs
- 5 days/yr
Risk factors via First Street. Map © Google.
Why this score? — see what drove the D grade
The composite is a weighted blend of 9 inputs, each scored 0–100. Each bar is that input's sub-score; the figure is the points it added to the 100-point composite (weight × sub-score).
- ARV discount +15.0/15.0
- Cash flow +7.3/30.0
- Schools +7.2/10.0
- Condition / age +4.0/5.0
- Rent growth +2.5/5.0
- Livability +2.5/5.0
- 1% rule +2.0/10.0
- DSCR +1.4/10.0
- Appreciation +0.0/10.0
$725,000
🖨 Deal sheet (PDF) 📄 Offer letter ✓ Due diligence
Listing remarks MLS
Recently renovated Farmhouse in Ithan Village in Villanova . House was taken down and rebuilt and has all new bathrooms, kitchen and floors. Yard is landscaped and fenced-in. Easy access to public transportation, highways, Villanova and downtown Wayne. Available immediately.
Key facts
- Landscaped yard
- Fenced-in yard
- 0.24 acre lot
Tags
Neighborhood map
What this means for you Summary
Snapshot
- This is a 3-bed/2.5-bath single-family listed at $725k. Condition is rated good.
Deal economics
- At list price, monthly cash flow is $-980 ($-12k/yr) — negative.
- To cash-flow at today's rent, offer at most $583k (19.6% below list).
- To meet the 1% rule (rent ≥ 1% of price), the offer needs to be $510k (29.6% below list).
- Recommended offer: $510k (29.6% below list) — sets the bar for 1% rule.
Location & tenants
- Location reads: area grade D — affects rentability + tenant quality, not the cash-flow math above.
- Radnor Township SD (suburban): math 72% / reading 86% proficiency, ranked #6 of 539 in PA (top 1%) — strong family-tenant draw, lease renewals of 3-5y typical; only 6% free/reduced lunch — higher-income household profile.
- Zoned schools: Radnor El Sch (math 75% / reading 91%, grade A+, #29 of 1,518 statewide, top 2%, 561 students, 11% FRL); Radnor Ms (math 63% / reading 87%, grade A, #6 of 512 statewide, top 1%, 828 students, 15% FRL); Radnor Shs (math 89%, 1,126 students, 15% FRL).
- Market conditions: 36 active listings in the ZIP; 3 comparable units currently listed for rent nearby; rentals leasing fast (median 0d on market — plan ~1-2 weeks tenant-placement turnaround); 299 units permitted in Delaware County in 2024 (5 in 5+ unit buildings).
Forward outlook
- Local home prices are declining (-3.0%/yr); year-one equity from $5k of loan paydown is wiped out by about $22k of value loss. Plan a longer hold.
Negotiation context
- It's been on market 110 days — a 9% lower offer ($660k) is reasonable based on typical stale-listing flexibility.
- 3 sale attempts with the ask held roughly flat each time — persistent listings suggest the price (not the market) is what's stuck; bring a comps-based counter.
Risks & watch-outs
- Watch-outs: built in 1850 — expect roof / HVAC / electrical / plumbing capex.
- Climate carrying-cost: major flood risk; major wind risk, 27% chance of damaging wind over 30y; extreme-heat days projected 7→15/yr by 2055 (HVAC capex compounding) — expect insurance premiums to compound above CPI over the hold.
Questions for the listing agent
- What do current leases actually rent for vs. the listed asking? Can we see a recent rent roll and the last 12 months of T-12 income?
- It's been on market 110 days. Have you received any prior offers? Is the seller open to a 30% concession, seller financing, or rate buy-down credit?
- Built in 1850 — when were the roof, HVAC, electrical panel, plumbing, and water heater last replaced?
- Why hasn't it sold? Are there any deal-killer items the seller is aware of (foundation, flood, title, zoning, code violations)?
- Is there a deadline driving the sale (1031 exchange, divorce, estate, relocation)? That informs how much negotiation room exists.
- The area grade is low — what's the realistic commute time and amenity access for the typical tenant pool here? Any planned neighborhood developments (good or bad) we should know about?
- What's the average days-on-market for RENTAL listings here right now (not sales)? A rising rental-DOM trend means longer vacancies and softer asking-rent achievability than the comps imply.
- What's the recent tenant-quality profile in this submarket — average credit score on applications, eviction rate, late-payment / NSF rate, and stable-employment percentage? A property-management company in the area should have these aggregated.
- How much new for-sale + rental construction is in the pipeline within 1–3 miles? Heavy new supply typically softens prices + rents 12–24 months out; constrained supply supports both.
Investment metrics
- 1% rule
- 0.70% ✗
- Cap rate
- 4.67%
- Cash-on-cash
- -5.79%
- DSCR
- 0.74
- GRM
- 11.8
CMA / ARV
- ARV (median comp)
- $900,897
- List price
- $725,000
- Delta
- -19.52%
- Verdict
- UNDERPRICED
- Comps
- 20 within 1.0 mi
Show comp detail 4 sales within ~0.75 mi
| Address | Dist | Beds/Ba | Sqft | Sold | Price | $/sf | Match |
|---|---|---|---|---|---|---|---|
| 168 Woodstock Rd | 0.51mi | 4/3.0 (+1) | 2,178 (-1%) | 8mo | $972,500 | $447 | 61 |
| 612 Brookside Ave | 0.69mi | 4/2.0 (+1) | 2,074 (-6%) | 1mo | $810,000 | $391 | 51 |
| 353 Oak Ter | 0.55mi | 3/2.0 | 2,074 (-6%) | 17mo | $800,000 | $386 | 48 |
| 447 Conestoga Rd | 0.67mi | 4/2.0 (+1) | 2,446 (+11%) | 12mo | $951,000 | $389 | 33 |
Match score weights: distance 35% · size 25% · config 20% · recency 20%. Top-matched comps best support the ARV.
Projected returns pro-forma
-3.0% appreciation · 3.0% rent growth · sell at horizon
- IRR
- -26.2%
- Equity multiple
- 0.11×
- Total profit
- $-179,828
- Equity at exit
- $108,100
- IRR
- -23.1%
- Equity multiple
- -0.17×
- Total profit
- $-236,659
- Equity at exit
- $62,685
Cash invested: $203,000 (down + closing). Projections, not guarantees.
Landlord ↔ Tenant lean methodology
- Overall (STATE)
- 62 Landlord-Friendly
- State Pennsylvania
- 62 Landlord-Friendly · EVEN
- County
- — inherits STATE
- City
- — inherits STATE
ZIP-level market 19085
- Active inventory
- 36
- Price-to-rent
- 11.8×
Monthly cashflow live
- Estimated rent
- $5,102 medium interval (Pro) →
- Mortgage (P&I)
- −$3,802
- Tax est. 1.5%
- −$906 /mo · $10,875/yr
- Insurance
- −$302
- HOA
- −$0
- Vacancy / Maint / Mgmt
- −$1,071
- Net cashflow
- $-980
Break-even live
Sensitivity live
| Price | -10% $-479 | -5% $-730 | +0% $-980 | +5% $-1,231 | +10% $-1,481 |
|---|---|---|---|---|---|
| Rent | -10% $-1,383 | -5% $-1,182 | +0% $-980 | +5% $-779 | +10% $-577 |
| Rate | -1.0pp $-615 | -0.5pp $-796 | base $-980 | +0.5pp $-1,168 | +1.0pp $-1,359 |
UW: 25.0% down · 7.5% · 30yr · 1.5% tax · 5.0% vac · 8.0% maint · 8.0% mgmt
Financing live
Cash to close
- Down payment
- $181,250
- Closing costs
- $21,750
- Reserves months
- —
- Total cash needed
- —
Loan-product check · same deal, 3 products live
Conventional
25% down · 7.5% · 30yr
- Down + closing
- —
- Monthly P&I
- —
- Monthly cashflow
- —
- DSCR
- —
- Eligible?
- —
Personal DTI + credit; lowest rate.
DSCR
20% down · 8.5% · 30yr
- Down + closing
- —
- Monthly P&I
- —
- Monthly cashflow
- —
- DSCR
- —
- Eligible?
- —
No personal income docs; deal must DSCR.
Hard money
10% down · 12.0% · 12mo
- Down + closing
- —
- Monthly P&I
- —
- Monthly cashflow
- —
- DSCR
- —
- Eligible?
- —
Short-term bridge; refi at stabilization.
Rent comps 3 comps
| Address | Beds | Baths | Sqft | Rent | $/sqft | DOM | Units | Dist |
|---|---|---|---|---|---|---|---|---|
| 313 Creek Dr St Davids, PA | 2.0–3.0 | 2.0 | 1263 | $3,700 | $2.93 | 0d | 6 | 0.49mi |
| 412 Yorkshire Rd Bryn Mawr, PA | 4.0 | 2.5 | 2224 | $5,375 | $2.42 | 0d | 1 | 1.10mi |
| 1 Haymarket Ln Bryn Mawr, PA | 3.0 | 4.5 | 2554 | $7,000 | $2.74 | 0d | 1 | 1.17mi |
Listing history 23 events
-
2026-06-21days on market $725,000 Active 110 DOM
-
2026-06-18days on market $725,000 Active 107 DOM
-
2026-06-17days on market $725,000 Active 106 DOM
-
2026-06-16days on market $725,000 Active 105 DOM
-
2026-06-15days on market $725,000 Active 104 DOM
-
2026-06-13days on market $725,000 Active 102 DOM
-
2026-06-09days on market $725,000 Active 98 DOM
-
2026-06-08days on market $725,000 Active 97 DOM
-
2026-06-07days on market $725,000 Active 96 DOM
-
2026-06-04days on market $725,000 Active 93 DOM
-
2026-06-03days on market $725,000 Active 92 DOM
-
2026-06-02days on market $725,000 Active 91 DOM
-
2026-06-01days on market $725,000 Active 90 DOM
-
2026-05-31days on market $725,000 Active 89 DOM
-
2026-04-10historical $5,500
-
2026-03-03$749,000 Active 275-char remark
Show marketing remark (275 chars)
Recently renovated Farmhouse in Ithan Village in Villanova . House was taken down and rebuilt and has all new bathrooms, kitchen and floors. Yard is landscaped and fenced-in. Easy access to public transportation, highways, Villanova and downtown Wayne. Available immediately.
-
2026-02-27historical
-
2026-01-30price $785,000
-
2026-01-09$5,500
-
2025-10-28price $799,000
-
2025-10-18price $849,000
-
2025-09-24price $879,000
-
2025-08-25$885,000 Active
ⓘ Source: listings_history table (triggers on properties + properties_extension) + one-shot
backfill from property_details.listing_events for pre-trigger history.
Climate risk First Street
- Flood 6/10 Major FEMA zone X (unshaded) · 71% chance over 30 yrs
- Wildfire 1/10 Low
- Heat 6/10 Major 7 d/yr ≥101°F today · 15 d/yr by 30 yrs out
- Wind 6/10 Major 27% chance of damaging wind over 30 yrs
- Air quality 3/10 Moderate 3 unhealthy d/yr today · 5 by 30 yrs out
Nearby sold comps map
Loading sold comps map…
Walkable amenities ~0.75 mi
Loading nearby amenities…
Taxation est. · year 1
- Rental income
- $61,218
- − Mortgage interest
- −$40,611
- − Property taxes
- −$10,875
- − Insurance
- −$3,625
- − Repairs & maintenance
- −$4,897
- − Management
- −$4,897
- − Depreciation
- −$21,091
- Taxable loss
- −$24,779
- Est. tax savings @ 24.0%
- +$5,947
- After-tax cash flow
- $-5,814/yr
For passive investors: Depreciation is non-cash, so a rental often shows a tax loss while cash-flowing — sheltering income. Rental losses are passive: they offset passive income freely, and up to $25,000/yr can offset ordinary (W-2) income if you actively participate and your MAGI is under $100k (phasing out to $0 by $150k); unused losses carry forward. On sale, claimed depreciation is recaptured at up to 25%, and gains may owe capital-gains tax (a 1031 exchange can defer both). Figures are a year-1 estimate at your 24.0% rate — not tax advice; consult a CPA.
Condition & rehab AI · 13 photos
This recently renovated farmhouse in Ithan Village is move-in ready with new finishes and landscaping, making it an attractive option for both resale and rental.
Value-add opportunities
- Both landscaping and fencing — enhances curb appeal and privacy
- Both exterior paint — fresh paint improves curb appeal and value
- Both interior paint — fresh paint enhances interior aesthetics and value
Renovation cost estimate screening
Value-add ROI direction
- Both landscaping and fencing — enhances curb appeal and privacy ↑
- Both exterior paint — fresh paint improves curb appeal and value ↑
- Both interior paint — fresh paint enhances interior aesthetics and value ↑
ⓘ Cost ranges are severity-bucket heuristics (US national rule-of-thumb). Get contractor quotes + a written scope before underwriting a rehab budget.
Schools (NCES district)
- District
- Radnor Township SD
- NCES district ID
- 4219920
- Math proficiency
- 72% ▼ -6.00%
- Reading proficiency
- 86% ▼ -2.00%
- Median HH income
- $99,773
- Composite
- 71.53/100
- National rank
- #223
- State rank
- #6 of 539 in PA
Livability — St. Davids
No livability data for this city. (Only ~50 U.S. cities are tracked.)
Census & demographics
- Population (ZIP)
- 10,679
Population outlook (Delaware County) Hauer SSP2
- Today (2025)
- 577,490 people
- By 2030
- 581,243 · +0.6%
- By 2040
- 584,700 · +1.2%
- By 2050
- 586,581 · +1.6%
- By 2075
- 598,706 · +3.7%
- By 2100
- 590,823 · +2.3%
Race, ethnicity, and origin ACS 2023
- Neighborhood character
- Predominantly White (76%)
- Race & ethnicity
- White 76% Asian 8% Two or more races 6% Hispanic / Latino 5% Black 5%
- Hispanic origin (detail)
- Common ancestry
- Romanian 6% Scotch-Irish 3% Slovak 2%
- Foreign-born
- 9% · Canada, Vietnam, South Korea
- Languages at home
- 84% English-only · Spanish 4% Other Indo-European 3% Vietnamese 2%
Political lean MEDSL · Delaware
- 2024 margin
- Strong D (+23.7) · D 61.4% · R 37.6% · Other 1.0%
- 2008→2024 swing
- +2.3pp toward D · 2008: 21.4pp · 2024: 23.7pp
- All cycles
- 2024: D+23.7 2020: D+26.7 2016: D+22.0 2012: D+21.8 2008: D+21.4
Not yet ingested
- Civics
- —
Market trends
- HPI YoY
- ▼ -355.53%
- Current HPI
- 286.5602
- Rent YoY
- —
- Metro
- —
- State GDP YoY
- ▲ 1.68%
- F500 in state
- 34
Industry mix (Fortune 500 HQ in PA)
| Industry | F500 HQs | Revenue |
|---|---|---|
| Healthcare | 2 | $309B |
|
||
| Insurance | 2 | $27B |
|
||
| Telecommunications / Media | 1 | $124B |
|
||
| Industrial Distribution | 1 | $22B |
|
||
| Financial Services | 1 | $20B |
|
||
| Chemicals / Materials | 1 | $18B |
|
||
Price history
-99.4% since first listed9 events — show timeline
- 2026-04-10 Rental Removed $5,500 BRIGHTMLS
- 2026-03-03 Listed $749,000 BRIGHT MLS
- 2026-02-27 Listing Removed — BRIGHT MLS
- 2026-01-30 Price Changed $785,000 BRIGHT MLS
- 2026-01-09 Listed for Rent $5,500 BRIGHTMLS
- 2025-10-28 Price Changed $799,000 BRIGHT MLS
- 2025-10-18 Price Changed $849,000 BRIGHT MLS
- 2025-09-24 Price Changed $879,000 BRIGHT MLS
- 2025-08-25 Listed $885,000 BRIGHT MLS
Cash-flow waterfall
monthlySold comps — $/sqft
last 12 mo · ≤1 miLoading sold comps…