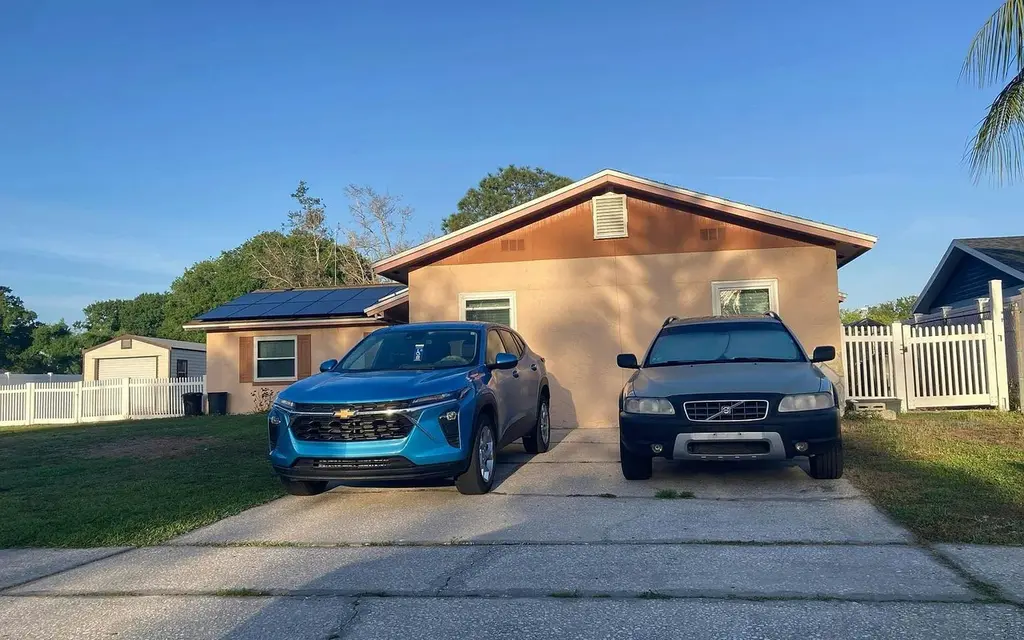
1002 Norman Ct · Brandon, FL
Flood risk 1/10 · Minimal
- FEMA flood zone
- X (unshaded)
- Chance of flooding over 30 yrs
- 0.0%
- Est. flood insurance / yr
- $507 – $1,088
Fire risk 1/10 · Minimal
- Est. fire insurance / yr
- $947 – $1,759
Heat risk 10/10 · Severe
- Hot days now (above 110°F)
- 7 days/yr
- Hot days in 30 yrs
- 25 days/yr
Wind risk 9/10 · Severe
- Chance of severe wind over 30 yrs
- 99.0%
Air-quality risk 4/10 · Minor
- Unhealthy air days now
- 4 days/yr
- Unhealthy air days in 30 yrs
- 4 days/yr
Risk factors via First Street. Map © Google.
Why this score? — see what drove the D+ grade
The composite is a weighted blend of 9 inputs, each scored 0–100. Each bar is that input's sub-score; the figure is the points it added to the 100-point composite (weight × sub-score).
- Cash flow +15.0/30.0
- ARV discount +7.5/15.0
- 1% rule +5.0/10.0
- DSCR +5.0/10.0
- Schools +4.2/10.0
- Livability +4.2/5.0
- Rent growth +2.5/5.0
- Condition / age +2.5/5.0
- Appreciation +0.0/10.0
$5,000
🖨 Deal sheet (PDF) 📄 Offer letter ✓ Due diligence
Listing remarks
Foreclosure Auction Ends May 26, 2026 at 10:00 AM EST. Discover this inviting 4-bedroom, 2-bathroom single-family home, offering a great opportunity in the desirable Brandon area. The list price is the opening bid for the online auction. Sold As-is. Explore more details and submit your bid through Federa.
Key facts
- Built 1975
- Listed 9 days
Property features AI
Exterior
- Home design: Residential property; Single-story (1 story)
- Exterior features: Lot approximately 0.22 acres; Zoned RSC-6
Interior
- Bathrooms: 2 full bathrooms
- Interior features: One-story interior
Neighborhood map
What this means for you Summary
Snapshot
- This is a 4-bed/2.0-bath single-family listed at $5k.
Deal economics
- At list price, monthly cash flow is $2k ($24k/yr) — positive.
- The deal already cash-flows at list — no discount required.
- Meets the 1% rule at list price ($3k rent vs $5k).
Location & tenants
- Location reads 85/100 on livability (#26 in FL, #507 nationally) — a professional / high-income tenant draw. Strengths: amenities A+, housing A+, health & safety A+.
- Hillsborough (suburban): math 47% / reading 50% proficiency, ranked #41 of 73 in FL (top 56%) — families likely to look elsewhere, expect single-tenant / working-renter base with shorter leases.
- Market conditions: Rents soft (-0.1%/yr); 151 active listings in the ZIP; 16 comparable units currently listed for rent nearby; rentals leasing fast (median 6d on market — plan ~1-2 weeks tenant-placement turnaround); 9,053 units permitted in Hillsborough County in 2024 (4,555 in 5+ unit buildings).
- This rent runs 41% of the median local income ($74k/yr) — at the standard rent-burdened threshold; future hikes will face affordability resistance.
Forward outlook
- Local home prices are declining (-3.0%/yr); year-one equity from $35 of loan paydown is wiped out by about $150 of value loss. Plan a longer hold.
- Hillsborough County population projected at +37% by 2050 — long-run rental-demand tailwind backs the buy-and-hold thesis.
- At projected returns (-3.0% appreciation + 0.0% rent growth), your $1k cash investment doubles in ~1 year — after that, you're playing with house money.
Negotiation context
- Only 9 days on market — expect competitive offers; lowballing is unlikely to land.
- 2 sale attempts since 5y ago with the ask held roughly flat each time — persistent listings suggest the price (not the market) is what's stuck; bring a comps-based counter.
Risks & watch-outs
- Climate carrying-cost: severe wind risk, 99% chance of damaging wind over 30y; extreme-heat days projected 7→25/yr by 2055 (HVAC capex compounding) — expect insurance premiums to compound above CPI over the hold.
Questions for the listing agent
- Built in 1975 — when were the roof, HVAC, electrical panel, plumbing, and water heater last replaced?
- Is there a deadline driving the sale (1031 exchange, divorce, estate, relocation)? That informs how much negotiation room exists.
- The area grade is low — what's the realistic commute time and amenity access for the typical tenant pool here? Any planned neighborhood developments (good or bad) we should know about?
- What's the average days-on-market for RENTAL listings here right now (not sales)? A rising rental-DOM trend means longer vacancies and softer asking-rent achievability than the comps imply.
- What's the recent tenant-quality profile in this submarket — average credit score on applications, eviction rate, late-payment / NSF rate, and stable-employment percentage? A property-management company in the area should have these aggregated.
- How much new for-sale + rental construction is in the pipeline within 1–3 miles? Heavy new supply typically softens prices + rents 12–24 months out; constrained supply supports both.
Investment metrics
- 1% rule
- 50.46% ✓
- Cap rate
- 476.36%
- Cash-on-cash
- 1678.79%
- DSCR
- 75.70
- GRM
- 0.2
CMA / ARV
No comps found within radius.
Projected returns pro-forma
-3.0% appreciation · 0.0% rent growth · sell at horizon
- IRR
- —
- Equity multiple
- 84.27×
- Total profit
- $116,578
- Equity at exit
- $746
- IRR
- —
- Equity multiple
- 167.94×
- Total profit
- $233,722
- Equity at exit
- $432
Cash invested: $1,400 (down + closing). Projections, not guarantees.
Landlord ↔ Tenant lean methodology
- Overall (STATE)
- 87 Strongly Landlord-Friendly
- State Florida
- 87 Strongly Landlord-Friendly · R+3
- County
- — inherits STATE
- City
- — inherits STATE
ZIP-level market 33510
- Home prices YoY
- -21.6%
- Rents YoY
- -0.1%
- Active inventory
- 151
- Price-to-rent
- 0.2×
Monthly cashflow live
- Estimated rent
- $2,523 high interval (Pro) →
- Mortgage (P&I)
- −$26
- Tax est. 1.5%
- −$6 /mo · $75/yr
- Insurance
- −$2
- HOA
- −$0
- Vacancy / Maint / Mgmt
- −$530
- Net cashflow
- $1,959
Break-even live
Sensitivity live
| Price | -10% $1,962 | -5% $1,960 | +0% $1,959 | +5% $1,957 | +10% $1,955 |
|---|---|---|---|---|---|
| Rent | -10% $1,759 | -5% $1,859 | +0% $1,959 | +5% $2,058 | +10% $2,158 |
| Rate | -1.0pp $1,961 | -0.5pp $1,960 | base $1,959 | +0.5pp $1,957 | +1.0pp $1,956 |
UW: 25.0% down · 7.5% · 30yr · 1.5% tax · 5.0% vac · 8.0% maint · 8.0% mgmt
Financing live
Cash to close
- Down payment
- $1,250
- Closing costs
- $150
- Reserves months
- —
- Total cash needed
- —
Loan-product check · same deal, 3 products live
Conventional
25% down · 7.5% · 30yr
- Down + closing
- —
- Monthly P&I
- —
- Monthly cashflow
- —
- DSCR
- —
- Eligible?
- —
Personal DTI + credit; lowest rate.
DSCR
20% down · 8.5% · 30yr
- Down + closing
- —
- Monthly P&I
- —
- Monthly cashflow
- —
- DSCR
- —
- Eligible?
- —
No personal income docs; deal must DSCR.
Hard money
10% down · 12.0% · 12mo
- Down + closing
- —
- Monthly P&I
- —
- Monthly cashflow
- —
- DSCR
- —
- Eligible?
- —
Short-term bridge; refi at stabilization.
Rent comps 16 comps
| Address | Beds | Baths | Sqft | Rent | $/sqft | DOM | Units | Dist |
|---|---|---|---|---|---|---|---|---|
| 906 Essex Rd Brandon, FL | 4.0 | 2.0 | 1642 | $2,500 | $1.52 | 12d | 1 | 0.16mi |
| 1008 York Ct Brandon, FL | 3.0 | 2.0 | 1296 | $2,400 | $1.85 | 19d | 1 | 0.17mi |
| 730 Straw Lake Dr Brandon, FL | 4.0 | 2.0 | 1883 | $2,950 | $1.57 | 25d | 1 | 0.59mi |
| 1110 Londonwood St Brandon, FL | 3.0 | 2.0 | 1564 | $2,540 | $1.62 | 16d | 1 | 0.60mi |
| 2162 Brandon Park Cir Brandon, FL | 3.0 | 2.0 | 1671 | $2,366 | $1.42 | 6d | 1 | 0.91mi |
| 609 Cedar Waxwing Dr Brandon, FL | 4.0 | 3.0 | 2404 | $2,800 | $1.16 | 4d | 1 | 0.97mi |
| 2119 Lennox Dale Ln Brandon, FL | 3.0 | 2.5 | 1536 | $2,095 | $1.36 | 6d | 1 | 1.08mi |
| 2136 Lennox Dale Ln Unit Main Brandon, FL | 3.0 | 2.0 | 1470 | $2,250 | $1.53 | 19d | 1 | 1.10mi |
| 1516 Blue Magnolia Rd Brandon, FL | 3.0 | 3.0 | 1638 | $2,330 | $1.42 | 2d | 1 | 1.14mi |
| 1513 Deer Tree Ln Brandon, FL | 3.0 | 2.5 | 1508 | $2,000 | $1.33 | 0d | 1 | 1.16mi |
| 1805 Lake Crest Ave Brandon, FL | 3.0 | 2.0 | 1908 | $2,345 | $1.23 | 3d | 1 | 1.19mi |
| 10151 Iris Crosstown Dr Tampa, FL | 1.0–3.0 | 1.0–2.0 | 1032 | $2,441 | $2.36 | 0d | 79 | 1.34mi |
| 2047 Sarah Louise Dr Brandon, FL | 3.0 | 2.0 | 1290 | $2,235 | $1.73 | 2d | 1 | 1.35mi |
| 1112 Andrew Aviles Cir Tampa, FL | 3.0 | 2.5 | 1832 | $2,395 | $1.31 | 21d | 1 | 1.36mi |
| 1218 Windsor Cir Brandon, FL | 4.0 | 2.0 | 1400 | $1,949 | $1.39 | 4d | 1 | 1.40mi |
| 1326 Corner Oaks Dr Brandon, FL | 4.0 | 2.5 | 2217 | $3,400 | $1.53 | 6d | 1 | 1.49mi |
Listing history 5 events
-
2026-05-15$5,000 Active 306-char remark
-
2021-02-22historical
-
2021-02-16$199,000 Active
-
1983-05-01soldstatus $53,000
-
1978-08-01soldstatus $40,100
ⓘ Source: listings_history table (triggers on properties + properties_extension) + one-shot
backfill from property_details.listing_events for pre-trigger history.
Climate risk First Street
- Flood 1/10 Low FEMA zone X (unshaded) · 0% chance over 30 yrs
- Wildfire 1/10 Low
- Heat 10/10 Extreme 7 d/yr ≥110°F today · 25 d/yr by 30 yrs out
- Wind 9/10 Extreme 99% chance of damaging wind over 30 yrs
- Air quality 4/10 Moderate 4 unhealthy d/yr today · 4 by 30 yrs out
Nearby sold comps map
Loading sold comps map…
Walkable amenities ~0.75 mi
Loading nearby amenities…
Taxation est. · year 1
- Rental income
- $30,276
- − Mortgage interest
- −$280
- − Property taxes
- −$75
- − Insurance
- −$25
- − Repairs & maintenance
- −$2,422
- − Management
- −$2,422
- − Depreciation
- −$145
- Taxable income
- $24,906
- Est. tax owed @ 24.0%
- −$5,977
- After-tax cash flow
- $17,526/yr
For passive investors: Depreciation is non-cash, so a rental often shows a tax loss while cash-flowing — sheltering income. Rental losses are passive: they offset passive income freely, and up to $25,000/yr can offset ordinary (W-2) income if you actively participate and your MAGI is under $100k (phasing out to $0 by $150k); unused losses carry forward. On sale, claimed depreciation is recaptured at up to 25%, and gains may owe capital-gains tax (a 1031 exchange can defer both). Figures are a year-1 estimate at your 24.0% rate — not tax advice; consult a CPA.
Schools (NCES district)
- District
- Hillsborough
- NCES district ID
- 1200870
- Math proficiency
- 47% ▼ -8.00%
- Reading proficiency
- 50% ▼ -4.00%
- Median HH income
- $50,622
- Composite
- 41.6/100
- National rank
- #3435
- State rank
- #41 of 73 in FL
Livability — Brandon
- Score
- 85/100
- State rank
- #26
- US rank
- #507
Category grades
Schools grade is shown separately in the Schools card above.
Census & demographics
- Census place
- Brandon, FL
- County
- Hillsborough County · 1,540,968 people
- City population
- 92,716
- Metro
- Tampa-St. Petersburg-Clearwater, FL
- Population (ZIP)
- 30,578
- Household income
- $74,245
- Rent vs Own
- Severe rent burden
- 1192.0
Population outlook (Hillsborough County) Hauer SSP2
- Today (2025)
- 1,607,022 people
- By 2030
- 1,733,968 · +7.9%
- By 2040
- 1,979,565 · +23.2%
- By 2050
- 2,203,427 · +37.1%
- By 2075
- 2,667,893 · +66.0%
- By 2100
- 2,891,558 · +79.9%
Race, ethnicity, and origin ACS 2023
- Neighborhood character
- Diverse neighborhood (Simpson 0.69)
- Race & ethnicity
- White 40% Hispanic / Latino 34% Black 16% Two or more races 16% Asian 5%
- Hispanic origin (detail)
- Mexican 4% Puerto Rican 14% Cuban 7% Dominican 3%
- Common ancestry
- Romanian 2% Lithuanian 2% Hispanic 2%
- Foreign-born
- 18% · Canada, Jamaica, Vietnam
- Languages at home
- 68% English-only · Spanish 25% Other Indo-European 3% Tagalog/Filipino 1%
Political lean MEDSL · Hillsborough
- 2024 margin
- Toss-up / Even · D 47.8% · R 50.9% · Other 1.3%
- 2008→2024 swing
- -10.2pp toward R · 2008: 7.1pp · 2024: -3.1pp
- All cycles
- 2024: R+3.1 2020: D+6.9 2016: D+6.8 2012: D+6.7 2008: D+7.1
Not yet ingested
- Civics
- —
Market trends
- HPI YoY
- ▼ -90.54%
- Current HPI
- 328.43
- Rent YoY
- ▬ -0.05%
- Metro
- Tampa-St. Petersburg-Clearwater, FL
- State GDP YoY
- ▲ 3.28%
- F500 in state
- 36
Industry mix (Fortune 500 HQ in FL)
| Industry | F500 HQs | Revenue |
|---|---|---|
| Industrial Technology | 2 | $29B |
|
||
| Insurance | 2 | $17B |
|
||
| Retail | 1 | $60B |
|
||
| Technology Distribution | 1 | $58B |
|
||
| Homebuilding | 1 | $35B |
|
||
| Technology Manufacturing | 1 | $35B |
|
||
Price history
-87.5% since first listed5 events — show timeline
- 2026-05-15 Listed $5,000 NFMLS
- 2021-02-22 Listing Removed — Stellar MLS as Distributed by MLS Grid
- 2021-02-16 Listed $199,000 Stellar MLS as Distributed by MLS Grid
- 1983-05-01 Sold (Public Records) $53,000 Public Records
- 1978-08-01 Sold (Public Records) $40,100 Public Records
Property tax history
+3.3%/yrLatest (2025): $1,757 · +8.0% YoY. Source: county tax records.
Cash-flow waterfall
monthlySold comps — $/sqft
last 12 mo · ≤1 miLoading sold comps…