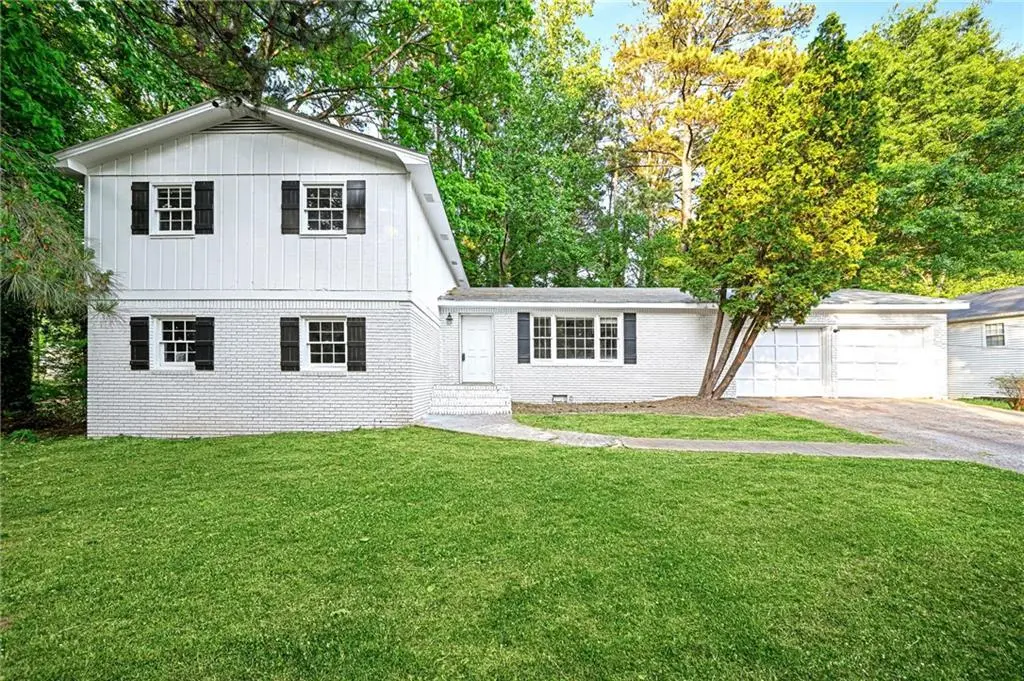
298 W Wind Dr SW · Mountain Park, GA
Flood risk 1/10 · Minimal
- FEMA flood zone
- X (unshaded)
- Chance of flooding over 30 yrs
- 0.0%
- Est. flood insurance / yr
- $473 – $860
Fire risk 3/10 · Minor
- Est. fire insurance / yr
- $963 – $1,789
Heat risk 5/10 · Moderate
- Hot days now (above 103°F)
- 7 days/yr
- Hot days in 30 yrs
- 17 days/yr
Wind risk 5/10 · Moderate
- Chance of severe wind over 30 yrs
- 25.0%
Air-quality risk 5/10 · Moderate
- Unhealthy air days now
- 5 days/yr
- Unhealthy air days in 30 yrs
- 9 days/yr
Risk factors via First Street. Map © Google.
Why this score? — see what drove the D+ grade
The composite is a weighted blend of 9 inputs, each scored 0–100. Each bar is that input's sub-score; the figure is the points it added to the 100-point composite (weight × sub-score).
- ARV discount +15.0/15.0
- Cash flow +13.0/30.0
- DSCR +3.9/10.0
- 1% rule +3.7/10.0
- Schools +3.7/10.0
- Livability +3.7/5.0
- Rent growth +2.8/5.0
- Condition / age +2.5/5.0
- Appreciation +0.0/10.0
$280,000
🖨 Deal sheet (PDF) 📄 Offer letter ✓ Due diligence
Listing remarks
Investor Opportunity | Parkview High School District | Four Winds | Lilburn, GA An exceptional opportunity in one of Gwinnett County's most desirable school districts. Situated in the established Four Winds community, this 4-sided brick home is priced significantly below neighborhood comparables, making it an ideal acquisition for investors or owner-occupants ready to build immediate equity. Conveniently positioned with quick access to I-85 and Atlanta and just minutes from Old Town Lilburn's shops, dining, and community events. Outdoor enthusiasts will appreciate the proximity to Mountain Park, Stone Mountain Park, Bethesda Park & Aquatic Center, and the Camp Creek Greenway Trail- am
Key facts
- 0.5 acre lot
- 2 garage spots
- Built 1973
Property features AI
Finance
- HOA & community: Near schools, shopping, and trails/greenway
Exterior
- Parking: Two-car garage; Driveway parking; Garage faces front; Total of six parking spaces; Open parking available
- Utilities: Public water; Septic tank sewer; 220-volt outlet in laundry; Cable available; Electricity available
- Home design: Multi/split levels; Fee simple ownership
- Construction: Brick 4 sides and HardiPlank-type siding; Composition shingle roof; Brick/mortar foundation; Resale property
- Exterior features: Rear porch; Back yard fencing (chain link and wood); Fenced yard
Interior
- Kitchen: Dishwasher; Electric range; Refrigerator
- Bedrooms: Three upper-level bedrooms; One lower-level bedroom; Bedroom features: none specified
- Flooring: Carpet; Laminate
- Bathrooms: Two full bathrooms; Master bathroom with shower only
- Heating & cooling: Electric heating; Central electric air conditioning
- Interior features: Walk-in closet(s); One fireplace located in the living room; No shared/common walls; Bonus room and family room
- Laundry & utility: Laundry located in the garage
Neighborhood map
What this means for you Summary
Snapshot
- This is a 3-bed/2.0-bath single-family listed at $280k.
Deal economics
- At list price, monthly cash flow is $-18 ($-215/yr) — negative.
- To cash-flow at today's rent, offer at most $277k (1.1% below list).
- To meet the 1% rule (rent ≥ 1% of price), the offer needs to be $245k (12.6% below list).
- Recommended offer: $245k (12.6% below list) — sets the bar for 1% rule.
- Cap rate 6.2% vs local median 3.9% in Mountain Park — top-decile yield for the area; either an underpriced asset or a hidden risk that comps aren't pricing in. Stress-test before assuming the spread holds.
Location & tenants
- Location reads 73/100 on livability (#54 in GA) — a middle-class / working-renter tenant base. Strengths: employment A+, housing A+, crime B+; Watch: amenities D-, commute F.
- Gwinnett County (suburban): math 39% / reading 43% proficiency, ranked #32 of 174 in GA (top 18%) — families likely to look elsewhere, expect single-tenant / working-renter base with shorter leases.
- Zoned schools: Arcado Elementary School (math 38% / reading 45%, grade F, #402 of 1,228 statewide, top 33%, 977 students, 52% FRL); Trickum Middle School (math 32% / reading 41%, grade F, #167 of 470 statewide, top 38%, 2,148 students, 52% FRL); Parkview High School (math 17% / reading 22%, grade F, #243 of 424 statewide, top 59%, 3,262 students, 45% FRL) — zoned schools at 50% FRL track the district average.
- Market conditions: Rents rising (+1.1%/yr); 352 active listings in the ZIP; 12 comparable units currently listed for rent nearby; rentals at typical pace (median 24d on market — plan ~3-4 weeks tenant-placement turnaround); solid renter incomes; 5,607 units permitted in Gwinnett County in 2024 (1,277 in 5+ unit buildings).
- This rent runs 33% of the median local income ($89k/yr) — at the standard rent-burdened threshold; future hikes will face affordability resistance.
Forward outlook
- Local home prices are declining (-3.0%/yr); year-one equity from $2k of loan paydown is wiped out by about $8k of value loss. Plan a longer hold.
- Gwinnett County population projected at +47% by 2050 — long-run rental-demand tailwind backs the buy-and-hold thesis.
Negotiation context
- Only 8 days on market — expect competitive offers; lowballing is unlikely to land.
- 2 sale attempts with the ask held roughly flat each time — persistent listings suggest the price (not the market) is what's stuck; bring a comps-based counter.
- Current owner paid $64k; list at $280k implies a 340% gain — meaningful room to come down on a strong offer.
Risks & watch-outs
- Climate carrying-cost: moderate wind risk, 25% chance of damaging wind over 30y; extreme-heat days projected 7→17/yr by 2055 (HVAC capex compounding) — expect insurance premiums to compound above CPI over the hold.
Questions for the listing agent
- What do current leases actually rent for vs. the listed asking? Can we see a recent rent roll and the last 12 months of T-12 income?
- Built in 1973 — when were the roof, HVAC, electrical panel, plumbing, and water heater last replaced?
- Is there a deadline driving the sale (1031 exchange, divorce, estate, relocation)? That informs how much negotiation room exists.
- Schools are D-rated, which usually means shorter tenancies and higher turnover. Who's the typical renter profile here, and what's been the actual vacancy rate?
- The area grade is low — what's the realistic commute time and amenity access for the typical tenant pool here? Any planned neighborhood developments (good or bad) we should know about?
- What's the average days-on-market for RENTAL listings here right now (not sales)? A rising rental-DOM trend means longer vacancies and softer asking-rent achievability than the comps imply.
- What's the recent tenant-quality profile in this submarket — average credit score on applications, eviction rate, late-payment / NSF rate, and stable-employment percentage? A property-management company in the area should have these aggregated.
- How much new for-sale + rental construction is in the pipeline within 1–3 miles? Heavy new supply typically softens prices + rents 12–24 months out; constrained supply supports both.
Investment metrics
- 1% rule
- 0.87% ✗
- Cap rate
- 6.22%
- Cash-on-cash
- -0.27%
- DSCR
- 0.99
- GRM
- 9.5
CMA / ARV
- ARV (on-the-fly)
- $368,000
- Comps found
- 12
Show comp detail 12 sales within ~0.75 mi
| Address | Dist | Beds/Ba | Sqft | Sold | Price | $/sf | Match |
|---|---|---|---|---|---|---|---|
| 298 W Wind Dr SW | 0.00mi | 4/2.0 (+1) | 2,000 (0%) | 1mo | $270,000 | $135 | 94 |
| 5813 Four Winds Dr SW | 0.14mi | 3/2.5 | 2,175 (+9%) | 2mo | $400,000 | $184 | 75 |
| 5904 Four Winds Dr SW | 0.34mi | 3/2.0 | 1,806 (-10%) | 2mo | $382,000 | $212 | 66 |
| 358 W Wind Dr SW | 0.17mi | 3/2.0 | 1,734 (-13%) | 5mo | $340,000 | $196 | 65 |
| 262 Harmony Grove Rd | 0.33mi | 3/2.0 | 1,779 (-11%) | 2mo | $330,000 | $185 | 65 |
| 5642 Breezy Ct SW | 0.19mi | 3/2.5 | 1,710 (-14%) | 0mo | $326,000 | $191 | 65 |
| 206 Hauteur Pl SW | 0.47mi | 3/2.5 | 2,056 (+3%) | 9mo | $317,500 | $154 | 64 |
| 224 Abri Pl | 0.40mi | 4/2.5 (+1) | 2,095 (+5%) | 4mo | $293,000 | $140 | 63 |
| 5633 Breezy Ct SW | 0.19mi | 3/2.0 | 1,707 (-15%) | 6mo | $311,000 | $182 | 62 |
| 372 Nalley Dr | 0.55mi | 4/2.5 (+1) | 2,014 (+1%) | 8mo | $215,000 | $107 | 60 |
| 5221 La Paloma Dr SW | 0.67mi | 4/2.5 (+1) | 1,912 (-4%) | 2mo | $370,000 | $194 | 53 |
| 5825 Golden West Trl SW | 0.72mi | 4/3.0 (+1) | 2,152 (+8%) | 2mo | $330,000 | $153 | 43 |
Match score weights: distance 35% · size 25% · config 20% · recency 20%. Top-matched comps best support the ARV.
Projected returns pro-forma
-3.0% appreciation · 1.12% rent growth · sell at horizon
- IRR
- -18.9%
- Equity multiple
- 0.35×
- Total profit
- $-51,009
- Equity at exit
- $41,749
- IRR
- -15.7%
- Equity multiple
- 0.19×
- Total profit
- $-63,649
- Equity at exit
- $24,209
Cash invested: $78,400 (down + closing). Projections, not guarantees.
Landlord ↔ Tenant lean methodology
- Overall (STATE)
- 90 Strongly Landlord-Friendly
- State Georgia
- 90 Strongly Landlord-Friendly · R+3
- County
- — inherits STATE
- City
- — inherits STATE
ZIP-level market 30047
- Rents YoY
- 1.1%
- Active inventory
- 352
- Price-to-rent
- 9.5×
Monthly cashflow live
- Estimated rent
- $2,447 high interval (Pro) →
- Mortgage (P&I)
- −$1,468
- Tax from tax record
- −$366 /mo · $4,391/yr
- Insurance
- −$117
- HOA
- −$0
- Vacancy / Maint / Mgmt
- −$514
- Net cashflow
- $-18
Break-even live
Sensitivity live
| Price | -10% $141 | -5% $61 | +0% $-18 | +5% $-97 | +10% $-176 |
|---|---|---|---|---|---|
| Rent | -10% $-211 | -5% $-115 | +0% $-18 | +5% $79 | +10% $175 |
| Rate | -1.0pp $123 | -0.5pp $53 | base $-18 | +0.5pp $-90 | +1.0pp $-164 |
UW: 25.0% down · 7.5% · 30yr · 1.5% tax · 5.0% vac · 8.0% maint · 8.0% mgmt
Financing live
Cash to close
- Down payment
- $70,000
- Closing costs
- $8,400
- Reserves months
- —
- Total cash needed
- —
Loan-product check · same deal, 3 products live
Conventional
25% down · 7.5% · 30yr
- Down + closing
- —
- Monthly P&I
- —
- Monthly cashflow
- —
- DSCR
- —
- Eligible?
- —
Personal DTI + credit; lowest rate.
DSCR
20% down · 8.5% · 30yr
- Down + closing
- —
- Monthly P&I
- —
- Monthly cashflow
- —
- DSCR
- —
- Eligible?
- —
No personal income docs; deal must DSCR.
Hard money
10% down · 12.0% · 12mo
- Down + closing
- —
- Monthly P&I
- —
- Monthly cashflow
- —
- DSCR
- —
- Eligible?
- —
Short-term bridge; refi at stabilization.
Rent comps 12 comps
| Address | Beds | Baths | Sqft | Rent | $/sqft | DOM | Units | Dist |
|---|---|---|---|---|---|---|---|---|
| 5659 Fern Creek Dr SW Lilburn, GA | 4.0 | 3.0 | 2627 | $2,351 | $0.89 | 0d | 1 | 0.70mi |
| 220 Cross Creek Dr Lilburn, GA | 4.0 | 2.0 | 2321 | $2,800 | $1.21 | 25d | 1 | 0.84mi |
| 5594 Laurel Ln NW Lilburn, GA | 3.0 | 2.0 | 1599 | $1,900 | $1.19 | 23d | 1 | 1.07mi |
| 5876 Rue Villa Ln Tucker, GA | 4.0 | 2.5 | 2507 | $2,945 | $1.17 | 6d | 1 | 1.20mi |
| 5556 Rock Garden Ct NW Lilburn, GA | 4.0 | 2.0 | 2244 | $1,899 | $0.85 | 45d | 1 | 1.27mi |
| 5621 Shadow View Dr Stone Mountain, GA | 4.0 | 2.5 | 2612 | $3,200 | $1.23 | 25d | 1 | 1.39mi |
| 5704 Urban Village Way Tucker, GA | 4.0 | 2.5 | 2351 | $2,900 | $1.23 | 4d | 1 | 1.41mi |
| 337 Bradley Woods Ct NW Lilburn, GA | 3.0 | 1.5 | 2432 | $1,800 | $0.74 | 45d | 1 | 1.43mi |
| 337 Bradley Woods Ct NW Unit A Lilburn, GA | 3.0 | 1.5 | 2432 | $1,800 | $0.74 | 25d | 1 | 1.43mi |
| 337 Bradley Woods Ct NW Lilburn, GA | 3.0 | 1.5 | 2432 | $1,800 | $0.74 | 16d | 1 | 1.43mi |
| 6204 Kenbrook Dr Tucker, GA | 4.0 | 3.5 | 2375 | $2,950 | $1.24 | 6d | 1 | 1.45mi |
| 6208 Kenbrook Dr Tucker, GA | 4.0 | 3.5 | 2375 | $2,950 | $1.24 | 6d | 1 | 1.46mi |
Listing history 6 events
-
2026-05-01status Pending
-
2026-04-29status Active
-
2026-04-28historical Active Under Contract
-
2026-04-23$280,000 Active
-
2026-04-20historical $280,000
-
1983-01-24soldstatus $63,700
ⓘ Source: listings_history table (triggers on properties + properties_extension) + one-shot
backfill from property_details.listing_events for pre-trigger history.
Tax reassessment forecast GA · Resets to sale price
- Current annual tax
- $4,391 · $366/mo
- Projected year-2 tax
- $4,391 · $366/mo
- Expected delta
- $0/yr ($0/mo · 0.0%)
ⓘ Screening estimate from a state-policy table — verify with the county assessor before closing.
Climate risk First Street
- Flood 1/10 Low FEMA zone X (unshaded) · 0% chance over 30 yrs
- Wildfire 3/10 Moderate
- Heat 5/10 Major 7 d/yr ≥103°F today · 17 d/yr by 30 yrs out
- Wind 5/10 Major 25% chance of damaging wind over 30 yrs
- Air quality 5/10 Major 5 unhealthy d/yr today · 9 by 30 yrs out
Nearby sold comps map
Loading sold comps map…
Walkable amenities ~0.75 mi
Loading nearby amenities…
Taxation est. · year 1
- Rental income
- $29,363
- − Mortgage interest
- −$15,684
- − Property taxes
- −$4,391
- − Insurance
- −$1,400
- − Repairs & maintenance
- −$2,349
- − Management
- −$2,349
- − Depreciation
- −$8,145
- Taxable loss
- −$4,956
- Est. tax savings @ 24.0%
- +$1,189
- After-tax cash flow
- $975/yr
For passive investors: Depreciation is non-cash, so a rental often shows a tax loss while cash-flowing — sheltering income. Rental losses are passive: they offset passive income freely, and up to $25,000/yr can offset ordinary (W-2) income if you actively participate and your MAGI is under $100k (phasing out to $0 by $150k); unused losses carry forward. On sale, claimed depreciation is recaptured at up to 25%, and gains may owe capital-gains tax (a 1031 exchange can defer both). Figures are a year-1 estimate at your 24.0% rate — not tax advice; consult a CPA.
Schools (NCES district)
- District
- Gwinnett County
- NCES district ID
- 1302550
- Math proficiency
- 39% ▼ -15.00%
- Reading proficiency
- 43% ▼ -10.00%
- Median HH income
- $62,416
- Composite
- 36.5/100
- National rank
- #4648
- State rank
- #32 of 174 in GA
Livability — Mountain Park
- Score
- 73/100
- State rank
- #54
- US rank
- #5313
Category grades
Schools grade is shown separately in the Schools card above.
Census & demographics
- Census place
- Mountain Park, GA
- County
- Gwinnett County · 952,346 people
- Metro
- Atlanta-Sandy Springs-Alpharetta, GA
- Population (ZIP)
- 70,121
- Household income
- $88,652
- Rent vs Own
- Severe rent burden
- 1545.0
Population outlook (Gwinnett County) Hauer SSP2
- Today (2025)
- 1,106,028 people
- By 2030
- 1,211,414 · +9.5%
- By 2040
- 1,422,277 · +28.6%
- By 2050
- 1,623,204 · +46.8%
- By 2075
- 2,105,240 · +90.3%
- By 2100
- 2,443,321 · +120.9%
Race, ethnicity, and origin ACS 2023
- Neighborhood character
- Highly diverse neighborhood (Simpson 0.76)
- Race & ethnicity
- Hispanic / Latino 30% White 30% Black 19% Two or more races 18% Asian 16%
- Hispanic origin (detail)
- Mexican 14% Puerto Rican 1%
- Common ancestry
- Italian 2% Slovak 2% Lithuanian 1%
- Foreign-born
- 31% · Canada, Vietnam, China
- Languages at home
- 52% English-only · Spanish 27% Vietnamese 6% Other Indo-European 5%
Political lean MEDSL · Gwinnett
- 2024 margin
- D (+16.5) · D 57.6% · R 41.1% · Other 1.2%
- 2008→2024 swing
- +26.8pp toward D · 2008: -10.2pp · 2024: 16.5pp
- All cycles
- 2024: D+16.5 2020: D+18.3 2016: D+5.8 2012: R+9.4 2008: R+10.2
Not yet ingested
- Civics
- —
Market trends
- HPI YoY
- ▼ -263.06%
- Current HPI
- 230.9036
- Rent YoY
- ▲ 1.12%
- Metro
- Atlanta-Sandy Springs-Alpharetta, GA
- State GDP YoY
- ▲ 2.66%
- F500 in state
- 28
Industry mix (Fortune 500 HQ in GA)
| Industry | F500 HQs | Revenue |
|---|---|---|
| Paper / Packaging | 2 | $29B |
|
||
| Retail | 1 | $160B |
|
||
| Transportation / Logistics | 1 | $91B |
|
||
| Airlines | 1 | $62B |
|
||
| Consumer Goods | 1 | $47B |
|
||
| Utilities | 1 | $25B |
|
||
Price history
+339.6% since first listed6 events — show timeline
- 2026-05-01 Pending — FMLS
- 2026-04-29 Relisted — FMLS
- 2026-04-28 Contingent — FMLS
- 2026-04-23 Listed $280,000 FMLS
- 2026-04-20 Coming Soon $280,000 FMLS
- 1983-01-24 Sold (Public Records) $63,700 Public Records
Property tax history
+4.7%/yrLatest (2025): $4,391 · -1.0% YoY. Source: county tax records.
Cash-flow waterfall
monthlySold comps — $/sqft
last 12 mo · ≤1 miLoading sold comps…