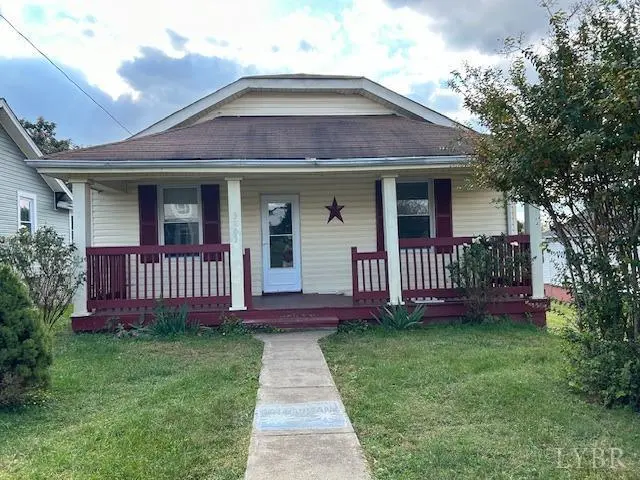
3203 Nelson St · Lynchburg, VA
Flood risk 1/10 · Minimal
- FEMA flood zone
- X (unshaded)
- Chance of flooding over 30 yrs
- 0.0%
- Est. flood insurance / yr
- $473 – $860
Fire risk 4/10 · Minor
- Est. fire insurance / yr
- $666 – $1,236
Heat risk 6/10 · Moderate
- Hot days now (above 101°F)
- 7 days/yr
- Hot days in 30 yrs
- 17 days/yr
Wind risk 2/10 · Minimal
- Chance of severe wind over 30 yrs
- 3.0%
Air-quality risk 2/10 · Minimal
- Unhealthy air days now
- 0 days/yr
- Unhealthy air days in 30 yrs
- 1 days/yr
Risk factors via First Street. Map © Google.
Why this score? — see what drove the D grade
The composite is a weighted blend of 9 inputs, each scored 0–100. Each bar is that input's sub-score; the figure is the points it added to the 100-point composite (weight × sub-score).
- Cash flow +14.8/30.0
- ARV discount +6.0/15.0
- DSCR +4.5/10.0
- Livability +4.5/5.0
- Schools +4.0/10.0
- 1% rule +3.1/10.0
- Rent growth +2.8/5.0
- Condition / age +2.5/5.0
- Appreciation +0.0/10.0
$150,000
🖨 Deal sheet (PDF) 📄 Offer letter ✓ Due diligence
Listing remarks
Don't miss this 2 Bedroom 1 Bath home with large Kitchen and separate dining room. Interior has been repainted. All major appliances convey. A large covered front porch and full basement are a plus. Roof installation complete in Jan 2025. This home has off street parking and a Storage Building. Large lot has fenced garden area. Lot backs up to city park with basketball court and playground equipment.
Key facts
- Off street parking
- Separate dining room
- Storage building
Tags
Property features AI
Exterior
- Parking: Off-street parking
- Utilities: Public water; Public sewer
- Home design: Single-family residence; One story
- Construction: Vinyl siding; Shingle roof; Built with full basement
- Exterior features: Garden; Deck; Porch; Storage structure
Interior
- Kitchen: Gas range; Refrigerator; Dishwasher
- Flooring: Vinyl flooring; Wood flooring
- Bathrooms: 1 full bathroom
- Heating & cooling: Heat pump
- Interior features: Accessible full bathroom; Garden; Deck and porch; Storm door(s)
- Laundry & utility: Washer and dryer included; Washer hookup in basement; Laundry in basement; Full basement with sump pump
Neighborhood map
What this means for you Summary
Snapshot
- This is a 2-bed/1.0-bath single-family listed at $150k.
Deal economics
- At list price, monthly cash flow is $41 ($492/yr) — positive.
- The deal already cash-flows at list — no discount required.
- To meet the 1% rule (rent ≥ 1% of price), the offer needs to be $122k (18.5% below list).
- Recommended offer: $122k (18.5% below list) — sets the bar for 1% rule.
- Cap rate 6.6% vs local median 4.0% in Lynchburg — top-decile yield for the area; either an underpriced asset or a hidden risk that comps aren't pricing in. Stress-test before assuming the spread holds.
Location & tenants
- Location reads 91/100 on livability (#1 in VA, #58 nationally) — a professional / high-income tenant draw. Strengths: amenities A+, commute A+, cost of living A+; Watch: crime C-, employment D+.
- Lynchburg City Public School District (urban): math 36% / reading 61% proficiency, ranked #104 of 131 in VA (top 79%) — families likely to look elsewhere, expect single-tenant / working-renter base with shorter leases; 61% free/reduced lunch — lower-income household profile, screen leases tightly.
- Zoned schools: William M. Bass Elementary (math 22% / reading 42%, grade F, #992 of 1,108 statewide, top 90%, 175 students, 91% FRL); Sandusky Middle (math 29% / reading 52%, grade F, #303 of 342 statewide, top 89%, 568 students, 96% FRL); Heritage High (math 32% / reading 77%, grade C-, #281 of 319 statewide, top 90%, 1,073 students, 94% FRL) — zoned schools average 94% FRL vs 61% district-wide (33 pts higher); higher-poverty schools than district average — tighter screening recommended.
- Market conditions: Rents rising (+1.1%/yr); 221 active listings in the ZIP; 23 comparable units currently listed for rent nearby; rentals at typical pace (median 23d on market — plan ~3-4 weeks tenant-placement turnaround); 48% of comp listings sitting > 30 days — soft ceiling on asking rent; lower-income renter base — watch delinquency; 472 units permitted in Lynchburg city in 2024 (240 in 5+ unit buildings).
- This rent runs 35% of the median local income ($42k/yr) — at the standard rent-burdened threshold; future hikes will face affordability resistance.
Forward outlook
- Local home prices are declining (-3.0%/yr); year-one equity from $1k of loan paydown is wiped out by about $4k of value loss. Plan a longer hold.
- Lynchburg County population projected at +37% by 2050 — long-run rental-demand tailwind backs the buy-and-hold thesis.
Negotiation context
- It's been on market 41 days — a 3% lower offer ($146k) is reasonable based on typical stale-listing flexibility.
- 3 sale attempts since 2y ago with the ask held roughly flat each time — persistent listings suggest the price (not the market) is what's stuck; bring a comps-based counter.
- Current owner paid $16k; list at $150k implies a 809% gain — meaningful room to come down on a strong offer.
Risks & watch-outs
- Watch-outs: built in 1930 — expect roof / HVAC / electrical / plumbing capex.
- Climate carrying-cost: extreme-heat days projected 7→17/yr by 2055 (HVAC capex compounding) — expect insurance premiums to compound above CPI over the hold.
Questions for the listing agent
- It's been on market 41 days. Have you received any prior offers? Is the seller open to a 19% concession, seller financing, or rate buy-down credit?
- Built in 1930 — when were the roof, HVAC, electrical panel, plumbing, and water heater last replaced?
- Is there a deadline driving the sale (1031 exchange, divorce, estate, relocation)? That informs how much negotiation room exists.
- Schools are A-rated — typically a magnet for longer-tenancy family renters. What's the average tenant stay here, and is there a school-zone premium baked into asking?
- The area grade is low — what's the realistic commute time and amenity access for the typical tenant pool here? Any planned neighborhood developments (good or bad) we should know about?
- What's the average days-on-market for RENTAL listings here right now (not sales)? A rising rental-DOM trend means longer vacancies and softer asking-rent achievability than the comps imply.
- What's the recent tenant-quality profile in this submarket — average credit score on applications, eviction rate, late-payment / NSF rate, and stable-employment percentage? A property-management company in the area should have these aggregated.
- How much new for-sale + rental construction is in the pipeline within 1–3 miles? Heavy new supply typically softens prices + rents 12–24 months out; constrained supply supports both.
Investment metrics
- 1% rule
- 0.81% ✗
- Cap rate
- 6.62%
- Cash-on-cash
- 1.17%
- DSCR
- 1.05
- GRM
- 10.2
CMA / ARV
- ARV (median comp)
- $145,042
- List price
- $150,000
- Delta
- 3.42%
- Verdict
- FAIR
- Comps
- 20 within 1.0 mi
Show comp detail 12 sales within ~0.75 mi
| Address | Dist | Beds/Ba | Sqft | Sold | Price | $/sf | Match |
|---|---|---|---|---|---|---|---|
| 2809 Herbert St | 0.30mi | 2/2.0 | 1,000 (-0%) | 8mo | $198,500 | $199 | 75 |
| 2337 Mosby Ave | 0.36mi | 2/1.0 | 1,022 (+2%) | 8mo | $173,000 | $169 | 73 |
| 3020 Lennox St | 0.44mi | 2/2.0 | 1,043 (+4%) | 1mo | $105,000 | $101 | 68 |
| 3134 Campbell Ave. Ave | 0.12mi | 2/2.0 | 868 (-13%) | 1mo | $160,000 | $184 | 67 |
| 2207 Craig St | 0.26mi | 3/1.0 (+1) | 1,086 (+8%) | 2mo | $141,200 | $130 | 67 |
| 2216 Mayflower Dr | 0.40mi | 2/1.0 | 908 (-9%) | 1mo | $60,500 | $67 | 65 |
| 1534 Otey St. St | 0.62mi | 2/1.0 | 1,031 (+3%) | 7mo | $169,900 | $165 | 60 |
| 1658 Edmunds St | 0.62mi | 2/2.0 | 961 (-4%) | 0mo | $103,000 | $107 | 60 |
| 1725 Otey St | 0.61mi | 3/1.0 (+1) | 961 (-4%) | 4mo | $120,000 | $125 | 56 |
| 2640 Mayflower Dr | 0.69mi | 3/1.0 (+1) | 962 (-4%) | 2mo | $190,800 | $198 | 55 |
| 2518 Carter St | 0.49mi | 3/2.0 (+1) | 1,091 (+9%) | 2mo | $187,400 | $172 | 52 |
| 3212 Swan Pl | 0.71mi | 3/1.0 (+1) | 960 (-4%) | 8mo | $212,000 | $221 | 48 |
Match score weights: distance 35% · size 25% · config 20% · recency 20%. Top-matched comps best support the ARV.
Projected returns pro-forma
-3.0% appreciation · 1.15% rent growth · sell at horizon
- IRR
- -16.4%
- Equity multiple
- 0.43×
- Total profit
- $-23,979
- Equity at exit
- $22,365
- IRR
- -11.4%
- Equity multiple
- 0.37×
- Total profit
- $-26,555
- Equity at exit
- $12,969
Cash invested: $42,000 (down + closing). Projections, not guarantees.
Landlord ↔ Tenant lean methodology
- Overall (STATE)
- 55 Moderately Landlord-Leaning
- State Virginia
- 55 Moderately Landlord-Leaning · D+2
- County
- — inherits STATE
- City
- — inherits STATE
ZIP-level market 24501
- Rents YoY
- 1.1%
- Active inventory
- 221
- Price-to-rent
- 10.2×
Monthly cashflow live
- Estimated rent
- $1,222 high interval (Pro) →
- Mortgage (P&I)
- −$787
- Tax from tax record
- −$76 /mo · $906/yr
- Insurance
- −$62
- HOA
- −$0
- Lot rent
- −$0
- Vacancy / Maint / Mgmt
- −$257
- Net cashflow
- $41
Break-even live
Sensitivity live
| Price | -10% $126 | -5% $83 | +0% $41 | +5% $-1 | +10% $-44 |
|---|---|---|---|---|---|
| Rent | -10% $-56 | -5% $-7 | +0% $41 | +5% $89 | +10% $138 |
| Rate | -1.0pp $117 | -0.5pp $79 | base $41 | +0.5pp $2 | +1.0pp $-37 |
UW: 25.0% down · 7.5% · 30yr · 1.5% tax · 5.0% vac · 8.0% maint · 8.0% mgmt
Financing live
Cash to close
- Down payment
- $37,500
- Closing costs
- $4,500
- Reserves months
- —
- Total cash needed
- —
Loan-product check · same deal, 3 products live
Conventional
25% down · 7.5% · 30yr
- Down + closing
- —
- Monthly P&I
- —
- Monthly cashflow
- —
- DSCR
- —
- Eligible?
- —
Personal DTI + credit; lowest rate.
DSCR
20% down · 8.5% · 30yr
- Down + closing
- —
- Monthly P&I
- —
- Monthly cashflow
- —
- DSCR
- —
- Eligible?
- —
No personal income docs; deal must DSCR.
Hard money
10% down · 12.0% · 12mo
- Down + closing
- —
- Monthly P&I
- —
- Monthly cashflow
- —
- DSCR
- —
- Eligible?
- —
Short-term bridge; refi at stabilization.
Rent comps 23 comps
| Address | Beds | Baths | Sqft | Rent | $/sqft | DOM | Units | Dist |
|---|---|---|---|---|---|---|---|---|
| 2205 Easley Ave Lynchburg, VA | 2.0 | 2.0 | 870 | $1,400 | $1.61 | 46d | 1 | 0.23mi |
| 2210 Haden St Lynchburg, VA | 2.0 | 1.0 | 784 | $1,050 | $1.34 | 46d | 1 | 0.24mi |
| 2205 Mayflower Dr Lynchburg, VA | 3.0 | 1.0 | 1500 | $1,450 | $0.97 | 23d | 1 | 0.36mi |
| 2518 Carter St Lynchburg, VA | 3.0 | 2.0 | 1091 | $1,500 | $1.37 | 46d | 1 | 0.47mi |
| 8 Parkwood Ave Unit A Lynchburg, VA | 2.0 | 1.0 | 840 | $895 | $1.07 | 15d | 1 | 0.61mi |
| 2336 Aragon St Lynchburg, VA | 2.0 | 1.0 | 1042 | $995 | $0.95 | 15d | 1 | 0.92mi |
| 2269 Aragon St Lynchburg, VA | 3.0 | 2.0 | 1200 | $1,695 | $1.41 | 46d | 1 | 0.96mi |
| 1625 Shaffer St Lynchburg, VA | 2.0 | 1.0 | 895 | $850 | $0.95 | 46d | 1 | 1.00mi |
| 1308 16th St Lynchburg, VA | 3.0 | 2.0 | 1380 | $1,800 | $1.30 | 15d | 1 | 1.12mi |
| 1521 Taylor St Lynchburg, VA | 3.0 | 1.0 | 1337 | $1,195 | $0.89 | 23d | 1 | 1.18mi |
| 1401 Kemper St Lynchburg, VA | 2.0–3.0 | 2.0 | 1118 | $707 | $0.63 | 23d | 6 | 1.19mi |
| 1415 Floyd St Lynchburg, VA | 3.0 | 2.0 | 1300 | $1,800 | $1.38 | 23d | 1 | 1.20mi |
| 2734 Fort Ave Lynchburg, VA | 1.0–2.0 | 1.0–2.0 | 875 | $1,450 | $1.66 | 46d | 1 | 1.26mi |
| 1219 Pierce St Unit 1221 Lynchburg, VA | 2.0 | 1.0 | 1168 | $825 | $0.71 | 15d | 1 | 1.27mi |
| 1810 Laurel St Lynchburg, VA | 2.0 | 1.0 | 720 | $995 | $1.38 | 46d | 1 | 1.30mi |
| 1106 Pierce St Lynchburg, VA | 3.0 | 2.0 | 1018 | $875 | $0.86 | 23d | 1 | 1.38mi |
| 905 Centerdale St Lynchburg, VA | 2.0 | 1.0 | 780 | $895 | $1.15 | 15d | 1 | 1.39mi |
| 1105 Fillmore St Unit B Lynchburg, VA | 3.0 | 1.0 | 1300 | $1,250 | $0.96 | 46d | 1 | 1.39mi |
| 403 Grove St Lynchburg, VA | 3.0 | 2.0 | 1400 | $1,600 | $1.14 | 46d | 1 | 1.44mi |
| 318 Wadsworth St Lynchburg, VA | 3.0 | 1.0 | 943 | $995 | $1.06 | 23d | 1 | 1.46mi |
| 216 Kenyon St Lynchburg, VA | 2.0 | 1.0 | 1114 | $995 | $0.89 | 46d | 1 | 1.47mi |
| 317 Grove St Unit A Lynchburg, VA | 2.0 | 1.0 | 900 | $895 | $0.99 | 46d | 1 | 1.47mi |
| 803 Mansfield Ave Lynchburg, VA | 2.0 | 1.0 | 900 | $1,300 | $1.44 | 23d | 1 | 1.48mi |
Listing history 15 events
-
2026-06-10days on market $150,000 Active 41 DOM
-
2026-06-09days on market $150,000 Active 40 DOM
-
2026-06-08days on market $150,000 Active 39 DOM
-
2026-06-07days on market $150,000 Active 38 DOM
-
2026-06-03days on market $150,000 Active 34 DOM
-
2026-06-02days on market $150,000 Active 33 DOM
-
2026-06-01days on market $150,000 Active 32 DOM
-
2026-05-31days on market $150,000 Active 31 DOM
-
2026-05-30days on market $150,000 Active 30 DOM
-
2026-04-29$150,000 Active 406-char remark
-
2025-04-13status Pending
-
2025-02-01status Active
-
2025-01-09status Pending
-
2024-10-26$149,900 Active
-
1993-11-08soldstatus $16,500
ⓘ Source: listings_history table (triggers on properties + properties_extension) + one-shot
backfill from property_details.listing_events for pre-trigger history.
Tax reassessment forecast VA · Resets to sale price
- Current annual tax
- $906 · $76/mo
- Projected year-2 tax
- $1,230 · $102/mo
- Expected delta
- +$324/yr (+$27/mo · 35.7%)
ⓘ Screening estimate from a state-policy table — verify with the county assessor before closing.
Climate risk First Street
- Flood 1/10 Low FEMA zone X (unshaded) · 0% chance over 30 yrs
- Wildfire 4/10 Moderate
- Heat 6/10 Major 7 d/yr ≥101°F today · 17 d/yr by 30 yrs out
- Wind 2/10 Low 3% chance of damaging wind over 30 yrs
- Air quality 2/10 Low 0 unhealthy d/yr today · 1 by 30 yrs out
Nearby sold comps map
Loading sold comps map…
Walkable amenities ~0.75 mi
Loading nearby amenities…
Taxation est. · year 1
- Rental income
- $14,668
- − Mortgage interest
- −$8,402
- − Property taxes
- −$906
- − Insurance
- −$750
- − Repairs & maintenance
- −$1,173
- − Management
- −$1,173
- − Depreciation
- −$4,364
- Taxable loss
- −$2,101
- Est. tax savings @ 24.0%
- +$504
- After-tax cash flow
- $996/yr
For passive investors: Depreciation is non-cash, so a rental often shows a tax loss while cash-flowing — sheltering income. Rental losses are passive: they offset passive income freely, and up to $25,000/yr can offset ordinary (W-2) income if you actively participate and your MAGI is under $100k (phasing out to $0 by $150k); unused losses carry forward. On sale, claimed depreciation is recaptured at up to 25%, and gains may owe capital-gains tax (a 1031 exchange can defer both). Figures are a year-1 estimate at your 24.0% rate — not tax advice; consult a CPA.
Schools (NCES district)
- District
- Lynchburg City Public School District
- NCES district ID
- 5102340
- Math proficiency
- 36% ▼ -38.00%
- Reading proficiency
- 61% ▼ -8.00%
- Median HH income
- $39,097
- Composite
- 40.4/100
- National rank
- #3730
- State rank
- #104 of 131 in VA
Livability — Lynchburg
- Score
- 91/100
- State rank
- #1
- US rank
- #58
Category grades
Schools grade is shown separately in the Schools card above.
Census & demographics
- Census place
- Lynchburg, VA
- County
- Lynchburg City · 97,036 people
- City population
- 97,036
- Metro
- Lynchburg, VA
- Population (ZIP)
- 25,006
- Household income
- $42,222
- Rent vs Own
- Severe rent burden
- 1717.0
Population outlook (Lynchburg County) Hauer SSP2
- Today (2025)
- 87,977 people
- By 2030
- 93,626 · +6.4%
- By 2040
- 106,145 · +20.7%
- By 2050
- 120,783 · +37.3%
- By 2075
- 162,249 · +84.4%
- By 2100
- 191,358 · +117.5%
Race, ethnicity, and origin ACS 2023
- Neighborhood character
- Diverse neighborhood (Simpson 0.55)
- Race & ethnicity
- White 58% Black 34% Two or more races 4% Hispanic / Latino 3%
- Common ancestry
- Slovak 1% Italian 1% Serbian 1%
- Foreign-born
- 3% · Canada
- Languages at home
- 96% English-only · Spanish 2%
Political lean MEDSL · Lynchburg
- 2024 margin
- Lean R (+7.9) · D 45.4% · R 53.3% · Other 1.3%
- 2008→2024 swing
- -3.9pp toward R · 2008: -4.0pp · 2024: -7.9pp
- All cycles
- 2024: R+7.9 2020: D+2.6 2016: R+9.0 2012: R+10.6 2008: R+4.0
Not yet ingested
- Civics
- —
Market trends
- HPI YoY
- ▼ -131.06%
- Current HPI
- 223.6839
- Rent YoY
- ▲ 1.15%
- Metro
- Lynchburg, VA
- State GDP YoY
- ▲ 2.40%
- F500 in state
- 50
Industry mix (Fortune 500 HQ in VA)
| Industry | F500 HQs | Revenue |
|---|---|---|
| Aerospace / Defense | 4 | $236B |
|
||
| Technology / Defense | 3 | $32B |
|
||
| Financial Services | 2 | $176B |
|
||
| Utilities | 2 | $27B |
|
||
| Insurance | 2 | $25B |
|
||
| Technology | 2 | $15B |
|
||
Price history
+809.1% since first listed6 events — show timeline
- 2026-04-29 Listed $150,000 LMLS
- 2025-04-13 Pending — LMLS
- 2025-02-01 Relisted — LMLS
- 2025-01-09 Pending — LMLS
- 2024-10-26 Listed $149,900 LMLS
- 1993-11-08 Sold (Public Records) $16,500 Public Records
Property tax history
+3.6%/yrLatest (2025): $906 · +47.6% YoY. Source: county tax records.
Cash-flow waterfall
monthlySold comps — $/sqft
last 12 mo · ≤1 miLoading sold comps…