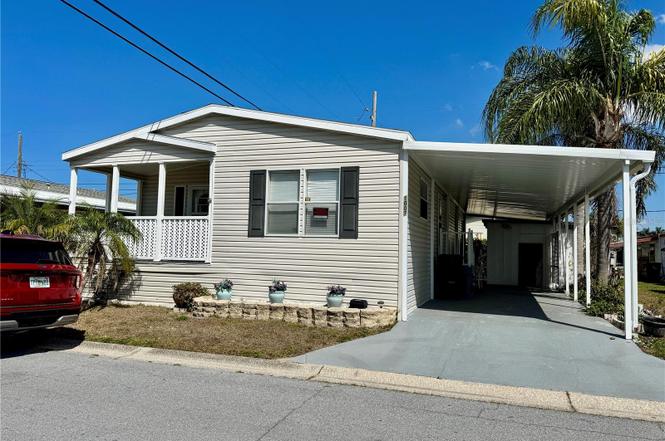
1007 50th Ave W · South Bradenton, FL
Flood risk 1/10 · Minimal
- FEMA flood zone
- X (unshaded)
- Chance of flooding over 30 yrs
- 0.0%
- Est. flood insurance / yr
- $507 – $1,088
Fire risk 1/10 · Minimal
- Est. fire insurance / yr
- $947 – $1,759
Heat risk 10/10 · Severe
- Hot days now (above 107°F)
- 7 days/yr
- Hot days in 30 yrs
- 29 days/yr
Wind risk 10/10 · Severe
- Chance of severe wind over 30 yrs
- 99.0%
Air-quality risk 3/10 · Minor
- Unhealthy air days now
- 2 days/yr
- Unhealthy air days in 30 yrs
- 2 days/yr
Risk factors via First Street. Map © Google.
Why this score? — see what drove the D- grade
The composite is a weighted blend of 9 inputs, each scored 0–100. Each bar is that input's sub-score; the figure is the points it added to the 100-point composite (weight × sub-score).
- Cash flow +12.5/30.0
- 1% rule +4.7/10.0
- Schools +4.4/10.0
- Livability +3.9/5.0
- DSCR +3.7/10.0
- ARV discount +3.4/15.0
- Condition / age +2.5/5.0
- Rent growth +1.1/5.0
- Appreciation +0.0/10.0
$160,000
🖨 Deal sheet (PDF) 📄 Offer letter ✓ Due diligence
Listing remarks
Under contract-accepting backup offers. Welcome to this charming 2-bedroom, 2-bathroom mobile home, built in 2011 and located in the vibrant 55+ community of Fair Lane Acres. This well-maintained property is being sold turnkey furnished— bring your suitcase and start enjoying the Florida lifestyle. Inside, you'll find a bright and inviting open floor plan with cathedral ceilings that enhance the spacious feel. Recent updates include AC (2020) and a hot water heater for laundry (2025), giving you peace of mind for years to come. Fair Lane Acres is an active community offering excellent amenities, including a sparkling pool, tennis and pickleball courts, shuffleboard courts, and a clubh
Key facts
- Open floor plan
- Recent updates
- Pickleball courts
Tags
Neighborhood map
What this means for you Summary
Snapshot
- This is a 2-bed/2.0-bath manufactured listed at $160k.
Deal economics
- At list price, monthly cash flow is $-23 ($-276/yr) — negative.
- To cash-flow at today's rent, offer at most $156k (2.5% below list).
- To meet the 1% rule (rent ≥ 1% of price), the offer needs to be $155k (3.2% below list).
- Recommended offer: $155k (3.2% below list) — sets the bar for 1% rule.
- Cap rate 6.1% vs local median 4.1% in South Bradenton — top-decile yield for the area; either an underpriced asset or a hidden risk that comps aren't pricing in. Stress-test before assuming the spread holds.
Location & tenants
- Location reads 77/100 on livability (#195 in FL, #3,092 nationally) — a middle-class / working-renter tenant base. Strengths: cost of living A+, housing A+, health & safety A+; Watch: amenities C-, crime D+, commute F.
- Manatee (suburban): math 54% / reading 50% proficiency, ranked #26 of 73 in FL (top 36%) — acceptable for families but not a draw, mixed tenant base, ~2y average lease.
- Zoned schools: Oneco Elementary School (math 49% / reading 27%, grade F, #1,587 of 2,144 statewide, top 74%, 596 students, 79% FRL); W. D. Sugg Middle School (math 34% / reading 28%, grade F, #462 of 571 statewide, top 81%, 1,010 students, 72% FRL); Southeast High School (math 25% / reading 34%, grade F, #447 of 667 statewide, top 68%, 1,716 students, 66% FRL) — zoned schools average 72% FRL vs 51% district-wide (22 pts higher); higher-poverty schools than district average — tighter screening recommended.
- Zoned-school proficiency averages 33% at this address vs 52% district-wide (-19 pts) — the specific schools serving this property underperform the Manatee average; the district grade overstates school quality for this exact location.
- Market conditions: Rents falling (-5.5%/yr); 362 active listings in the ZIP; 40 comparable units currently listed for rent nearby; rentals at typical pace (median 22d on market — plan ~3-4 weeks tenant-placement turnaround); 7,472 units permitted in Manatee County in 2024 (1,782 in 5+ unit buildings).
- This rent runs 41% of the median local income ($45k/yr) — at the standard rent-burdened threshold; future hikes will face affordability resistance.
Forward outlook
- Local home prices are declining (-3.0%/yr); year-one equity from $1k of loan paydown is wiped out by about $5k of value loss. Plan a longer hold.
- Manatee County population projected at +43% by 2050 — long-run rental-demand tailwind backs the buy-and-hold thesis.
Negotiation context
- It's been on market 41 days — a 3% lower offer ($155k) is reasonable based on typical stale-listing flexibility.
- Current owner paid $25k; list at $160k implies a 540% gain — meaningful room to come down on a strong offer.
Risks & watch-outs
- Climate carrying-cost: severe wind risk, 99% chance of damaging wind over 30y; extreme-heat days projected 7→29/yr by 2055 (HVAC capex compounding) — expect insurance premiums to compound above CPI over the hold.
Questions for the listing agent
- What do current leases actually rent for vs. the listed asking? Can we see a recent rent roll and the last 12 months of T-12 income?
- It's been on market 41 days. Have you received any prior offers? Is the seller open to a 3% concession, seller financing, or rate buy-down credit?
- What does the HOA fee cover, when was the last increase, and are there any pending special assessments or reserve-fund shortfalls?
- Is there a deadline driving the sale (1031 exchange, divorce, estate, relocation)? That informs how much negotiation room exists.
- Schools are B-rated — typically a magnet for longer-tenancy family renters. What's the average tenant stay here, and is there a school-zone premium baked into asking?
- Crime grade is D in this area — have there been break-ins, vandalism, or insurance claims at this property in the last 3 years? What carrier currently insures it and at what premium?
- The area grade is low — what's the realistic commute time and amenity access for the typical tenant pool here? Any planned neighborhood developments (good or bad) we should know about?
- What's the average days-on-market for RENTAL listings here right now (not sales)? A rising rental-DOM trend means longer vacancies and softer asking-rent achievability than the comps imply.
- What's the recent tenant-quality profile in this submarket — average credit score on applications, eviction rate, late-payment / NSF rate, and stable-employment percentage? A property-management company in the area should have these aggregated.
- How much new for-sale + rental construction is in the pipeline within 1–3 miles? Heavy new supply typically softens prices + rents 12–24 months out; constrained supply supports both.
Investment metrics
- 1% rule
- 0.97% ✗
- Cap rate
- 6.12%
- Cash-on-cash
- -0.62%
- DSCR
- 0.97
- GRM
- 8.6
CMA / ARV
- ARV (on-the-fly)
- $146,608
- Comps found
- 12
Show comp detail 12 sales within ~0.75 mi
| Address | Dist | Beds/Ba | Sqft | Sold | Price | $/sf | Match |
|---|---|---|---|---|---|---|---|
| 1007 50th Ave W | 0.00mi | 2/2.0 | 1,232 (0%) | 1mo | $150,000 | $122 | 100 |
| 5131 W 11th St W | 0.22mi | 2/2.0 | 1,152 (-6%) | 7mo | $116,000 | $101 | 74 |
| 416 52nd Avenue Dr W | 0.46mi | 2/2.0 | 1,212 (-2%) | 5mo | $150,000 | $124 | 72 |
| 715 50th Avenue Ter W | 0.19mi | 2/2.0 | 1,100 (-11%) | 4mo | $75,000 | $68 | 70 |
| 5003 4th St W | 0.35mi | 2/2.0 | 1,320 (+7%) | 3mo | $120,000 | $91 | 69 |
| 212 52nd Avenue Plz W | 0.58mi | 2/2.0 | 1,228 (-0%) | 8mo | $180,000 | $147 | 66 |
| 1117 50th Ave W | 0.09mi | 2/2.0 | 1,048 (-15%) | 8mo | $124,500 | $119 | 65 |
| 4809 4th St W | 0.38mi | 2/2.0 | 1,104 (-10%) | 2mo | $132,500 | $120 | 63 |
| 306 49th Ave W | 0.44mi | 2/2.0 | 1,130 (-8%) | 3mo | $120,000 | $106 | 63 |
| 4923 5th Street Ct W | 0.31mi | 2/2.0 | 1,052 (-15%) | 8mo | $139,000 | $132 | 54 |
| 210 49th Ave W | 0.48mi | 3/2.0 (+1) | 1,344 (+9%) | 8mo | $140,000 | $104 | 51 |
| 5512 Colleen Dr | 0.74mi | 2/2.0 | 1,368 (+11%) | 4mo | $85,000 | $62 | 44 |
Match score weights: distance 35% · size 25% · config 20% · recency 20%. Top-matched comps best support the ARV.
Projected returns pro-forma
-3.0% appreciation · 0.0% rent growth · sell at horizon
- IRR
- -21.1%
- Equity multiple
- 0.29×
- Total profit
- $-31,822
- Equity at exit
- $23,857
- IRR
- -25.3%
- Equity multiple
- -0.04×
- Total profit
- $-46,690
- Equity at exit
- $13,834
Cash invested: $44,800 (down + closing). Projections, not guarantees.
Landlord ↔ Tenant lean methodology
- Overall (STATE)
- 87 Strongly Landlord-Friendly
- State Florida
- 87 Strongly Landlord-Friendly · R+3
- County
- — inherits STATE
- City
- — inherits STATE
ZIP-level market 34207
- Rents YoY
- -5.5%
- Active inventory
- 362
- Price-to-rent
- 8.6×
Monthly cashflow live
- Estimated rent
- $1,548 high interval (Pro) →
- Mortgage (P&I)
- −$839
- Tax from tax record
- −$203 /mo · $2,431/yr
- Insurance
- −$67
- HOA
- −$138
- Vacancy / Maint / Mgmt
- −$325
- Net cashflow
- $-23
Break-even live
Sensitivity live
| Price | -10% $68 | -5% $22 | +0% $-23 | +5% $-68 | +10% $-114 |
|---|---|---|---|---|---|
| Rent | -10% $-145 | -5% $-84 | +0% $-23 | +5% $38 | +10% $99 |
| Rate | -1.0pp $58 | -0.5pp $18 | base $-23 | +0.5pp $-64 | +1.0pp $-107 |
UW: 25.0% down · 7.5% · 30yr · 1.5% tax · 5.0% vac · 8.0% maint · 8.0% mgmt
Financing live
Cash to close
- Down payment
- $40,000
- Closing costs
- $4,800
- Reserves months
- —
- Total cash needed
- —
Loan-product check · same deal, 3 products live
Conventional
25% down · 7.5% · 30yr
- Down + closing
- —
- Monthly P&I
- —
- Monthly cashflow
- —
- DSCR
- —
- Eligible?
- —
Personal DTI + credit; lowest rate.
DSCR
20% down · 8.5% · 30yr
- Down + closing
- —
- Monthly P&I
- —
- Monthly cashflow
- —
- DSCR
- —
- Eligible?
- —
No personal income docs; deal must DSCR.
Hard money
10% down · 12.0% · 12mo
- Down + closing
- —
- Monthly P&I
- —
- Monthly cashflow
- —
- DSCR
- —
- Eligible?
- —
Short-term bridge; refi at stabilization.
Rent comps 40 comps
| Address | Beds | Baths | Sqft | Rent | $/sqft | DOM | Units | Dist |
|---|---|---|---|---|---|---|---|---|
| 915 50th Avenue Plz W Bradenton, FL | 2.0 | 1.0 | 700 | $1,200 | $1.71 | 25d | 1 | 0.08mi |
| 707 50th Ave W Bradenton, FL | 2.0 | 1.0 | 730 | $1,150 | $1.58 | 25d | 1 | 0.16mi |
| 655 Park Cir Bradenton, FL | 1.0 | 1.5 | 816 | $1,100 | $1.35 | 25d | 1 | 0.24mi |
| 608 51st Ave W Bradenton, FL | 2.0 | 1.5 | 760 | $2,200 | $2.89 | 25d | 1 | 0.27mi |
| 4810 Ho Wil Ln Unit 4810 Bradenton, FL | 2.0 | 1.0 | 784 | $1,600 | $2.04 | 25d | 1 | 0.29mi |
| 503 51st Ave W Bradenton, FL | 3.0 | 2.0 | 882 | $1,075 | $1.22 | 13d | 1 | 0.32mi |
| 503 51st Ave W Unit 503 Bradenton, FL | 3.0 | 2.0 | 882 | $1,275 | $1.45 | 25d | 1 | 0.32mi |
| 4630 5th St W Ste 6 Bradenton, FL | 2.0 | 1.0 | 1000 | $1,600 | $1.60 | 13d | 1 | 0.39mi |
| 304 47th Avenue Dr W #112 Bradenton, FL | 1.0 | 1.0 | 725 | $1,200 | $1.66 | 25d | 1 | 0.39mi |
| 4916 18th St W Unit B Bradenton, FL | 2.0 | 2.0 | 1170 | $1,650 | $1.41 | 25d | 1 | 0.51mi |
| 202 46th Avenue Ter W #409 Bradenton, FL | 2.0 | 2.0 | 1086 | $1,995 | $1.84 | 25d | 1 | 0.52mi |
| 203 46th Avenue Ter W Bradenton, FL | 1.0 | 1.0 | 880 | $1,099 | $1.25 | 5d | 1 | 0.54mi |
| 2004 49th Ave W Unit 2002 Bradenton, FL | 2.0 | 2.0 | 1021 | $1,950 | $1.91 | 25d | 1 | 0.64mi |
| 4444 17th St W Unit B Bradenton, FL | 2.0 | 1.0 | 850 | $2,200 | $2.59 | 25d | 1 | 0.64mi |
| 5502 8th Street Ct W Bradenton, FL | 2.0 | 2.0 | 896 | $1,595 | $1.78 | 25d | 1 | 0.68mi |
| 4906 21st St W Bradenton, FL | 2.0 | 1.0 | 918 | $1,700 | $1.85 | 18d | 1 | 0.69mi |
| 4607 21st St W Bradenton, FL | 3.0 | 2.0 | 1133 | $2,500 | $2.21 | 25d | 1 | 0.71mi |
| 5001 22nd St W Unit B Bradenton, FL | 2.0 | 1.0 | 729 | $1,700 | $2.33 | 18d | 1 | 0.72mi |
| 5016 22nd St W Bradenton, FL | 2.0 | 1.0 | 1400 | $1,600 | $1.14 | 5d | 1 | 0.76mi |
| 5580 Fountain Lake Cir Bradenton, FL | 1.0–3.0 | 1.0–2.0 | 1052 | $1,908 | $1.81 | 3d | 38 | 0.81mi |
| 3124 Lake Bayshore Dr Unit 219 Bradenton, FL | 2.0 | 2.0 | 1144 | $2,300 | $2.01 | 25d | 1 | 0.84mi |
| 3064 Lake Bayshore Dr Unit 115 Bradenton, FL | 2.0 | 2.0 | 1144 | $1,250 | $1.09 | 25d | 1 | 0.84mi |
| 5531 16th St W Unit 5537 Bradenton, FL | 2.0 | 1.0 | 750 | $1,650 | $2.20 | 5d | 1 | 0.86mi |
| 2305 46th Ave W Bradenton, FL | 1.0–2.0 | 1.0–2.0 | 1005 | $1,837 | $1.83 | 3d | 10 | 0.86mi |
| 4515 26th St W Bradenton, FL | 1.0–2.0 | 1.0–2.0 | 806 | $1,510 | $1.87 | 3d | 14 | 0.91mi |
| 4906 25th St W #101 Bradenton, FL | 2.0 | 1.5 | 1070 | $1,550 | $1.45 | 25d | 1 | 0.92mi |
| 1007 57th Ave W Bradenton, FL | 2.0 | 1.5 | 967 | $1,495 | $1.55 | 12d | 1 | 0.92mi |
| 5513 18th St W Bradenton, FL | 2.0 | 1.0 | 1000 | $1,499 | $1.50 | 25d | 1 | 0.92mi |
| 1308 36th Ave W Bradenton, FL | 1.0 | 1.0 | 715 | $1,199 | $1.68 | 25d | 1 | 1.03mi |
| 4705 27th St W Unit A Bradenton, FL | 2.0 | 1.0 | 750 | $1,325 | $1.77 | 4d | 1 | 1.03mi |
| 4204 Heron Way Unit B304 Bradenton, FL | 2.0 | 1.0 | 912 | $1,400 | $1.54 | 5d | 1 | 1.06mi |
| 4812 27th St W Unit 4812 Bradenton, FL | 2.0 | 2.0 | 912 | $1,545 | $1.69 | 13d | 1 | 1.06mi |
| 4812 27th St W Bradenton, FL | 2.0 | 2.0 | 912 | $1,599 | $1.75 | 13d | 1 | 1.06mi |
| 5310 26th St W Bradenton, FL | 1.0–2.0 | 1.0 | 789 | $1,550 | $1.96 | 21d | 5 | 1.08mi |
| 5310 26th St W Bradenton, FL | 1.0–2.0 | 1.0 | 789 | $1,450 | $1.84 | 5d | 4 | 1.08mi |
| 5310 26th St W Bradenton, FL | 1.0–2.0 | 1.0 | 789 | $1,450 | $1.84 | 13d | 5 | 1.08mi |
| 808 53rd Ave E #203 Bradenton, FL | 2.0 | 2.0 | 1208 | $1,450 | $1.20 | 18d | 1 | 1.09mi |
| 5059 Live Oak Cir Unit 5059 Bradenton, FL | 2.0 | 2.0 | 896 | $1,900 | $2.12 | 18d | 1 | 1.09mi |
| 2835 50th Ave W Bradenton, FL | 1.0–2.0 | 1.0–2.0 | 850 | $1,610 | $1.89 | 5d | 16 | 1.09mi |
| 5103 29th St W Bradenton, FL | 2.0 | 2.0 | 1258 | $2,600 | $2.07 | 25d | 1 | 1.11mi |
HOA detail
- Monthly dues
- $138 · $1,656/yr
- Likely covers
- waterpool
Listing history 4 events
-
2026-04-21status Pending
-
2026-03-11$160,000 Active
-
1996-08-05soldstatus $25,000
-
1992-04-03soldstatus $30,000
ⓘ Source: listings_history table (triggers on properties + properties_extension) + one-shot
backfill from property_details.listing_events for pre-trigger history.
Tax reassessment forecast FL · Resets to sale price
- Current annual tax
- $2,431 · $203/mo
- Projected year-2 tax
- $2,431 · $203/mo
- Expected delta
- $0/yr ($0/mo · 0.0%)
ⓘ Screening estimate from a state-policy table — verify with the county assessor before closing.
Climate risk First Street
- Flood 1/10 Low FEMA zone X (unshaded) · 0% chance over 30 yrs
- Wildfire 1/10 Low
- Heat 10/10 Extreme 7 d/yr ≥107°F today · 29 d/yr by 30 yrs out
- Wind 10/10 Extreme 99% chance of damaging wind over 30 yrs
- Air quality 3/10 Moderate 2 unhealthy d/yr today · 2 by 30 yrs out
Nearby sold comps map
Loading sold comps map…
Walkable amenities ~0.75 mi
Loading nearby amenities…
Taxation est. · year 1
- Rental income
- $18,581
- − Mortgage interest
- −$8,962
- − Property taxes
- −$2,431
- − Insurance
- −$800
- − Repairs & maintenance
- −$1,487
- − Management
- −$1,487
- − HOA
- −$1,656
- − Depreciation
- −$4,655
- Taxable loss
- −$2,896
- Est. tax savings @ 24.0%
- +$695
- After-tax cash flow
- $419/yr
For passive investors: Depreciation is non-cash, so a rental often shows a tax loss while cash-flowing — sheltering income. Rental losses are passive: they offset passive income freely, and up to $25,000/yr can offset ordinary (W-2) income if you actively participate and your MAGI is under $100k (phasing out to $0 by $150k); unused losses carry forward. On sale, claimed depreciation is recaptured at up to 25%, and gains may owe capital-gains tax (a 1031 exchange can defer both). Figures are a year-1 estimate at your 24.0% rate — not tax advice; consult a CPA.
Schools (NCES district)
- District
- Manatee
- NCES district ID
- 1201230
- Math proficiency
- 54% ▼ -6.00%
- Reading proficiency
- 50% ▼ -2.00%
- Median HH income
- $49,607
- Composite
- 44.43/100
- National rank
- #2806
- State rank
- #26 of 73 in FL
Livability — South Bradenton
- Score
- 77/100
- State rank
- #195
- US rank
- #3092
Category grades
Schools grade is shown separately in the Schools card above.
Census & demographics
- Census place
- South Bradenton, FL
- County
- Manatee County · 416,364 people
- Metro
- North Port-Sarasota-Bradenton, FL
- Population (ZIP)
- 34,081
- Household income
- $45,010
- Rent vs Own
- Severe rent burden
- 1474.0
Population outlook (Manatee County) Hauer SSP2
- Today (2025)
- 447,342 people
- By 2030
- 488,911 · +9.3%
- By 2040
- 567,934 · +27.0%
- By 2050
- 637,995 · +42.6%
- By 2075
- 781,970 · +74.8%
- By 2100
- 848,272 · +89.6%
Race, ethnicity, and origin ACS 2023
- Neighborhood character
- Diverse neighborhood (Simpson 0.57)
- Race & ethnicity
- White 58% Hispanic / Latino 29% Two or more races 13% Black 7%
- Hispanic origin (detail)
- Mexican 12% Puerto Rican 4% Cuban 3% Dominican 1%
- Common ancestry
- Lithuanian 3% Romanian 2% Slovak 2%
- Foreign-born
- 16% · Canada, Jamaica
- Languages at home
- 74% English-only · Spanish 22% Other Indo-European 1% French/Haitian/Cajun 1%
Political lean MEDSL · Manatee
- 2024 margin
- Strong R (+23.5) · D 37.9% · R 61.4%
- 2008→2024 swing
- -16.5pp toward R · 2008: -7.0pp · 2024: -23.5pp
- All cycles
- 2024: R+23.5 2020: R+16.1 2016: R+17.1 2012: R+12.5 2008: R+7.0
Not yet ingested
- Civics
- —
Market trends
- HPI YoY
- ▼ -305.32%
- Current HPI
- 369.9899
- Rent YoY
- ▼ -5.50%
- Metro
- North Port-Sarasota-Bradenton, FL
- State GDP YoY
- ▲ 3.28%
- F500 in state
- 36
Industry mix (Fortune 500 HQ in FL)
| Industry | F500 HQs | Revenue |
|---|---|---|
| Industrial Technology | 2 | $29B |
|
||
| Insurance | 2 | $17B |
|
||
| Retail | 1 | $60B |
|
||
| Technology Distribution | 1 | $58B |
|
||
| Homebuilding | 1 | $35B |
|
||
| Technology Manufacturing | 1 | $35B |
|
||
Price history
+433.3% since first listed4 events — show timeline
- 2026-04-21 Pending — Stellar MLS as Distributed by MLS Grid
- 2026-03-11 Listed $160,000 Stellar MLS as Distributed by MLS Grid
- 1996-08-05 Sold (Public Records) $25,000 Public Records
- 1992-04-03 Sold (Public Records) $30,000 Public Records
Property tax history
+7.9%/yrLatest (2025): $2,431 · -0.7% YoY. Source: county tax records.
Cash-flow waterfall
monthlySold comps — $/sqft
last 12 mo · ≤1 miLoading sold comps…