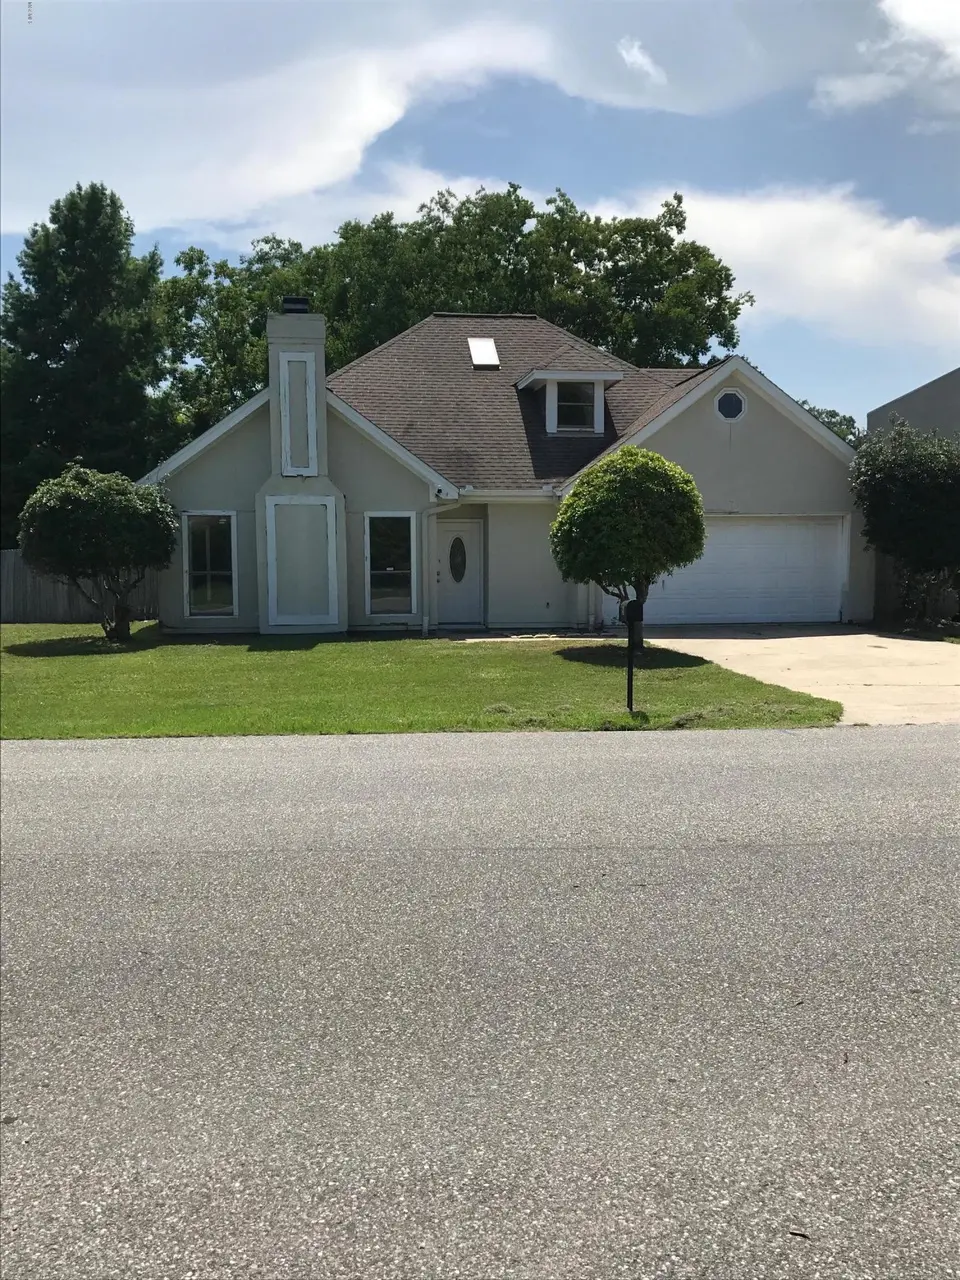
251 Rue Petit Bois · Biloxi, MS
Flood risk 6/10 · Moderate
- FEMA flood zone
- X (unshaded)
- Chance of flooding over 30 yrs
- 0.68%
- Est. flood insurance / yr
- $507 – $1,088
Fire risk 1/10 · Minimal
- Est. fire insurance / yr
- $1,241 – $2,305
Heat risk 10/10 · Severe
- Hot days now (above 105°F)
- 7 days/yr
- Hot days in 30 yrs
- 23 days/yr
Wind risk 9/10 · Severe
- Chance of severe wind over 30 yrs
- 99.0%
Air-quality risk 3/10 · Minor
- Unhealthy air days now
- 2 days/yr
- Unhealthy air days in 30 yrs
- 3 days/yr
Risk factors via First Street. Map © Google.
Why this score? — see what drove the C+ grade
The composite is a weighted blend of 9 inputs, each scored 0–100. Each bar is that input's sub-score; the figure is the points it added to the 100-point composite (weight × sub-score).
- Cash flow +20.7/30.0
- ARV discount +15.0/15.0
- DSCR +6.6/10.0
- 1% rule +5.1/10.0
- Schools +4.5/10.0
- Livability +4.0/5.0
- Rent growth +2.5/5.0
- Condition / age +2.5/5.0
- Appreciation +0.0/10.0
$206,000
🖨 Deal sheet 📄 Offer letter ✓ Due diligence
Listing remarks
Tucked away in a desirable coastal setting, this beautiful home at 251 Rue Petit Bois in Biloxi offers the perfect blend of comfort, convenience, and Gulf Coast charm. Featuring a well-designed layout, the home provides spacious living areas filled with natural light, a functional kitchen ideal for everyday living or entertaining, and generously sized bedrooms that offer both comfort and privacy. The property showcases thoughtful details throughout, creating a warm and inviting atmosphere from the moment you step inside. Outside, you'll find a yard with plenty of potential for relaxing, gardening, or hosting gatherings. Conveniently located near local dining, shopping, entertainment, and ju
Key facts
- 0.3 acre lot
- 2 garage spots
- Built 1987
Property features AI
Exterior
- Parking: 2-car garage; Concrete parking surfaces
- Utilities: Public water; Public sewer; Electricity connected; Water connected
- Home design: Single family residence (house); Two levels; Estimated living area around 2,100; Move-in ready
- Construction: Stucco construction; Shingle roof; Slab foundation; Built (year per public records)
- Exterior features: Patio (screened); Private yard; Backyard fencing; Other exterior features
Interior
- Kitchen: Free-standing electric range; Free-standing refrigerator
- Flooring: Carpet; Tile
- Bathrooms: 2 full bathrooms and 1 half bathroom (3 total)
- Heating & cooling: Central heating; Fireplace heating; Central air conditioning
- Interior features: Living room fireplace; Move-in ready condition
- Laundry & utility: Water heater
Neighborhood map
What this means for you Summary
Snapshot
- This is a 3-bed/1.5-bath single-family listed at $206k.
Deal economics
- At list price, monthly cash flow is $278 ($3k/yr) — positive.
- The deal already cash-flows at list — no discount required.
- Meets the 1% rule at list price ($2k rent vs $206k).
- Cap rate 7.9% vs local median 3.5% in Biloxi — top-decile yield for the area; either an underpriced asset or a hidden risk that comps aren't pricing in. Stress-test before assuming the spread holds.
Location & tenants
- Location reads 79/100 on livability (#6 in MS, #2,141 nationally) — a middle-class / working-renter tenant base. Strengths: crime A+, cost of living A+, housing A+; Watch: commute D+, amenities F, employment D-.
- Biloxi Public School District (urban): math 60% / reading 48% proficiency, ranked #7 of 130 in MS (top 5%) — acceptable for families but not a draw, mixed tenant base, ~2y average lease.
- Market conditions: Rents flat; 201 active listings in the ZIP; 27 comparable units currently listed for rent nearby; rentals lingering (median 44d on market — plan ~5-8 weeks vacancy on turnover, expect pricing pressure); 56% of comp listings sitting > 30 days — soft ceiling on asking rent; 2,194 units permitted in Harrison County in 2024 (0 in 5+ unit buildings).
- At $2,072/mo this rent would consume 46% of the median local household income ($54k/yr) (locally 1110% of renters already pay >50% of income on rent) — very limited rent-growth headroom before tenants either downsize or default.
Forward outlook
- Local home prices are declining (-3.0%/yr); year-one equity from $1k of loan paydown is wiped out by about $6k of value loss. Plan a longer hold.
- Harrison County population projected at +27% by 2050 — long-run rental-demand tailwind backs the buy-and-hold thesis.
Negotiation context
- Only 12 days on market — expect competitive offers; lowballing is unlikely to land.
- 8 sale attempts since 13y ago with the ask held roughly flat each time — persistent listings suggest the price (not the market) is what's stuck; bring a comps-based counter.
Risks & watch-outs
- Climate carrying-cost: major flood risk; severe wind risk, 99% chance of damaging wind over 30y; extreme-heat days projected 7→23/yr by 2055 (HVAC capex compounding) — expect insurance premiums to compound above CPI over the hold.
Questions for the listing agent
- Is there a deadline driving the sale (1031 exchange, divorce, estate, relocation)? That informs how much negotiation room exists.
- What's the average days-on-market for RENTAL listings here right now (not sales)? A rising rental-DOM trend means longer vacancies and softer asking-rent achievability than the comps imply.
- What's the recent tenant-quality profile in this submarket — average credit score on applications, eviction rate, late-payment / NSF rate, and stable-employment percentage? A property-management company in the area should have these aggregated.
- How much new for-sale + rental construction is in the pipeline within 1–3 miles? Heavy new supply typically softens prices + rents 12–24 months out; constrained supply supports both.
Investment metrics
- 1% rule
- 1.01% ✓
- Cap rate
- 7.91%
- Cash-on-cash
- 5.79%
- DSCR
- 1.26
- GRM
- 8.3
CMA / ARV
- ARV (median comp)
- $296,661
- List price
- $206,000
- Delta
- -30.56%
- Verdict
- UNDERPRICED
- Comps
- 20 within 1.0 mi
Show comp detail 12 sales within ~0.75 mi
| Address | Dist | Beds/Ba | Sqft | Sold | Price | $/sf | Match |
|---|---|---|---|---|---|---|---|
| 2593 Audubon Pl | 0.06mi | 3/2.0 | 2,000 (+0%) | 2mo | $280,000 | $140 | 94 |
| 2588 Rue Palafox | 0.17mi | 3/2.0 | 2,070 (+4%) | 1mo | $295,000 | $143 | 83 |
| 2621 Rue Palafox | 0.06mi | 3/2.5 | 1,918 (-4%) | 14mo | $255,000 | $133 | 76 |
| 2610 Rue Palafox | 0.10mi | 3/2.0 | 1,740 (-13%) | 2mo | $268,500 | $154 | 71 |
| 350 Oakridge Cir | 0.48mi | 3/2.0 | 1,959 (-2%) | 2mo | $290,000 | $148 | 71 |
| 2559 Rue Palafox | 0.30mi | 3/2.0 | 1,760 (-12%) | 3mo | $299,900 | $170 | 62 |
| 2531 Brighton Cir | 0.41mi | 3/2.0 | 1,892 (-5%) | 11mo | $272,000 | $144 | 61 |
| 2530 Brighton Cir | 0.43mi | 3/2.0 | 1,852 (-7%) | 9mo | $159,000 | $86 | 58 |
| 112 Edgewater Dr | 0.56mi | 3/2.5 | 1,809 (-9%) | 2mo | $619,900 | $343 | 53 |
| 135 Pine Grove Ave | 0.69mi | 3/2.0 | 1,760 (-12%) | 3mo | $249,900 | $142 | 44 |
| 2509 Randall Dr | 0.55mi | 3/2.0 | 1,700 (-15%) | 8mo | $264,900 | $156 | 40 |
| 142 Pine Grove Ave | 0.69mi | 3/2.0 | 1,724 (-14%) | 10mo | $278,000 | $161 | 35 |
Match score weights: distance 35% · size 25% · config 20% · recency 20%. Top-matched comps best support the ARV.
Projected returns pro-forma
-3.0% appreciation · 0.05% rent growth · sell at horizon
- IRR
- -10.6%
- Equity multiple
- 0.63×
- Total profit
- $-21,629
- Equity at exit
- $30,715
- IRR
- -5.9%
- Equity multiple
- 0.67×
- Total profit
- $-19,142
- Equity at exit
- $17,811
Cash invested: $57,680 (down + closing). Projections, not guarantees.
Landlord ↔ Tenant lean methodology
- Overall (STATE)
- 90 Strongly Landlord-Friendly
- State Mississippi
- 90 Strongly Landlord-Friendly · R+11
- County
- — inherits STATE
- City
- — inherits STATE
ZIP-level market 39531
- Home prices YoY
- -13.0%
- Rents YoY
- 0.1%
- Active inventory
- 201
- Price-to-rent
- 8.3×
Monthly cashflow live
- Estimated rent
- $2,072 high interval (Pro) →
- Mortgage (P&I)
- −$1,080
- Tax from tax record
- −$192 /mo · $2,305/yr
- Insurance
- −$86
- HOA
- −$0
- Vacancy / Maint / Mgmt
- −$435
- Net cashflow
- $278
Break-even live
UW: 25.0% down · 7.5% · 30yr · 1.5% tax · 5.0% vac · 8.0% maint · 8.0% mgmt
Financing live
Cash to close
- Down payment
- $51,500
- Closing costs
- $6,180
- Reserves months
- —
- Total cash needed
- —
Loan-product check · same deal, 3 products live
Conventional
25% down · 7.5% · 30yr
- Down + closing
- —
- Monthly P&I
- —
- Monthly cashflow
- —
- DSCR
- —
- Eligible?
- —
Personal DTI + credit; lowest rate.
DSCR
20% down · 8.5% · 30yr
- Down + closing
- —
- Monthly P&I
- —
- Monthly cashflow
- —
- DSCR
- —
- Eligible?
- —
No personal income docs; deal must DSCR.
Hard money
10% down · 12.0% · 12mo
- Down + closing
- —
- Monthly P&I
- —
- Monthly cashflow
- —
- DSCR
- —
- Eligible?
- —
Short-term bridge; refi at stabilization.
Rent comps 27 comps
| Address | Beds | Baths | Sqft | Rent | $/sqft | DOM | Units | Dist |
|---|---|---|---|---|---|---|---|---|
| 2589 Santa Rosa Cv Biloxi, MS | 3.0 | 2.0 | 1787 | $2,500 | $1.40 | 44d | 1 | 0.11mi |
| 2589 Santa Rosa Cv Biloxi, MS | 3.0 | 2.0 | 1787 | $2,500 | $1.40 | 21d | 1 | 0.11mi |
| 151 Grande View Dr Biloxi, MS | 1.0–3.0 | 1.0–2.0 | 1268 | $1,889 | $1.49 | 13d | 23 | 0.40mi |
| 2668 Beach Blvd Biloxi, MS | 3.0 | 3.0 | 1813 | $2,900 | $1.60 | 13d | 1 | 0.69mi |
| 2668 Beach Blvd Biloxi, MS | 2.0 | 2.0 | 1392 | $2,300 | $1.65 | 44d | 1 | 0.69mi |
| 2436 Beach Blvd Biloxi, MS | 3.0 | 2.0 | 1260 | $975 | $0.77 | 44d | 1 | 0.75mi |
| 2508 Shady Ln Biloxi, MS | 3.0 | 2.0 | 1431 | $2,100 | $1.47 | 44d | 1 | 0.81mi |
| 2795 Eula Rd Biloxi, MS | 3.0 | 2.5 | 1550 | $1,800 | $1.16 | 13d | 1 | 0.86mi |
| 894 Jefferson Dr Gulfport, MS | 3.0 | 2.5 | 1541 | $1,675 | $1.09 | 44d | 1 | 0.90mi |
| 910 Jefferson Dr Gulfport, MS | 3.0 | 2.5 | 1613 | $1,675 | $1.04 | 44d | 1 | 0.90mi |
| 924 Jefferson Dr Gulfport, MS | 3.0 | 2.5 | 1613 | $1,675 | $1.04 | 44d | 1 | 0.90mi |
| 928 Jefferson Dr Gulfport, MS | 2.0 | 1.5 | 1301 | $1,375 | $1.06 | 44d | 1 | 0.90mi |
| 918 Jefferson Dr Gulfport, MS | 2.0 | 1.5 | 1301 | $1,375 | $1.06 | 44d | 1 | 0.90mi |
| 938 Jefferson Dr Gulfport, MS | 2.0 | 1.5 | 1290 | $1,375 | $1.07 | 21d | 1 | 0.90mi |
| 936 Jefferson Dr Gulfport, MS | 2.0 | 1.5 | 1290 | $1,375 | $1.07 | 21d | 1 | 0.90mi |
| 2255 Switzer Rd Gulfport, MS | 1.0–3.0 | 1.0–2.0 | 1072 | $1,500 | $1.40 | 13d | 12 | 0.96mi |
| 2252 Beach Dr Gulfport, MS | 3.0 | 2.0 | 1691 | $2,800 | $1.66 | 44d | 1 | 0.96mi |
| 2387 Trafalgar Dr Biloxi, MS | 3.0 | 2.0 | 1375 | $1,700 | $1.24 | 21d | 1 | 1.01mi |
| 2230 Beach Dr Gulfport, MS | 3.0 | 3.0 | 1852 | $3,195 | $1.73 | 44d | 1 | 1.03mi |
| 2610 Demaret Dr Gulfport, MS | 4.0 | 1.5 | 1700 | $1,995 | $1.17 | 44d | 1 | 1.04mi |
| 2228 Beach Dr Gulfport, MS | 2.0 | 2.0 | 1279 | $2,895 | $2.26 | 21d | 1 | 1.04mi |
| 2386 Merlin Cv Biloxi, MS | 3.0 | 2.0 | 1500 | $1,600 | $1.07 | 13d | 1 | 1.17mi |
| 390 Bertucci Blvd Biloxi, MS | 3.0 | 2.0 | 1358 | $1,800 | $1.33 | 44d | 1 | 1.18mi |
| 2420 Demaret Dr Gulfport, MS | 4.0 | 2.0 | 1600 | $1,800 | $1.12 | 44d | 1 | 1.30mi |
| 495 Popps Ferry Rd Biloxi, MS | 2.0 | 1.5–2.5 | 1455 | $1,850 | $1.27 | 44d | 2 | 1.33mi |
| 495 Popps Ferry Rd #77 Biloxi, MS | 2.0 | 2.5 | 1524 | $2,000 | $1.31 | 21d | 1 | 1.37mi |
| 2611 Heidi LN Biloxi, MS | 3.0 | 2.5 | 1550 | $1,775 | $1.15 | 21d | 1 | 1.43mi |
Listing history 31 events
-
2026-06-18days on market $206,000 Active 12 DOM
-
2026-06-17days on market $206,000 Active 11 DOM
-
2026-06-16days on market $206,000 Active 10 DOM
-
2026-06-15days on market $206,000 Active 9 DOM
-
2026-06-14days on market $206,000 Active 7 DOM
-
2026-06-13pricedays on market $206,000 Active 6 DOM
-
2026-06-09days on market $210,000 Active 3 DOM
-
2026-06-09statusdays on market $210,000 Active 2 DOM
-
2026-05-08historical
-
2026-05-05$210,000 Active
-
2026-03-24soldstatus $210,000
-
2025-10-03historical
-
2025-09-11price $220,000
-
2025-08-07price $235,000
-
2025-07-08price $259,900
-
2025-05-26price $290,000
-
2025-04-20price $300,000
-
2025-03-22$320,000 Active
-
2025-02-03historical
-
2024-11-19price $259,000
-
2024-10-23$273,000 Active
-
2021-10-01historical
-
2021-09-22historical
-
2021-09-15historical
-
2018-09-25soldstatus $132,500
-
2018-09-19soldstatus
-
2018-06-01$144,900
-
2015-09-03$149,500
-
2014-10-06soldstatus $115,000
-
2013-08-02$185,000
-
2013-02-10$187,500
ⓘ Source: listings_history table (triggers on properties + properties_extension) + one-shot
backfill from property_details.listing_events for pre-trigger history.
Tax reassessment forecast MS · Resets to sale price
- Current annual tax
- $2,305 · $192/mo
- Projected year-2 tax
- $2,305 · $192/mo
- Expected delta
- $0/yr ($0/mo · 0.0%)
ⓘ Screening estimate from a state-policy table — verify with the county assessor before closing.
Climate risk First Street
- Flood 6/10 Major FEMA zone X (unshaded) · 68% chance over 30 yrs
- Wildfire 1/10 Low
- Heat 10/10 Extreme 7 d/yr ≥105°F today · 23 d/yr by 30 yrs out
- Wind 9/10 Extreme 99% chance of damaging wind over 30 yrs
- Air quality 3/10 Moderate 2 unhealthy d/yr today · 3 by 30 yrs out
Nearby sold comps map
Loading sold comps map…
Walkable amenities ~0.75 mi
Loading nearby amenities…
Taxation est. · year 1
- Rental income
- $24,861
- − Mortgage interest
- −$11,539
- − Property taxes
- −$2,305
- − Insurance
- −$1,030
- − Repairs & maintenance
- −$1,989
- − Management
- −$1,989
- − Depreciation
- −$5,993
- Taxable income
- $16
- Est. tax owed @ 24.0%
- −$4
- After-tax cash flow
- $3,337/yr
For passive investors: Depreciation is non-cash, so a rental often shows a tax loss while cash-flowing — sheltering income. Rental losses are passive: they offset passive income freely, and up to $25,000/yr can offset ordinary (W-2) income if you actively participate and your MAGI is under $100k (phasing out to $0 by $150k); unused losses carry forward. On sale, claimed depreciation is recaptured at up to 25%, and gains may owe capital-gains tax (a 1031 exchange can defer both). Figures are a year-1 estimate at your 24.0% rate — not tax advice; consult a CPA.
Schools (NCES district)
- District
- Biloxi Public School District
- NCES district ID
- 2800630
- Math proficiency
- 60% ▼ -7.00%
- Reading proficiency
- 48% ▼ -3.00%
- Median HH income
- $40,608
- Composite
- 45.26/100
- National rank
- #2657
- State rank
- #7 of 130 in MS
Livability — Biloxi
- Score
- 79/100
- State rank
- #6
- US rank
- #2141
Category grades
Schools grade is shown separately in the Schools card above.
Census & demographics
- Census place
- Biloxi, MS
- County
- Harrison County · 178,171 people
- City population
- 63,281
- Metro
- Gulfport-Biloxi, MS
- Population (ZIP)
- 18,918
- Household income
- $54,218
- Rent vs Own
- Severe rent burden
- 1110.0
Population outlook (Harrison County) Hauer SSP2
- Today (2025)
- 228,444 people
- By 2030
- 241,942 · +5.9%
- By 2040
- 267,531 · +17.1%
- By 2050
- 291,062 · +27.4%
- By 2075
- 346,711 · +51.8%
- By 2100
- 378,165 · +65.5%
Race, ethnicity, and origin ACS 2023
- Neighborhood character
- Diverse neighborhood (Simpson 0.60)
- Race & ethnicity
- White 60% Black 18% Two or more races 12% Hispanic / Latino 11% Asian 2%
- Hispanic origin (detail)
- Mexican 5%
- Common ancestry
- Lithuanian 6% Slovak 2% Serbian 1%
- Foreign-born
- 8% · Canada, Vietnam
- Languages at home
- 89% English-only · Spanish 6% Arabic 1% Other Indo-European 1%
Political lean MEDSL · Harrison
- 2024 margin
- Strong R (+28.9) · D 35.0% · R 63.9% · Other 1.1%
- 2008→2024 swing
- -2.9pp toward R · 2008: -26.0pp · 2024: -28.9pp
- All cycles
- 2024: R+28.9 2020: R+25.2 2016: R+30.7 2012: R+26.6 2008: R+26.0
Not yet ingested
- Civics
- —
Market trends
- HPI YoY
- ▼ -28.97%
- Current HPI
- 193.4018
- Rent YoY
- ▬ 0.05%
- Metro
- Gulfport-Biloxi, MS
- State GDP YoY
- —
- F500 in state
- 0
Price history
+9.9% since first listed25 events — show timeline
- 2026-06-11 Price Changed $206,000 MLSU
- 2026-06-08 Relisted — MLSU
- 2026-05-08 Listing Removed — MLSU
- 2026-05-05 Listed $210,000 MLSU
- 2026-03-24 Sold (Public Records) $210,000 Public Records
- 2025-10-03 Listing Removed — MLSU
- 2025-09-11 Price Changed $220,000 MLSU
- 2025-08-07 Price Changed $235,000 MLSU
- 2025-07-08 Price Changed $259,900 MLSU
- 2025-05-26 Price Changed $290,000 MLSU
- 2025-04-20 Price Changed $300,000 MLSU
- 2025-03-22 Listed $320,000 MLSU
- 2025-02-03 Listing Removed — MLSU
- 2024-11-19 Price Changed $259,000 MLSU
- 2024-10-23 Listed $273,000 MLSU
- 2021-10-01 Listing Removed — MLSU
- 2021-09-22 Listing Removed — MLSU
- 2021-09-15 Listing Removed — MLSU
- 2018-09-25 Sold (Public Records) $132,500 Public Records
- 2018-09-19 Sold (MLS) — MLSU
- 2018-06-01 Listed $144,900 MLSU
- 2015-09-03 Listed $149,500 MLSU
- 2014-10-06 Sold (Public Records) $115,000 Public Records
- 2013-08-02 Listed $185,000 MLSU
- 2013-02-10 Listed $187,500 MLSU
Property tax history
+0.0%/yrLatest (2025): $2,305 · +100.0% YoY. Source: county tax records.
Cash-flow waterfall
monthlySold comps — $/sqft
last 12 mo · ≤1 miLoading sold comps…