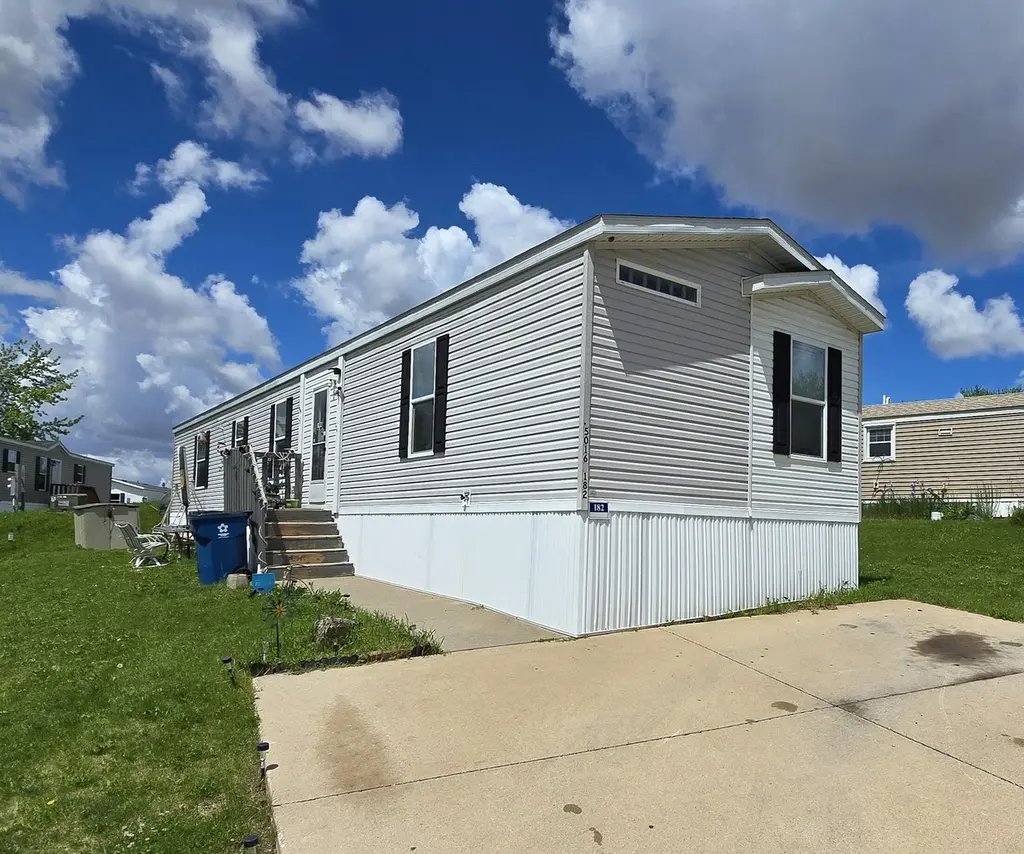
5016 Ruben Dr · Davenport, IA
Flood risk 8/10 · Major
- FEMA flood zone
- AE
- Chance of flooding over 30 yrs
- 0.99%
- Est. flood insurance / yr
- $435 – $905
Fire risk 2/10 · Minimal
- Est. fire insurance / yr
- $902 – $1,676
Heat risk 3/10 · Minor
- Hot days now (above threshold)
- 7 days/yr
- Hot days in 30 yrs
- 16 days/yr
Wind risk No data
- Chance of severe wind over 30 yrs
- —
Air-quality risk 3/10 · Minor
- Unhealthy air days now
- 2 days/yr
- Unhealthy air days in 30 yrs
- 3 days/yr
Risk factors via First Street. Map © Google.
Why this score? — see what drove the B+ grade
The composite is a weighted blend of 9 inputs, each scored 0–100. Each bar is that input's sub-score; the figure is the points it added to the 100-point composite (weight × sub-score).
- Cash flow +30.0/30.0
- ARV discount +10.6/15.0
- 1% rule +10.0/10.0
- DSCR +10.0/10.0
- Livability +4.0/5.0
- Schools +3.9/10.0
- Condition / age +3.8/5.0
- Rent growth +3.0/5.0
- Appreciation +0.0/10.0
$55,000
🖨 Deal sheet 📄 Offer letter ✓ Due diligence
Listing remarks MLS
Main floor amenities and affordability unite in this 2018 manufactured home. This home features 3 bedrooms and 2 baths, spacious eat-in kitchen with stainless steel appliances. Primary bedroom suite conveniently offers a garden tub, walk-in shower and walk-in closet. Located in Silver Creek MHP managed by YES! Communities. Contact park for lease agreement terms.
Key facts
- Walk-in closet
- Walk-in shower
- Garden tub
Tags
Neighborhood map
What this means for you Summary
Snapshot
- This is a 3-bed/2.0-bath manufactured listed at $55k. Condition is rated good.
Deal economics
- At list price, monthly cash flow is $603 ($7k/yr) — positive.
- The deal already cash-flows at list — no discount required.
- Meets the 1% rule at list price ($1k rent vs $55k).
- Recommended offer: $48k (12.0% below list) — sets the bar for market timing.
- Cap rate 20.7% vs local median 4.4% in Davenport — top-decile yield for the area; either an underpriced asset or a hidden risk that comps aren't pricing in. Stress-test before assuming the spread holds.
Location & tenants
- Location reads 79/100 on livability (#126 in IA, #2,312 nationally) — a middle-class / working-renter tenant base. Strengths: cost of living A+, housing A+, health & safety A+; Watch: employment C-, crime F.
- Davenport Community School District (urban): math 43% / reading 50% proficiency, ranked #288 of 289 in IA (top 100%) — families likely to look elsewhere, expect single-tenant / working-renter base with shorter leases.
- Market conditions: Rents rising (+1.8%/yr); 162 active listings in the ZIP; 14 comparable units currently listed for rent nearby; rentals leasing fast (median 14d on market — plan ~1-2 weeks tenant-placement turnaround); 805 units permitted in Scott County in 2024 (479 in 5+ unit buildings).
Forward outlook
- Local home prices are declining (-3.0%/yr); year-one equity from $380 of loan paydown is wiped out by about $2k of value loss. Plan a longer hold.
- Scott County population projected at +19% by 2050 — long-run rental-demand tailwind backs the buy-and-hold thesis.
- At projected returns (-3.0% appreciation + 1.8% rent growth), your $15k cash investment doubles in ~3 years — after that, you're playing with house money.
Negotiation context
- It's been on market 129 days — a 12% lower offer ($48k) is reasonable based on typical stale-listing flexibility.
- 2 sale attempts since 2y ago with the ask held roughly flat each time — persistent listings suggest the price (not the market) is what's stuck; bring a comps-based counter.
Risks & watch-outs
- Watch-outs: flood insurance adds $56/mo.
- Climate carrying-cost: in FEMA flood zone AE (mandatory federal flood insurance) — expect insurance premiums to compound above CPI over the hold.
Questions for the listing agent
- It's been on market 129 days. Have you received any prior offers? Is the seller open to a 12% concession, seller financing, or rate buy-down credit?
- What's the actual annual flood-insurance premium (NFIP or private), and is the property in a SFHA with mandatory coverage?
- Why hasn't it sold? Are there any deal-killer items the seller is aware of (foundation, flood, title, zoning, code violations)?
- Is there a deadline driving the sale (1031 exchange, divorce, estate, relocation)? That informs how much negotiation room exists.
- Crime grade is F in this area — have there been break-ins, vandalism, or insurance claims at this property in the last 3 years? What carrier currently insures it and at what premium?
- What's the average days-on-market for RENTAL listings here right now (not sales)? A rising rental-DOM trend means longer vacancies and softer asking-rent achievability than the comps imply.
- What's the recent tenant-quality profile in this submarket — average credit score on applications, eviction rate, late-payment / NSF rate, and stable-employment percentage? A property-management company in the area should have these aggregated.
- How much new for-sale + rental construction is in the pipeline within 1–3 miles? Heavy new supply typically softens prices + rents 12–24 months out; constrained supply supports both.
Investment metrics
- 1% rule
- 2.39% ✓
- Cap rate
- 20.66%
- Cash-on-cash
- 51.30%
- DSCR
- 3.28
- GRM
- 3.5
CMA / ARV
- ARV (median comp)
- $59,000
- List price
- $55,000
- Delta
- -6.78%
- Verdict
- FAIR
- Comps
- 3 within 1.0 mi
Show comp detail 2 sales within ~0.75 mi
| Address | Dist | Beds/Ba | Sqft | Sold | Price | $/sf | Match |
|---|---|---|---|---|---|---|---|
| 3208 W 47th Pl | 0.28mi | 3/2.0 | 1,178 (+2%) | 3mo | $59,000 | $50 | 80 |
| 5112 N Fairmount St Lot 102 St | 0.66mi | 3/2.0 | 1,056 (-8%) | 1mo | $42,000 | $40 | 55 |
Match score weights: distance 35% · size 25% · config 20% · recency 20%. Top-matched comps best support the ARV.
Projected returns pro-forma
-3.0% appreciation · 1.8% rent growth · sell at horizon
- IRR
- 42.9%
- Equity multiple
- 2.81×
- Total profit
- $27,950
- Equity at exit
- $8,201
- IRR
- 48.4%
- Equity multiple
- 5.40×
- Total profit
- $67,691
- Equity at exit
- $4,755
Cash invested: $15,400 (down + closing). Projections, not guarantees.
Landlord ↔ Tenant lean methodology
- Overall (STATE)
- 83 Strongly Landlord-Friendly
- State Iowa
- 83 Strongly Landlord-Friendly · R+6
- County
- — inherits STATE
- City
- — inherits STATE
ZIP-level market 52806
- Rents YoY
- 1.8%
- Active inventory
- 162
- Price-to-rent
- 3.5×
Monthly cashflow live
- Estimated rent
- $1,315 high interval (Pro) →
- Mortgage (P&I)
- −$288
- Tax est. 1.5%
- −$69 /mo · $825/yr
- Insurance
- −$23
- Flood insurance flood zone
- −$56 /mo · $670/yr
- HOA
- −$0
- Vacancy / Maint / Mgmt
- −$276
- Net cashflow
- $603
Break-even live
UW: 25.0% down · 7.5% · 30yr · 1.5% tax · 5.0% vac · 8.0% maint · 8.0% mgmt
Financing live
Cash to close
- Down payment
- $13,750
- Closing costs
- $1,650
- Reserves months
- —
- Total cash needed
- —
Loan-product check · same deal, 3 products live
Conventional
25% down · 7.5% · 30yr
- Down + closing
- —
- Monthly P&I
- —
- Monthly cashflow
- —
- DSCR
- —
- Eligible?
- —
Personal DTI + credit; lowest rate.
DSCR
20% down · 8.5% · 30yr
- Down + closing
- —
- Monthly P&I
- —
- Monthly cashflow
- —
- DSCR
- —
- Eligible?
- —
No personal income docs; deal must DSCR.
Hard money
10% down · 12.0% · 12mo
- Down + closing
- —
- Monthly P&I
- —
- Monthly cashflow
- —
- DSCR
- —
- Eligible?
- —
Short-term bridge; refi at stabilization.
Rent comps 14 comps
| Address | Beds | Baths | Sqft | Rent | $/sqft | DOM | Units | Dist |
|---|---|---|---|---|---|---|---|---|
| 4930 N Dittmer St Davenport, IA | 3.0 | 2.0 | 1104 | $1,184 | $1.07 | 13d | 1 | 0.25mi |
| 2806 W 47th St Davenport, IA | 3.0 | 2.0 | 1164 | $1,700 | $1.46 | 43d | 1 | 0.27mi |
| 4444 N Division St Davenport, IA | 2.0 | 1.0 | 800 | $895 | $1.12 | 13d | 1 | 1.08mi |
| 1935 W 40th St Davenport, IA | 2.0 | 1.0 | 585 | $950 | $1.62 | 13d | 8 | 1.08mi |
| 4406 N Division St Unit 4311-11 Davenport, IA | 2.0 | 1.0 | 800 | $895 | $1.12 | 43d | 1 | 1.09mi |
| 4323 N Division St Davenport, IA | 1.0–2.0 | 1.0 | 675 | $1,099 | $1.63 | 13d | 1 | 1.16mi |
| 5337 Villa Dr Davenport, IA | 2.0–3.0 | 2.5 | 1650 | $2,045 | $1.24 | 13d | 1 | 1.22mi |
| 7106 Hillandale Rd Unit 4 Davenport, IA | 2.0 | 1.0 | 747 | $975 | $1.31 | 43d | 1 | 1.43mi |
| 7104 Hillandale Rd Unit 11 Davenport, IA | 2.0 | 1.0 | 747 | $890 | $1.19 | 13d | 1 | 1.43mi |
| 3021 W 72nd St Unit 4 Davenport, IA | 3.0 | 1.5 | 1079 | $1,375 | $1.27 | 13d | 1 | 1.43mi |
| 7102 Hillandale Rd Unit 11 Davenport, IA | 2.0 | 1.0 | 747 | $975 | $1.31 | 13d | 1 | 1.44mi |
| 7112 Hillandale Rd Unit 11 Davenport, IA | 2.0 | 1.0 | 747 | $975 | $1.31 | 13d | 1 | 1.45mi |
| 7110 Hillandale Rd Unit OTE Davenport, IA | 2.0 | 1.0 | 747 | $975 | $1.31 | 13d | 1 | 1.45mi |
| 3536 Heatherton Dr Unit 4 Davenport, IA | 2.0 | 1.0 | 700 | $825 | $1.18 | 13d | 1 | 1.49mi |
Listing history 3 events
-
2026-01-20$55,000 Active 364-char remark
Show marketing remark (364 chars)
Main floor amenities and affordability unite in this 2018 manufactured home. This home features 3 bedrooms and 2 baths, spacious eat-in kitchen with stainless steel appliances. Primary bedroom suite conveniently offers a garden tub, walk-in shower and walk-in closet. Located in Silver Creek MHP managed by YES! Communities. Contact park for lease agreement terms.
-
2025-03-21price $58,000
-
2024-05-13$59,000 Active
ⓘ Source: listings_history table (triggers on properties + properties_extension) + one-shot
backfill from property_details.listing_events for pre-trigger history.
Climate risk First Street
- Flood 8/10 Severe FEMA zone AE · 99% chance over 30 yrs
- Wildfire 2/10 Low
- Heat 3/10 Moderate
- Air quality 3/10 Moderate 2 unhealthy d/yr today · 3 by 30 yrs out
Nearby sold comps map
Loading sold comps map…
Walkable amenities ~0.75 mi
Loading nearby amenities…
Taxation est. · year 1
- Rental income
- $15,774
- − Mortgage interest
- −$3,081
- − Property taxes
- −$825
- − Insurance
- −$945
- − Repairs & maintenance
- −$1,262
- − Management
- −$1,262
- − Depreciation
- −$1,600
- Taxable income
- $6,800
- Est. tax owed @ 24.0%
- −$1,632
- After-tax cash flow
- $5,599/yr
For passive investors: Depreciation is non-cash, so a rental often shows a tax loss while cash-flowing — sheltering income. Rental losses are passive: they offset passive income freely, and up to $25,000/yr can offset ordinary (W-2) income if you actively participate and your MAGI is under $100k (phasing out to $0 by $150k); unused losses carry forward. On sale, claimed depreciation is recaptured at up to 25%, and gains may owe capital-gains tax (a 1031 exchange can defer both). Figures are a year-1 estimate at your 24.0% rate — not tax advice; consult a CPA.
Condition & rehab AI · 2 photos
This 2018 manufactured home is in good condition with minimal repairs needed. It offers a good balance of affordability and amenities, making it a solid investment.
Value-add opportunities
- Both Paint exterior siding — Fresh paint enhances curb appeal and can add value to the home.
- Both Clean gutters — Clean gutters improve the home's appearance and prevent water damage.
- Both Replace worn flooring — Fresh flooring can make the home more appealing and increase its value.
- Both Update kitchen appliances — Modern appliances can make the kitchen more functional and attractive to potential buyers/renters.
Renovation cost estimate screening
Value-add ROI direction
- Both Paint exterior siding — Fresh paint enhances curb appeal and can add value to the home. ↑
- Both Clean gutters — Clean gutters improve the home's appearance and prevent water damage. ↑
- Both Replace worn flooring — Fresh flooring can make the home more appealing and increase its value. ↑
- Both Update kitchen appliances — Modern appliances can make the kitchen more functional and attractive to potential buyers/renters. ↑
ⓘ Cost ranges are severity-bucket heuristics (US national rule-of-thumb). Get contractor quotes + a written scope before underwriting a rehab budget.
Schools (NCES district)
- District
- Davenport Community School District
- NCES district ID
- 1908580
- Math proficiency
- 43% ▼ -11.00%
- Reading proficiency
- 50% ▼ -3.00%
- Median HH income
- $46,157
- Composite
- 39.49/100
- National rank
- #3951
- State rank
- #288 of 289 in IA
Livability — Davenport
- Score
- 79/100
- State rank
- #126
- US rank
- #2312
Category grades
Schools grade is shown separately in the Schools card above.
Census & demographics
- Census place
- Davenport, IA
- County
- Scott County · 144,583 people
- City population
- 103,319
- Metro
- Davenport-Moline-Rock Island, IA-IL
- Population (ZIP)
- 26,871
- Household income
- $74,297
- Rent vs Own
- Severe rent burden
- 735.0
Population outlook (Scott County) Hauer SSP2
- Today (2025)
- 188,878 people
- By 2030
- 196,648 · +4.1%
- By 2040
- 210,860 · +11.6%
- By 2050
- 224,359 · +18.8%
- By 2075
- 258,884 · +37.1%
- By 2100
- 286,447 · +51.7%
Race, ethnicity, and origin ACS 2023
- Neighborhood character
- Predominantly White (74%)
- Race & ethnicity
- White 74% Black 12% Hispanic / Latino 7% Two or more races 7% Asian 2%
- Hispanic origin (detail)
- Mexican 6%
- Common ancestry
- Slovak 2% Lithuanian 2% Iranian 1%
- Foreign-born
- 4% · Canada, Vietnam, China
- Languages at home
- 93% English-only · Spanish 3% Vietnamese 1% Chinese 1%
Political lean MEDSL · Scott
- 2024 margin
- Toss-up / Even · D 47.3% · R 51.2% · Other 1.4%
- 2008→2024 swing
- -18.4pp toward R · 2008: 14.6pp · 2024: -3.9pp
- All cycles
- 2024: R+3.9 2020: D+3.5 2016: D+1.4 2012: D+13.8 2008: D+14.6
Not yet ingested
- Civics
- —
Market trends
- HPI YoY
- ▼ -127.41%
- Current HPI
- 185.0808
- Rent YoY
- ▲ 1.80%
- Metro
- Davenport-Moline-Rock Island, IA-IL
- State GDP YoY
- ▲ 2.48%
- F500 in state
- 4
Industry mix (Fortune 500 HQ in IA)
| Industry | F500 HQs | Revenue |
|---|---|---|
| Financial Services | 1 | $16B |
|
||
| Retail / Convenience | 1 | $15B |
|
||
Price history
-6.8% since first listed3 events — show timeline
- 2026-01-20 Listed $55,000 Muscatine BOR
- 2025-03-21 Price Changed $58,000 Muscatine BOR
- 2024-05-13 Listed $59,000 Muscatine BOR
Cash-flow waterfall
monthlySold comps — $/sqft
last 12 mo · ≤1 miLoading sold comps…