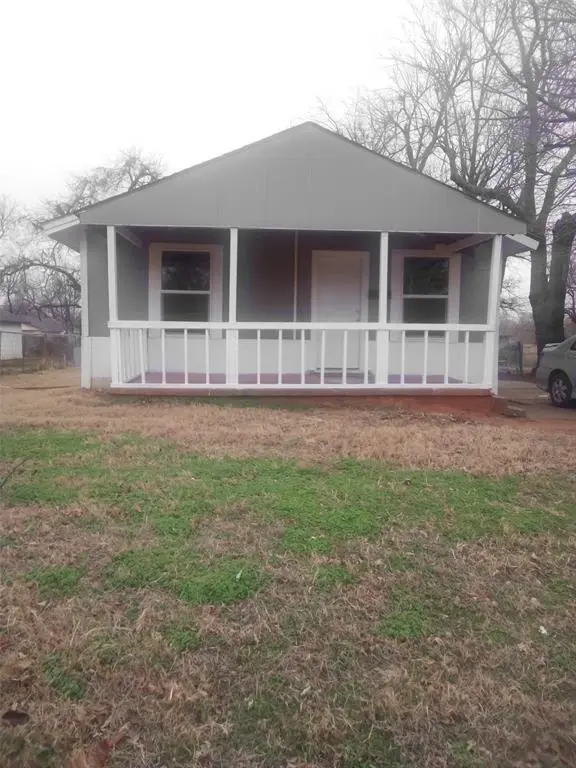
710 SE 31st St · Oklahoma City, OK
Flood risk 1/10 · Minimal
- FEMA flood zone
- X (unshaded)
- Chance of flooding over 30 yrs
- 0.0%
- Est. flood insurance / yr
- $507 – $1,088
Fire risk 1/10 · Minimal
- Est. fire insurance / yr
- $2,463 – $4,575
Heat risk 5/10 · Moderate
- Hot days now (above 107°F)
- 7 days/yr
- Hot days in 30 yrs
- 18 days/yr
Wind risk 2/10 · Minimal
- Chance of severe wind over 30 yrs
- 4.0%
Air-quality risk 1/10 · Minimal
- Unhealthy air days now
- 0 days/yr
- Unhealthy air days in 30 yrs
- 0 days/yr
Risk factors via First Street. Map © Google.
Why this score? — see what drove the B- grade
The composite is a weighted blend of 9 inputs, each scored 0–100. Each bar is that input's sub-score; the figure is the points it added to the 100-point composite (weight × sub-score).
- Cash flow +26.9/30.0
- ARV discount +11.4/15.0
- DSCR +9.3/10.0
- 1% rule +6.1/10.0
- Appreciation +5.9/10.0
- Livability +4.0/5.0
- Rent growth +2.5/5.0
- Condition / age +2.5/5.0
- Schools +0.7/10.0
$89,900
🖨 Deal sheet 📄 Offer letter ✓ Due diligence
Listing remarks MLS
Tenant-occupied investment property with a lease in place through June 2026, offering immediate and stable rental income. This home has been fully remodeled inside and out, providing a turnkey opportunity for investors seeking minimal maintenance and predictable cash flow. Recent updates enhance both interior and exterior appeal, making this property well-suited for buy-and-hold investors or those looking to add a stabilized asset to their portfolio. This home has a building that could be used as a garage or for extra storage. Showings will be done in consideration of tenants not being disturb excessively and do require a minimum of a 48 hour notice. **Additional photos coming soon
Key facts
- Fully remodeled
- Recent updates
- Extra storage
Tags
Neighborhood map
What this means for you Summary
Snapshot
- This is a 2-bed/1.0-bath single-family listed at $90k.
Deal economics
- At list price, monthly cash flow is $250 ($3k/yr) — positive.
- The deal already cash-flows at list — no discount required.
- Meets the 1% rule at list price ($1k rent vs $90k).
- Recommended offer: $79k (12.0% below list) — sets the bar for market timing.
- Cap rate 9.6% vs local median 3.7% in Oklahoma City — top-decile yield for the area; either an underpriced asset or a hidden risk that comps aren't pricing in. Stress-test before assuming the spread holds.
Location & tenants
- Location reads 80/100 on livability (#3 in OK, #1,635 nationally) — a professional / high-income tenant draw. Strengths: amenities A+, commute A+, cost of living A+; Watch: schools F, crime F.
- Oklahoma City (urban): math 7% / reading 10% proficiency, ranked #254 of 270 in OK (top 94%) — low school quality limits family demand, transient renter base, plan for 1-2y turnover; 82% free/reduced lunch — lower-income household profile, screen leases tightly.
- Market conditions: 83 active listings in the ZIP; 27 comparable units currently listed for rent nearby; rentals lingering (median 44d on market — plan ~5-8 weeks vacancy on turnover, expect pricing pressure); 52% of comp listings sitting > 30 days — soft ceiling on asking rent; 5,365 units permitted in Oklahoma County in 2024 (569 in 5+ unit buildings).
Forward outlook
- In year one you build about $2k of equity ($622 loan paydown + $2k appreciation (1.8% local appreciation)).
- Oklahoma County population projected at +41% by 2050 — long-run rental-demand tailwind backs the buy-and-hold thesis.
- At projected returns (1.8% appreciation + 3.0% rent growth), your $25k cash investment doubles in ~5 years — after that, you're playing with house money.
Negotiation context
- It's been on market 146 days — a 12% lower offer ($79k) is reasonable based on typical stale-listing flexibility.
- 2 sale attempts since 17y ago with the ask held roughly flat each time — persistent listings suggest the price (not the market) is what's stuck; bring a comps-based counter.
Risks & watch-outs
- Watch-outs: built in 1925 — expect roof / HVAC / electrical / plumbing capex.
- Climate carrying-cost: extreme-heat days projected 7→18/yr by 2055 (HVAC capex compounding) — expect insurance premiums to compound above CPI over the hold.
Questions for the listing agent
- It's been on market 146 days. Have you received any prior offers? Is the seller open to a 12% concession, seller financing, or rate buy-down credit?
- Built in 1925 — when were the roof, HVAC, electrical panel, plumbing, and water heater last replaced?
- Why hasn't it sold? Are there any deal-killer items the seller is aware of (foundation, flood, title, zoning, code violations)?
- Is there a deadline driving the sale (1031 exchange, divorce, estate, relocation)? That informs how much negotiation room exists.
- Schools are F-rated, which usually means shorter tenancies and higher turnover. Who's the typical renter profile here, and what's been the actual vacancy rate?
- Crime grade is F in this area — have there been break-ins, vandalism, or insurance claims at this property in the last 3 years? What carrier currently insures it and at what premium?
- What's the average days-on-market for RENTAL listings here right now (not sales)? A rising rental-DOM trend means longer vacancies and softer asking-rent achievability than the comps imply.
- What's the recent tenant-quality profile in this submarket — average credit score on applications, eviction rate, late-payment / NSF rate, and stable-employment percentage? A property-management company in the area should have these aggregated.
- How much new for-sale + rental construction is in the pipeline within 1–3 miles? Heavy new supply typically softens prices + rents 12–24 months out; constrained supply supports both.
Investment metrics
- 1% rule
- 1.11% ✓
- Cap rate
- 9.62%
- Cash-on-cash
- 11.90%
- DSCR
- 1.53
- GRM
- 7.5
CMA / ARV
- ARV (median comp)
- $98,392
- List price
- $89,900
- Delta
- -8.63%
- Verdict
- FAIR
- Comps
- 20 within 1.0 mi
Show comp detail 12 sales within ~0.75 mi
| Address | Dist | Beds/Ba | Sqft | Sold | Price | $/sf | Match |
|---|---|---|---|---|---|---|---|
| 720 SE 31st St | 0.03mi | 2/1.0 | 960 (+8%) | 9mo | $80,000 | $83 | 78 |
| 716 SE 31st St | 0.01mi | 3/1.0 (+1) | 864 (-3%) | 19mo | $123,000 | $142 | 74 |
| 717 SE 31st St | 0.03mi | 2/1.0 | 770 (-13%) | 7mo | $54,900 | $71 | 70 |
| 633 SE 39th St | 0.52mi | 3/1.0 (+1) | 885 (-0%) | 5mo | $156,000 | $176 | 66 |
| 206 SE 25th St | 0.68mi | 2/1.0 | 884 (-0%) | 6mo | $34,000 | $38 | 62 |
| 617 SW 35th St | 0.28mi | 2/1.0 | 776 (-13%) | 6mo | $146,000 | $188 | 60 |
| 312 SE 40th St | 0.72mi | 2/1.0 | 843 (-5%) | 3mo | $160,000 | $190 | 55 |
| 414 SE 24th St | 0.58mi | 2/1.0 | 860 (-3%) | 16mo | $89,000 | $103 | 54 |
| 420 SE 22nd St | 0.72mi | 2/1.0 | 918 (+3%) | 8mo | $45,000 | $49 | 54 |
| 316 SE Grand Blvd | 0.50mi | 2/1.0 | 1,020 (+15%) | 2mo | $85,000 | $83 | 50 |
| 313 SE 40th St | 0.70mi | 2/1.0 | 836 (-6%) | 12mo | $155,900 | $186 | 48 |
| 419 SE 23rd St | 0.65mi | 2/1.0 | 832 (-6%) | 20mo | $61,000 | $73 | 42 |
Match score weights: distance 35% · size 25% · config 20% · recency 20%. Top-matched comps best support the ARV.
Projected returns pro-forma
1.75% appreciation · 3.0% rent growth · sell at horizon
- IRR
- 15.6%
- Equity multiple
- 1.83×
- Total profit
- $20,875
- Equity at exit
- $34,235
- IRR
- 18.3%
- Equity multiple
- 3.37×
- Total profit
- $59,623
- Equity at exit
- $48,375
Cash invested: $25,172 (down + closing). Projections, not guarantees.
Landlord ↔ Tenant lean methodology
- Overall (STATE)
- 83 Strongly Landlord-Friendly
- State Oklahoma
- 83 Strongly Landlord-Friendly · R+20
- County
- — inherits STATE
- City
- — inherits STATE
ZIP-level market 73129
- Home prices YoY
- 0.7%
- Active inventory
- 83
- Price-to-rent
- 7.5×
Monthly cashflow live
- Estimated rent
- $1,000 high interval (Pro) →
- Mortgage (P&I)
- −$471
- Tax from tax record
- −$32 /mo · $379/yr
- Insurance
- −$37
- HOA
- −$0
- Vacancy / Maint / Mgmt
- −$210
- Net cashflow
- $250
Break-even live
UW: 25.0% down · 7.5% · 30yr · 1.5% tax · 5.0% vac · 8.0% maint · 8.0% mgmt
Financing live
Cash to close
- Down payment
- $22,475
- Closing costs
- $2,697
- Reserves months
- —
- Total cash needed
- —
Loan-product check · same deal, 3 products live
Conventional
25% down · 7.5% · 30yr
- Down + closing
- —
- Monthly P&I
- —
- Monthly cashflow
- —
- DSCR
- —
- Eligible?
- —
Personal DTI + credit; lowest rate.
DSCR
20% down · 8.5% · 30yr
- Down + closing
- —
- Monthly P&I
- —
- Monthly cashflow
- —
- DSCR
- —
- Eligible?
- —
No personal income docs; deal must DSCR.
Hard money
10% down · 12.0% · 12mo
- Down + closing
- —
- Monthly P&I
- —
- Monthly cashflow
- —
- DSCR
- —
- Eligible?
- —
Short-term bridge; refi at stabilization.
Rent comps 27 comps
| Address | Beds | Baths | Sqft | Rent | $/sqft | DOM | Units | Dist |
|---|---|---|---|---|---|---|---|---|
| 407 SE 25th St Oklahoma City, OK | 3.0 | 1.0 | 896 | $1,275 | $1.42 | 44d | 1 | 0.56mi |
| 317 SE 24th St Oklahoma City, OK | 2.0 | 1.0 | 917 | $950 | $1.04 | 4d | 1 | 0.66mi |
| 630 SE 21st St Oklahoma City, OK | 3.0 | 2.0 | 1000 | $1,095 | $1.09 | 43d | 1 | 0.74mi |
| 526 SE 21st St Oklahoma City, OK | 3.0 | 1.0 | 1054 | $1,150 | $1.09 | 4d | 1 | 0.76mi |
| 4101 S Shields Blvd Unit Shields 3B Oklahoma City, OK | 3.0 | 2.0 | 957 | $1,050 | $1.10 | 23d | 1 | 0.80mi |
| 4101 S Shields Blvd Apt 3B Oklahoma City, OK | 3.0 | 2.0 | 957 | $1,025 | $1.07 | 4d | 1 | 0.80mi |
| 726 SE 20th St Oklahoma City, OK | 2.0 | 1.0 | 672 | $1,095 | $1.63 | 43d | 1 | 0.81mi |
| 1413 SE 39th St Oklahoma City, OK | 3.0 | 1.0 | 1004 | $1,125 | $1.12 | 43d | 1 | 0.83mi |
| 109 SE 42nd St Apt A Oklahoma City, OK | 2.0 | 1.0 | 800 | $799 | $1.00 | 17d | 1 | 0.93mi |
| 101 SE 42nd St Unit B Oklahoma City, OK | 2.0 | 1.0 | 740 | $645 | $0.87 | 43d | 1 | 0.95mi |
| 220 SW 34th St Oklahoma City, OK | 1.0 | 1.0 | 625 | $725 | $1.16 | 43d | 1 | 1.04mi |
| 3312 S Harvey Ave Oklahoma City, OK | 2.0 | 1.0 | 840 | $1,100 | $1.31 | 20d | 1 | 1.07mi |
| 116 SW 23rd St Oklahoma City, OK | 1.0 | 1.0 | 700 | $650 | $0.93 | 43d | 1 | 1.07mi |
| 115 SW 23rd St Oklahoma City, OK | 1.0 | 1.0 | 750 | $575 | $0.77 | 16d | 1 | 1.08mi |
| 316 SW 27th St Unit 4 Oklahoma City, OK | 1.0 | 1.0 | 615 | $679 | $1.10 | 11d | 1 | 1.17mi |
| 316 SW 27th St Unit 8 Oklahoma City, OK | 1.0 | 1.0 | 615 | $679 | $1.10 | 43d | 1 | 1.17mi |
| 3913 S Harvey Ave Unit 2 Oklahoma City, OK | 1.0 | 1.0 | 568 | $900 | $1.58 | 43d | 1 | 1.20mi |
| 4908 S Stiles Ave Oklahoma City, OK | 2.0 | 1.0 | 600 | $1,000 | $1.67 | 43d | 1 | 1.20mi |
| 404 SW 26th St Unit 6 Oklahoma City, OK | 1.0 | 1.0 | 600 | $645 | $1.07 | 11d | 1 | 1.25mi |
| 3906 S Hudson Ave Oklahoma City, OK | 1.0 | 1.0 | 700 | $750 | $1.07 | 23d | 1 | 1.26mi |
| 1528 SE 47th Pl Oklahoma City, OK | 3.0 | 1.0 | 1092 | $1,300 | $1.19 | 4d | 1 | 1.39mi |
| 3407 S Lee Ave Oklahoma City, OK | 2.0 | 1.0 | 900 | $980 | $1.09 | 43d | 1 | 1.41mi |
| 3618 S Lee Ave Oklahoma City, OK | 1.0 | 1.0 | 760 | $850 | $1.12 | 43d | 1 | 1.41mi |
| 3616 S Lee Ave Oklahoma City, OK | 1.0 | 1.0 | 760 | $775 | $1.02 | 43d | 1 | 1.41mi |
| 540 SW 24th St #3 Oklahoma City, OK | 1.0 | 1.0 | 726 | $625 | $0.86 | 43d | 1 | 1.46mi |
| 1528 SE 49th Ter Oklahoma City, OK | 3.0 | 1.0 | 912 | $1,100 | $1.21 | 23d | 1 | 1.47mi |
| 709 SE 10th St Oklahoma City, OK | 2.0 | 1.0 | 864 | $995 | $1.15 | 4d | 1 | 1.48mi |
Listing history 16 events
-
2026-06-18days on market $89,900 Active 146 DOM
-
2026-06-17days on market $89,900 Active 145 DOM
-
2026-06-16days on market $89,900 Active 144 DOM
-
2026-06-15days on market $89,900 Active 143 DOM
-
2026-06-13days on market $89,900 Active 141 DOM
-
2026-06-09days on market $89,900 Active 137 DOM
-
2026-06-08days on market $89,900 Active 136 DOM
-
2026-06-07days on market $89,900 Active 135 DOM
-
2026-06-05days on market $89,900 Active 132 DOM
-
2026-06-03days on market $89,900 Active 131 DOM
-
2026-06-02days on market $89,900 Active 130 DOM
-
2026-06-01days on market $89,900 Active 129 DOM
-
2026-05-31days on market $89,900 Active 128 DOM
-
2026-01-23$89,900 Active 691-char remark
Show marketing remark (691 chars)
Tenant-occupied investment property with a lease in place through June 2026, offering immediate and stable rental income. This home has been fully remodeled inside and out, providing a turnkey opportunity for investors seeking minimal maintenance and predictable cash flow. Recent updates enhance both interior and exterior appeal, making this property well-suited for buy-and-hold investors or those looking to add a stabilized asset to their portfolio. This home has a building that could be used as a garage or for extra storage. Showings will be done in consideration of tenants not being disturb excessively and do require a minimum of a 48 hour notice. **Additional photos coming soon
-
2009-12-01historical
-
2009-05-18$36,329
ⓘ Source: listings_history table (triggers on properties + properties_extension) + one-shot
backfill from property_details.listing_events for pre-trigger history.
Tax reassessment forecast OK · Resets to sale price
- Current annual tax
- $379 · $32/mo
- Projected year-2 tax
- $809 · $67/mo
- Expected delta
- +$430/yr (+$36/mo · 113.2%)
ⓘ Screening estimate from a state-policy table — verify with the county assessor before closing.
Climate risk First Street
- Flood 1/10 Low FEMA zone X (unshaded) · 0% chance over 30 yrs
- Wildfire 1/10 Low
- Heat 5/10 Major 7 d/yr ≥107°F today · 18 d/yr by 30 yrs out
- Wind 2/10 Low 4% chance of damaging wind over 30 yrs
- Air quality 1/10 Low 0 unhealthy d/yr today · 0 by 30 yrs out
Nearby sold comps map
Loading sold comps map…
Walkable amenities ~0.75 mi
Loading nearby amenities…
Taxation est. · year 1
- Rental income
- $12,002
- − Mortgage interest
- −$5,036
- − Property taxes
- −$379
- − Insurance
- −$450
- − Repairs & maintenance
- −$960
- − Management
- −$960
- − Depreciation
- −$2,615
- Taxable income
- $1,602
- Est. tax owed @ 24.0%
- −$384
- After-tax cash flow
- $2,611/yr
For passive investors: Depreciation is non-cash, so a rental often shows a tax loss while cash-flowing — sheltering income. Rental losses are passive: they offset passive income freely, and up to $25,000/yr can offset ordinary (W-2) income if you actively participate and your MAGI is under $100k (phasing out to $0 by $150k); unused losses carry forward. On sale, claimed depreciation is recaptured at up to 25%, and gains may owe capital-gains tax (a 1031 exchange can defer both). Figures are a year-1 estimate at your 24.0% rate — not tax advice; consult a CPA.
Schools (NCES district)
- District
- Oklahoma City
- NCES district ID
- 4022770
- Math proficiency
- 7% ▼ -5.00%
- Reading proficiency
- 10% ▼ -6.00%
- Median HH income
- $35,606
- Composite
- 7.0/100
- National rank
- #9970
- State rank
- #254 of 270 in OK
Livability — Oklahoma City
- Score
- 80/100
- State rank
- #3
- US rank
- #1635
Category grades
Schools grade is shown separately in the Schools card above.
Census & demographics
- Census place
- Oklahoma City, OK
- County
- Oklahoma County · 771,644 people
- City population
- 498,656
- Metro
- Oklahoma City, OK
- Population (ZIP)
- 20,014
- Household income
- $46,670
- Rent vs Own
- Severe rent burden
- 611.0
Population outlook (Oklahoma County) Hauer SSP2
- Today (2025)
- 911,875 people
- By 2030
- 982,413 · +7.7%
- By 2040
- 1,130,468 · +24.0%
- By 2050
- 1,288,422 · +41.3%
- By 2075
- 1,711,482 · +87.7%
- By 2100
- 2,088,448 · +129.0%
Race, ethnicity, and origin ACS 2023
- Neighborhood character
- Diverse neighborhood (Simpson 0.61)
- Race & ethnicity
- Hispanic / Latino 57% Two or more races 26% White 26% Black 9% Native American 7% Asian 1%
- Hispanic origin (detail)
- Mexican 53%
- Common ancestry
- Italian 1% Lithuanian 1% Slovak 1%
- Foreign-born
- 24% · Canada, Dominican Republic
- Languages at home
- 54% English-only · Spanish 44% Other Asian/Pacific 1% Vietnamese 1%
Political lean MEDSL · Oklahoma
- 2024 margin
- Toss-up / Even · D 48.0% · R 49.7% · Other 2.3%
- 2008→2024 swing
- +15.1pp toward D · 2008: -16.8pp · 2024: -1.7pp
- All cycles
- 2024: R+1.7 2020: R+1.1 2016: R+10.5 2012: R+16.7 2008: R+16.8
Not yet ingested
- Civics
- —
Market trends
- HPI YoY
- ▲ 1.75%
- Current HPI
- 250.8581
- Rent YoY
- —
- Metro
- Oklahoma City, OK
- State GDP YoY
- ▲ 1.55%
- F500 in state
- 6
Industry mix (Fortune 500 HQ in OK)
| Industry | F500 HQs | Revenue |
|---|---|---|
| Energy | 3 | $48B |
|
||
Price history
+147.5% since first listed3 events — show timeline
- 2026-01-23 Listed $89,900 MLSOK
- 2009-12-01 Listing Removed — MLSOK
- 2009-05-18 Listed $36,329 MLSOK
Property tax history
+5.5%/yrLatest (2025): $379 · +4.4% YoY. Source: county tax records.
Cash-flow waterfall
monthlySold comps — $/sqft
last 12 mo · ≤1 miLoading sold comps…