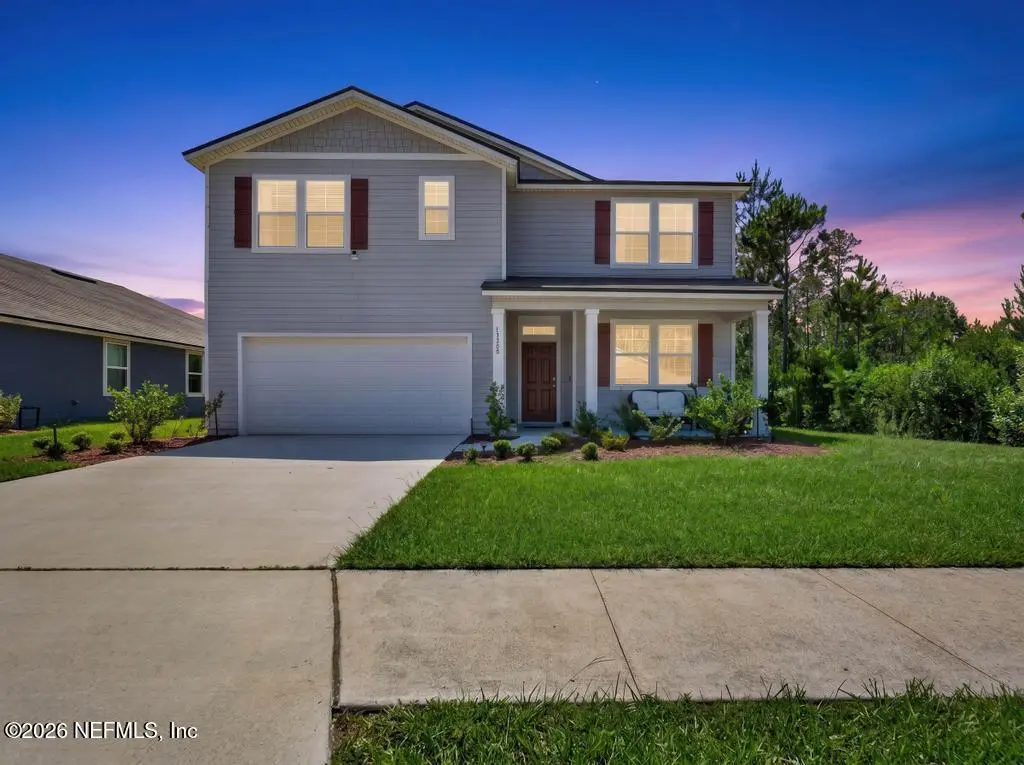
75588 Bridgewater Dr · Jacksonville, FL
Flood risk 1/10 · Minimal
- FEMA flood zone
- A
- Chance of flooding over 30 yrs
- 0.0%
- Est. flood insurance / yr
- $1,009 – $1,996
Fire risk 7/10 · Major
- Est. fire insurance / yr
- $947 – $1,759
Heat risk 9/10 · Severe
- Hot days now (above 107°F)
- 7 days/yr
- Hot days in 30 yrs
- 20 days/yr
Wind risk 9/10 · Severe
- Chance of severe wind over 30 yrs
- 99.0%
Air-quality risk 5/10 · Moderate
- Unhealthy air days now
- 8 days/yr
- Unhealthy air days in 30 yrs
- 10 days/yr
Risk factors via First Street. Map © Google.
Why this score? — see what drove the D grade
The composite is a weighted blend of 9 inputs, each scored 0–100. Each bar is that input's sub-score; the figure is the points it added to the 100-point composite (weight × sub-score).
- Appreciation +10.0/10.0
- ARV discount +8.4/15.0
- Schools +6.0/10.0
- Cash flow +5.9/30.0
- Livability +4.2/5.0
- Rent growth +3.2/5.0
- Condition / age +2.5/5.0
- 1% rule +1.7/10.0
- DSCR +0.3/10.0
$420,000
🖨 Deal sheet (PDF) 📄 Offer letter ✓ Due diligence
Listing remarks MLS
Welcome to River Glen! We are proud to build affordable homes in this well-established Yulee neighborhood. Just off FL-200 and I-95, residents will enjoy quick access to Jacksonville and Amelia Island's world-renowned beaches. River Glen features open concept one and two-story home plans and homeowners have access to resort style amenities. You will never be too far from home with Home Is Connected®. Your new home comes with an industry-leading suite of smart home products that keep you connected with the people and place you value most.
Key facts
- First-floor bedroom
- Community amenities
- Full bath
Tags
Property features AI
Finance
- HOA & community: Community association with annual fee; Annual association fee $110; CDD fee applies ($3,068); Community amenities: clubhouse, fitness center, playground, tennis courts
Exterior
- Parking: Attached garage; 2-car garage
- Utilities: Public sewer; Electricity connected; Water connected; Sewer connected
- Home design: Single-family residence
- Construction: Frame, stucco, and vinyl siding construction; Shingle roof
- Exterior features: Asphalt road access; Community pool (not private)
Interior
- Kitchen: Dishwasher; Electric range; Microwave; Refrigerator
- Bedrooms: 5 bedrooms
- Flooring: Carpet; Vinyl
- Bathrooms: 3 full bathrooms
- Heating & cooling: Central heating; Central air conditioning
- Interior features: Eat-in kitchen; Entrance foyer; Kitchen island; Pantry; Primary bathroom with tub and shower; Walk-in closets
Neighborhood map
What this means for you Summary
Snapshot
- This is a 5-bed/3.0-bath single-family listed at $420k.
Deal economics
- At list price, monthly cash flow is $-945 ($-11k/yr) — negative.
- To cash-flow at today's rent, offer at most $253k (39.8% below list).
- To meet the 1% rule (rent ≥ 1% of price), the offer needs to be $281k (33.1% below list).
- Recommended offer: $253k (39.8% below list) — sets the bar for cash-flow.
Location & tenants
- Location reads 83/100 on livability (#50 in FL, #911 nationally) — a professional / high-income tenant draw. Strengths: amenities A+, commute A+, housing A+.
- Nassau (town): math 74% / reading 65% proficiency, ranked #4 of 73 in FL (top 6%) — acceptable for families but not a draw, mixed tenant base, ~2y average lease.
- Zoned schools: Wildlight Elementary (math 90% / reading 80%, grade A+, #35 of 2,144 statewide, top 2%, 1,025 students, 34% FRL); Yulee Middle School (math 73% / reading 61%, grade A-, #80 of 571 statewide, top 14%, 1,202 students, 41% FRL); Yulee High School (math 52% / reading 54%, grade C-, #148 of 667 statewide, top 23%, 1,407 students, 35% FRL) — zoned schools at 37% FRL track the district average.
- Market conditions: Rents rising (+2.9%/yr); 601 active listings in the ZIP; 10 comparable units currently listed for rent nearby; rentals at typical pace (median 21d on market — plan ~3-4 weeks tenant-placement turnaround); solid renter incomes; 953 units permitted in Nassau County in 2024 (24 in 5+ unit buildings).
- This rent runs 36% of the median local income ($93k/yr) — at the standard rent-burdened threshold; future hikes will face affordability resistance.
Forward outlook
- In year one you build about $45k of equity ($3k loan paydown + $42k appreciation (10.0% local appreciation)).
- Nassau County population projected at +17% by 2050 — long-run rental-demand tailwind backs the buy-and-hold thesis.
- By year 2, paydown + projected appreciation supports a ~$72k cash-out refi (75% LTV) — recoverable capital for the next deal without selling this one.
Negotiation context
- Only 9 days on market — expect competitive offers; lowballing is unlikely to land.
- 3 sale attempts since 4y ago with the ask held roughly flat each time — persistent listings suggest the price (not the market) is what's stuck; bring a comps-based counter.
- Current owner paid $365k; 15% above their basis — modest negotiation headroom, anchor on the comps not their cost.
Risks & watch-outs
- Watch-outs: flood insurance adds $125/mo.
- Climate carrying-cost: in FEMA flood zone A (mandatory federal flood insurance); severe wind risk, 99% chance of damaging wind over 30y; major wildfire risk; extreme-heat days projected 7→20/yr by 2055 (HVAC capex compounding) — expect insurance premiums to compound above CPI over the hold.
Questions for the listing agent
- What do current leases actually rent for vs. the listed asking? Can we see a recent rent roll and the last 12 months of T-12 income?
- What's the actual annual flood-insurance premium (NFIP or private), and is the property in a SFHA with mandatory coverage?
- What does the HOA fee cover, when was the last increase, and are there any pending special assessments or reserve-fund shortfalls?
- Is there a deadline driving the sale (1031 exchange, divorce, estate, relocation)? That informs how much negotiation room exists.
- Schools are B-rated — typically a magnet for longer-tenancy family renters. What's the average tenant stay here, and is there a school-zone premium baked into asking?
- The area grade is low — what's the realistic commute time and amenity access for the typical tenant pool here? Any planned neighborhood developments (good or bad) we should know about?
- What's the average days-on-market for RENTAL listings here right now (not sales)? A rising rental-DOM trend means longer vacancies and softer asking-rent achievability than the comps imply.
- What's the recent tenant-quality profile in this submarket — average credit score on applications, eviction rate, late-payment / NSF rate, and stable-employment percentage? A property-management company in the area should have these aggregated.
- How much new for-sale + rental construction is in the pipeline within 1–3 miles? Heavy new supply typically softens prices + rents 12–24 months out; constrained supply supports both.
Investment metrics
- 1% rule
- 0.67% ✗
- Cap rate
- 3.95%
- Cash-on-cash
- -8.37%
- DSCR
- 0.63
- GRM
- 12.5
CMA / ARV
- ARV (on-the-fly)
- $428,968
- Comps found
- 12
Show comp detail 12 sales within ~0.75 mi
| Address | Dist | Beds/Ba | Sqft | Sold | Price | $/sf | Match |
|---|---|---|---|---|---|---|---|
| 75754 Egret Landing Ct | 0.13mi | 5/3.0 | 2,511 (+1%) | 3mo | $434,000 | $173 | 90 |
| 75274 Bridgewater Dr | 0.40mi | 5/3.0 | 2,494 (0%) | 4mo | $318,990 | $128 | 78 |
| 65093 River Glen Pkwy | 0.52mi | 5/3.0 | 2,512 (+1%) | 7mo | $380,000 | $151 | 69 |
| 77041 Cobblestone Dr | 0.52mi | 5/3.0 | 2,356 (-6%) | 5mo | $460,000 | $195 | 62 |
| 65627 Edgewater Dr | 0.61mi | 4/4.0 (-1) | 2,475 (-1%) | 1mo | $375,000 | $152 | 60 |
| 65704 Edgewater Dr | 0.53mi | 4/4.0 (-1) | 2,566 (+3%) | 2mo | $442,000 | $172 | 60 |
| 65506 River Glen Pkwy | 0.18mi | 4/2.0 (-1) | 2,160 (-13%) | 3mo | $400,000 | $185 | 58 |
| 77170 Cobblestone Dr | 0.63mi | 4/3.0 (-1) | 2,416 (-3%) | 4mo | $365,000 | $151 | 57 |
| 75770 Egret Landing Ct | 0.14mi | 4/2.0 (-1) | 2,160 (-13%) | 6mo | $385,000 | $178 | 57 |
| 75394 Bridgewater Dr | 0.27mi | 4/2.0 (-1) | 2,129 (-15%) | 5mo | $355,000 | $167 | 50 |
| 65570 Bowfin Spring Ct | 0.33mi | 4/2.0 (-1) | 2,132 (-14%) | 5mo | $439,900 | $206 | 47 |
| 65045 River Glen Pkwy | 0.72mi | 4/3.0 (-1) | 2,339 (-6%) | 6mo | $359,000 | $153 | 46 |
Match score weights: distance 35% · size 25% · config 20% · recency 20%. Top-matched comps best support the ARV.
Projected returns pro-forma
10.0% appreciation · 2.88% rent growth · sell at horizon
- IRR
- 17.5%
- Equity multiple
- 2.43×
- Total profit
- $168,401
- Equity at exit
- $378,369
- IRR
- 16.5%
- Equity multiple
- 5.62×
- Total profit
- $542,981
- Equity at exit
- $815,968
Cash invested: $117,600 (down + closing). Projections, not guarantees.
Landlord ↔ Tenant lean methodology
- Overall (STATE)
- 87 Strongly Landlord-Friendly
- State Florida
- 87 Strongly Landlord-Friendly · R+3
- County
- — inherits STATE
- City
- — inherits STATE
ZIP-level market 32097
- Home prices YoY
- 19.5%
- Rents YoY
- 2.9%
- Active inventory
- 601
- Price-to-rent
- 12.5×
Monthly cashflow live
- Estimated rent
- $2,810 high interval (Pro) →
- Mortgage (P&I)
- −$2,203
- Tax from tax record
- −$653 /mo · $7,841/yr
- Insurance
- −$175
- Flood insurance flood zone
- −$125 /mo · $1,502/yr
- HOA
- −$9
- Vacancy / Maint / Mgmt
- −$590
- Net cashflow
- $-945
Break-even live
Sensitivity live
| Price | -10% $-708 | -5% $-826 | +0% $-945 | +5% $-1,064 | +10% $-1,183 |
|---|---|---|---|---|---|
| Rent | -10% $-1,167 | -5% $-1,056 | +0% $-945 | +5% $-834 | +10% $-723 |
| Rate | -1.0pp $-734 | -0.5pp $-838 | base $-945 | +0.5pp $-1,054 | +1.0pp $-1,165 |
UW: 25.0% down · 7.5% · 30yr · 1.5% tax · 5.0% vac · 8.0% maint · 8.0% mgmt
Financing live
Cash to close
- Down payment
- $105,000
- Closing costs
- $12,600
- Reserves months
- —
- Total cash needed
- —
Loan-product check · same deal, 3 products live
Conventional
25% down · 7.5% · 30yr
- Down + closing
- —
- Monthly P&I
- —
- Monthly cashflow
- —
- DSCR
- —
- Eligible?
- —
Personal DTI + credit; lowest rate.
DSCR
20% down · 8.5% · 30yr
- Down + closing
- —
- Monthly P&I
- —
- Monthly cashflow
- —
- DSCR
- —
- Eligible?
- —
No personal income docs; deal must DSCR.
Hard money
10% down · 12.0% · 12mo
- Down + closing
- —
- Monthly P&I
- —
- Monthly cashflow
- —
- DSCR
- —
- Eligible?
- —
Short-term bridge; refi at stabilization.
Rent comps 10 comps
| Address | Beds | Baths | Sqft | Rent | $/sqft | DOM | Units | Dist |
|---|---|---|---|---|---|---|---|---|
| 65303 River Glen Pkwy Yulee, FL | 4.0 | 2.0 | 2160 | $2,400 | $1.11 | 25d | 1 | 0.24mi |
| 70305 Winding River Dr Yulee, FL | 4.0 | 3.0 | 2042 | $2,500 | $1.22 | 25d | 1 | 0.34mi |
| 75215 Fern Creek Dr Yulee, FL | 4.0 | 2.5 | 2898 | $2,900 | $1.00 | 16d | 1 | 0.47mi |
| 75008 Morning Glen Ct Yulee, FL | 4.0 | 2.0 | 1856 | $2,300 | $1.24 | 25d | 1 | 0.57mi |
| 75075 Morning Glen Ct Yulee, FL | 4.0 | 2.0 | 1856 | $2,399 | $1.29 | 6d | 1 | 0.58mi |
| 65013 Lagoon Forest Dr Yulee, FL | 4.0 | 2.5 | 2245 | $2,800 | $1.25 | 12d | 1 | 0.59mi |
| 75094 Fern Creek Dr Yulee, FL | 4.0 | 2.0 | 2193 | $2,495 | $1.14 | 3d | 1 | 0.70mi |
| 75047 Brookwood Dr Yulee, FL | 5.0 | 3.0 | 3300 | $3,405 | $1.03 | 5d | 1 | 0.88mi |
| 76195 Deerwood Dr Yulee, FL | 4.0 | 2.5 | 2757 | $2,475 | $0.90 | 25d | 1 | 0.97mi |
| 75470 Sunberry Dr Yulee, FL | 5.0 | 4.0 | 2903 | $3,150 | $1.09 | 21d | 1 | 1.41mi |
HOA detail
- Monthly dues
- $9 · $108/yr
Listing history 7 events
-
2026-06-21days on market $420,000 Active 9 DOM
-
2026-06-18days on market $420,000 Active 6 DOM
-
2026-06-17days on market $420,000 Active 5 DOM
-
2026-06-16days on market $420,000 Active 4 DOM
-
2026-06-15days on market $420,000 Active 3 DOM
-
2026-06-13remarks 699-char remark
-
2026-06-13$420,000 Active 1 DOM
ⓘ Source: listings_history table (triggers on properties + properties_extension) + one-shot
backfill from property_details.listing_events for pre-trigger history.
Tax reassessment forecast FL · Resets to sale price
- Current annual tax
- $7,841 · $653/mo
- Projected year-2 tax
- $7,841 · $653/mo
- Expected delta
- $0/yr ($0/mo · -0.0%)
ⓘ Screening estimate from a state-policy table — verify with the county assessor before closing.
Climate risk First Street
- Flood 1/10 Low FEMA zone A · 0% chance over 30 yrs
- Wildfire 7/10 Severe
- Heat 9/10 Extreme 7 d/yr ≥107°F today · 20 d/yr by 30 yrs out
- Wind 9/10 Extreme 99% chance of damaging wind over 30 yrs
- Air quality 5/10 Major 8 unhealthy d/yr today · 10 by 30 yrs out
Nearby sold comps map
Loading sold comps map…
Walkable amenities ~0.75 mi
Loading nearby amenities…
Taxation est. · year 1
- Rental income
- $33,719
- − Mortgage interest
- −$23,527
- − Property taxes
- −$7,841
- − Insurance
- −$3,602
- − Repairs & maintenance
- −$2,697
- − Management
- −$2,697
- − HOA
- −$108
- − Depreciation
- −$12,218
- Taxable loss
- −$18,972
- Est. tax savings @ 24.0%
- +$4,553
- After-tax cash flow
- $-6,790/yr
For passive investors: Depreciation is non-cash, so a rental often shows a tax loss while cash-flowing — sheltering income. Rental losses are passive: they offset passive income freely, and up to $25,000/yr can offset ordinary (W-2) income if you actively participate and your MAGI is under $100k (phasing out to $0 by $150k); unused losses carry forward. On sale, claimed depreciation is recaptured at up to 25%, and gains may owe capital-gains tax (a 1031 exchange can defer both). Figures are a year-1 estimate at your 24.0% rate — not tax advice; consult a CPA.
Schools (NCES district)
- District
- Nassau
- NCES district ID
- 1201350
- Math proficiency
- 74% ▼ -2.00%
- Reading proficiency
- 65% ▼ -2.00%
- Median HH income
- $58,267
- Composite
- 59.79/100
- National rank
- #899
- State rank
- #4 of 73 in FL
Livability — Jacksonville
- Score
- 83/100
- State rank
- #50
- US rank
- #911
Category grades
Schools grade is shown separately in the Schools card above.
Census & demographics
- County
- Nassau County · 67,729 people
- City population
- 979,034
- Metro
- Jacksonville, FL
- Population (ZIP)
- 26,700
- Household income
- $93,161
- Rent vs Own
- Severe rent burden
- 404.0
Population outlook (Nassau County) Hauer SSP2
- Today (2025)
- 88,419 people
- By 2030
- 92,679 · +4.8%
- By 2040
- 99,257 · +12.3%
- By 2050
- 103,378 · +16.9%
- By 2075
- 109,726 · +24.1%
- By 2100
- 107,006 · +21.0%
Race, ethnicity, and origin ACS 2023
- Neighborhood character
- Predominantly White (75%)
- Race & ethnicity
- White 75% Two or more races 9% Black 9% Hispanic / Latino 8% Asian 1% Native American 1%
- Hispanic origin (detail)
- Mexican 2% Puerto Rican 2%
- Common ancestry
- Lithuanian 4% Italian 3% Romanian 2%
- Foreign-born
- 4% · Canada, Vietnam
- Languages at home
- 93% English-only · Spanish 5% Vietnamese 1%
Political lean MEDSL · Nassau
- 2024 margin
- Solid R (+46.9) · D 26.1% · R 73.1%
- 2008→2024 swing
- -3.1pp toward R · 2008: -43.8pp · 2024: -46.9pp
- All cycles
- 2024: R+46.9 2020: R+45.9 2016: R+50.2 2012: R+48.6 2008: R+43.8
Not yet ingested
- Civics
- —
Market trends
- HPI YoY
- ▲ 49.35%
- Current HPI
- 301.9299
- Rent YoY
- ▲ 2.88%
- Metro
- Jacksonville, FL
- State GDP YoY
- ▲ 3.28%
- F500 in state
- 36
Industry mix (Fortune 500 HQ in FL)
| Industry | F500 HQs | Revenue |
|---|---|---|
| Industrial Technology | 2 | $29B |
|
||
| Insurance | 2 | $17B |
|
||
| Retail | 1 | $60B |
|
||
| Technology Distribution | 1 | $58B |
|
||
| Homebuilding | 1 | $35B |
|
||
| Technology Manufacturing | 1 | $35B |
|
||
Price history
+16.7% since first listed13 events — show timeline
- 2026-06-12 Listed $420,000 realMLS
- 2023-07-31 Sold (MLS) $364,990 AINCAR
- 2023-07-31 Sold (MLS) $364,990 realMLS
- 2023-01-30 Pending — AINCAR
- 2023-01-30 Pending — realMLS
- 2023-01-25 Price Changed $364,990 realMLS
- 2023-01-25 Price Changed $364,990 AINCAR
- 2023-01-24 Price Changed $362,990 realMLS
- 2023-01-24 Price Changed $362,990 AINCAR
- 2023-01-17 Price Changed $361,990 realMLS
- 2023-01-17 Price Changed $361,990 AINCAR
- 2022-12-29 Listed $359,990 AINCAR
- 2022-12-29 Listed $359,990 realMLS
Property tax history
+279.5%/yrLatest (2025): $7,841 · -5.9% YoY. Source: county tax records.
Cash-flow waterfall
monthlySold comps — $/sqft
last 12 mo · ≤1 miLoading sold comps…