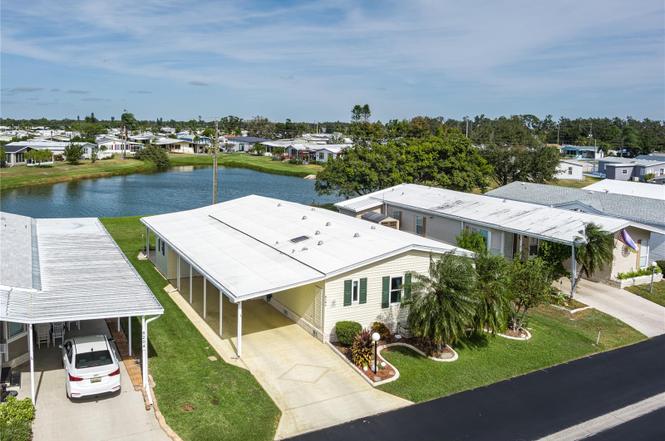
8206 Marie Ln · Bradenton, FL
Flood risk 1/10 · Minimal
- FEMA flood zone
- X (unshaded)
- Chance of flooding over 30 yrs
- 0.0%
- Est. flood insurance / yr
- $507 – $1,088
Fire risk 3/10 · Minor
- Est. fire insurance / yr
- $947 – $1,759
Heat risk 10/10 · Severe
- Hot days now (above 107°F)
- 7 days/yr
- Hot days in 30 yrs
- 29 days/yr
Wind risk 10/10 · Severe
- Chance of severe wind over 30 yrs
- 99.0%
Air-quality risk 3/10 · Minor
- Unhealthy air days now
- 3 days/yr
- Unhealthy air days in 30 yrs
- 3 days/yr
Risk factors via First Street. Map © Google.
Why this score? — see what drove the D+ grade
The composite is a weighted blend of 9 inputs, each scored 0–100. Each bar is that input's sub-score; the figure is the points it added to the 100-point composite (weight × sub-score).
- Cash flow +19.0/30.0
- DSCR +6.0/10.0
- 1% rule +5.0/10.0
- Schools +4.4/10.0
- ARV discount +4.1/15.0
- Livability +4.0/5.0
- Rent growth +2.5/5.0
- Condition / age +2.5/5.0
- Appreciation +0.0/10.0
$195,000
🖨 Deal sheet 📄 Offer letter ✓ Due diligence
Listing remarks
Sellers Motivated!! Welcome home to this beautifully upgraded pet friendly 2-bedroom, 2-bathroom residence offering 1,300 square feet of comfortable living space. This home features updates including a newer HVAC 2021 system, all newer hurricane windows and sliding door and more, providing peace of mind for years to come. A spacious 2-car covered carport provides ample protected parking. The kitchen is a chef’s delight, showcasing granite countertops, slow-close cabinetry with a convenient lazy-susan, and elegant crown molding. Enjoy your morning coffee or unwind in the evenings on the enclosed 9x21 ft. rear patio with a wall ac/unit, overlooking a serene pond—perfect for bird w
Key facts
- Slow-close cabinetry
- Newer windows
- Granite countertops
Tags
Property features AI
Finance
- Other: Lease restrictions apply
- HOA & community: Has HOA (monthly fee $171); Association requires approval; Association amenities include clubhouse, pool, laundry, maintenance, storage, pickleball and shuffleboard courts, recreation facilities, and community mailbox; Buyer approval required; Senior community; Pets allowed; Golf carts OK; Dog park
Exterior
- Parking: Carport (2 spaces)
- Security: Lobby key required (community amenity)
- Utilities: Public water; Public sewer; Electricity available and connected; Water and sewer available and connected
- Home design: Manufactured double wide home; Single-story (one level); Faces west; Crawlspace foundation
- Construction: Vinyl siding and frame construction; Metal roof
- Exterior features: Enclosed patio/porch areas; Front porch; Rear porch; Patio; Exterior lighting; Rain gutters; Outdoor storage and shed(s); Pond view
Interior
- Kitchen: Dishwasher; Disposal; Range; Refrigerator; Freezer; Ice maker; Exhaust fan; Eat-in kitchen
- Bedrooms: 2 bedrooms
- Flooring: Carpet; Ceramic tile; Laminate
- Bathrooms: 2 full bathrooms
- Heating & cooling: Central heating (electric); Central air conditioning
- Interior features: Ceiling fans; Crown molding; Eat-in kitchen; High ceilings; Open floor plan; Thermostat; Vaulted ceilings; Double pane windows; Drapes and shades
- Laundry & utility: Inside laundry room with washer and dryer; Irrigation equipment
Neighborhood map
What this means for you Summary
Snapshot
- This is a 2-bed/1.0-bath manufactured listed at $195k.
Deal economics
- At list price, monthly cash flow is $203 ($2k/yr) — positive.
- The deal already cash-flows at list — no discount required.
- Meets the 1% rule at list price ($2k rent vs $195k).
- Recommended offer: $172k (12.0% below list) — sets the bar for market timing.
- Cap rate 7.5% vs local median 3.6% in Bradenton — top-decile yield for the area; either an underpriced asset or a hidden risk that comps aren't pricing in. Stress-test before assuming the spread holds.
Location & tenants
- Location reads 81/100 on livability (#101 in FL, #1,528 nationally) — a professional / high-income tenant draw. Strengths: commute A+, cost of living A+, housing A+; Watch: employment D+, crime D, amenities F.
- Manatee (suburban): math 54% / reading 50% proficiency, ranked #26 of 73 in FL (top 36%) — acceptable for families but not a draw, mixed tenant base, ~2y average lease.
- Market conditions: 182 active listings in the ZIP; 12 comparable units currently listed for rent nearby; rentals at typical pace (median 15d on market — plan ~3-4 weeks tenant-placement turnaround); 7,472 units permitted in Manatee County in 2024 (1,782 in 5+ unit buildings).
- This rent runs 36% of the median local income ($64k/yr) — at the standard rent-burdened threshold; future hikes will face affordability resistance.
Forward outlook
- Local home prices are declining (-3.0%/yr); year-one equity from $1k of loan paydown is wiped out by about $6k of value loss. Plan a longer hold.
- Manatee County population projected at +43% by 2050 — long-run rental-demand tailwind backs the buy-and-hold thesis.
Negotiation context
- It's been on market 176 days — a 12% lower offer ($172k) is reasonable based on typical stale-listing flexibility.
Risks & watch-outs
- Climate carrying-cost: severe wind risk, 99% chance of damaging wind over 30y; extreme-heat days projected 7→29/yr by 2055 (HVAC capex compounding) — expect insurance premiums to compound above CPI over the hold.
Questions for the listing agent
- It's been on market 176 days. Have you received any prior offers? Is the seller open to a 12% concession, seller financing, or rate buy-down credit?
- What does the HOA fee cover, when was the last increase, and are there any pending special assessments or reserve-fund shortfalls?
- Why hasn't it sold? Are there any deal-killer items the seller is aware of (foundation, flood, title, zoning, code violations)?
- Is there a deadline driving the sale (1031 exchange, divorce, estate, relocation)? That informs how much negotiation room exists.
- Crime grade is D in this area — have there been break-ins, vandalism, or insurance claims at this property in the last 3 years? What carrier currently insures it and at what premium?
- The area grade is low — what's the realistic commute time and amenity access for the typical tenant pool here? Any planned neighborhood developments (good or bad) we should know about?
- What's the average days-on-market for RENTAL listings here right now (not sales)? A rising rental-DOM trend means longer vacancies and softer asking-rent achievability than the comps imply.
- What's the recent tenant-quality profile in this submarket — average credit score on applications, eviction rate, late-payment / NSF rate, and stable-employment percentage? A property-management company in the area should have these aggregated.
- How much new for-sale + rental construction is in the pipeline within 1–3 miles? Heavy new supply typically softens prices + rents 12–24 months out; constrained supply supports both.
Investment metrics
- 1% rule
- 1.00% ✓
- Cap rate
- 7.55%
- Cash-on-cash
- 4.47%
- DSCR
- 1.20
- GRM
- 8.3
CMA / ARV
- ARV (on-the-fly)
- $181,440
- Comps found
- 9
Show comp detail 9 sales within ~0.75 mi
| Address | Dist | Beds/Ba | Sqft | Sold | Price | $/sf | Match |
|---|---|---|---|---|---|---|---|
| 8206 Marie Ln | 0.00mi | 2/2.0 | 1,300 (+0%) | 0mo | $187,000 | $144 | 95 |
| 3113 Dorothy Pl | 0.37mi | 2/2.0 | 1,300 (+0%) | 8mo | $140,000 | $108 | 72 |
| 3413 Gloria Dr | 0.17mi | 2/2.0 | 1,396 (+8%) | 8mo | $163,750 | $117 | 68 |
| 3108 Terra Siesta Blvd | 0.50mi | 2/2.0 | 1,248 (-4%) | 0mo | $125,000 | $100 | 66 |
| 8205 Nancy Ln | 0.16mi | 2/2.0 | 1,204 (-7%) | 13mo | $165,000 | $137 | 66 |
| 3432 71st Ave E | 0.67mi | 2/2.0 | 1,296 (0%) | 4mo | $230,000 | $177 | 61 |
| 3449 71st Ave E | 0.69mi | 2/2.0 | 1,404 (+8%) | 1mo | $268,000 | $191 | 49 |
| 3425 71st Ave E | 0.70mi | 2/2.0 | 1,248 (-4%) | 13mo | $175,000 | $140 | 47 |
| 3445 71st Ave E | 0.69mi | 2/2.0 | 1,485 (+15%) | 4mo | $240,000 | $162 | 36 |
Match score weights: distance 35% · size 25% · config 20% · recency 20%. Top-matched comps best support the ARV.
Projected returns pro-forma
-3.0% appreciation · 3.0% rent growth · sell at horizon
- IRR
- -9.3%
- Equity multiple
- 0.66×
- Total profit
- $-18,614
- Equity at exit
- $29,075
- IRR
- 0.2%
- Equity multiple
- 1.01×
- Total profit
- $583
- Equity at exit
- $16,860
Cash invested: $54,600 (down + closing). Projections, not guarantees.
Landlord ↔ Tenant lean methodology
- Overall (STATE)
- 87 Strongly Landlord-Friendly
- State Florida
- 87 Strongly Landlord-Friendly · R+3
- County
- — inherits STATE
- City
- — inherits STATE
ZIP-level market 34222
- Home prices YoY
- -26.9%
- Active inventory
- 182
- Price-to-rent
- 8.3×
Monthly cashflow live
- Estimated rent
- $1,956 high interval (Pro) →
- Mortgage (P&I)
- −$1,023
- Tax from tax record
- −$67 /mo · $800/yr
- Insurance
- −$81
- HOA
- −$171
- Vacancy / Maint / Mgmt
- −$411
- Net cashflow
- $203
Break-even live
UW: 25.0% down · 7.5% · 30yr · 1.5% tax · 5.0% vac · 8.0% maint · 8.0% mgmt
Financing live
Cash to close
- Down payment
- $48,750
- Closing costs
- $5,850
- Reserves months
- —
- Total cash needed
- —
Loan-product check · same deal, 3 products live
Conventional
25% down · 7.5% · 30yr
- Down + closing
- —
- Monthly P&I
- —
- Monthly cashflow
- —
- DSCR
- —
- Eligible?
- —
Personal DTI + credit; lowest rate.
DSCR
20% down · 8.5% · 30yr
- Down + closing
- —
- Monthly P&I
- —
- Monthly cashflow
- —
- DSCR
- —
- Eligible?
- —
No personal income docs; deal must DSCR.
Hard money
10% down · 12.0% · 12mo
- Down + closing
- —
- Monthly P&I
- —
- Monthly cashflow
- —
- DSCR
- —
- Eligible?
- —
Short-term bridge; refi at stabilization.
Rent comps 12 comps
| Address | Beds | Baths | Sqft | Rent | $/sqft | DOM | Units | Dist |
|---|---|---|---|---|---|---|---|---|
| 8314 Nancy Ln Ellenton, FL | 2.0 | 2.0 | 1404 | $1,895 | $1.35 | 23d | 1 | 0.06mi |
| 3908 Lemonwood Dr N Ellenton, FL | 2.0 | 2.0 | 1400 | $1,750 | $1.25 | 23d | 1 | 0.22mi |
| 4212 Long Lake Way Ellenton, FL | 2.0 | 2.0 | 1000 | $1,900 | $1.90 | 23d | 1 | 0.38mi |
| 3808 Sunset Dr Ellenton, FL | 3.0 | 2.0 | 1441 | $1,699 | $1.18 | 21d | 1 | 0.39mi |
| 7711 Desoto Dr Ellenton, FL | 2.0 | 2.5 | 1356 | $1,599 | $1.18 | 14d | 1 | 0.54mi |
| 2711 80th Ave E Ellenton, FL | 3.0 | 2.0 | 1000 | $1,836 | $1.84 | 3d | 1 | 0.57mi |
| 9039 41st St E Parrish, FL | 3.0 | 2.0 | 1659 | $2,445 | $1.47 | 3d | 1 | 0.61mi |
| 482 Outer Dr Unit NA Ellenton, FL | 3.0 | 2.0 | 1400 | $1,600 | $1.14 | 3d | 1 | 0.75mi |
| 3931 Day Bridge Pl Ellenton, FL | 3.0 | 2.0 | 1250 | $2,295 | $1.84 | 3d | 1 | 0.97mi |
| 3119 61st Dr E Ellenton, FL | 3.0 | 2.0 | 1662 | $2,550 | $1.53 | 3d | 1 | 1.31mi |
| 5605 78th Ave E Palmetto, FL | 3.0 | 2.0 | 1415 | $2,800 | $1.98 | 21d | 1 | 1.31mi |
| 2710 59th Dr E Ellenton, FL | 1.0–3.0 | 1.0–2.0 | 1149 | $2,234 | $1.94 | 3d | 37 | 1.48mi |
HOA detail
- Monthly dues
- $171 · $2,052/yr
Listing history 4 events
-
2026-05-10status Pending
-
2026-04-21price $195,000
-
2026-01-12price $215,000
-
2025-11-14$229,000 Active
ⓘ Source: listings_history table (triggers on properties + properties_extension) + one-shot
backfill from property_details.listing_events for pre-trigger history.
Tax reassessment forecast FL · Resets to sale price
- Current annual tax
- $800 · $67/mo
- Projected year-2 tax
- $1,618 · $135/mo
- Expected delta
- +$818/yr (+$68/mo · 102.2%)
ⓘ Screening estimate from a state-policy table — verify with the county assessor before closing.
Climate risk First Street
- Flood 1/10 Low FEMA zone X (unshaded) · 0% chance over 30 yrs
- Wildfire 3/10 Moderate
- Heat 10/10 Extreme 7 d/yr ≥107°F today · 29 d/yr by 30 yrs out
- Wind 10/10 Extreme 99% chance of damaging wind over 30 yrs
- Air quality 3/10 Moderate 3 unhealthy d/yr today · 3 by 30 yrs out
Nearby sold comps map
Loading sold comps map…
Walkable amenities ~0.75 mi
Loading nearby amenities…
Taxation est. · year 1
- Rental income
- $23,469
- − Mortgage interest
- −$10,923
- − Property taxes
- −$800
- − Insurance
- −$975
- − Repairs & maintenance
- −$1,878
- − Management
- −$1,878
- − HOA
- −$2,052
- − Depreciation
- −$5,673
- Taxable loss
- −$710
- Est. tax savings @ 24.0%
- +$170
- After-tax cash flow
- $2,612/yr
For passive investors: Depreciation is non-cash, so a rental often shows a tax loss while cash-flowing — sheltering income. Rental losses are passive: they offset passive income freely, and up to $25,000/yr can offset ordinary (W-2) income if you actively participate and your MAGI is under $100k (phasing out to $0 by $150k); unused losses carry forward. On sale, claimed depreciation is recaptured at up to 25%, and gains may owe capital-gains tax (a 1031 exchange can defer both). Figures are a year-1 estimate at your 24.0% rate — not tax advice; consult a CPA.
Schools (NCES district)
- District
- Manatee
- NCES district ID
- 1201230
- Math proficiency
- 54% ▼ -6.00%
- Reading proficiency
- 50% ▼ -2.00%
- Median HH income
- $49,607
- Composite
- 44.43/100
- National rank
- #2806
- State rank
- #26 of 73 in FL
Livability — Bradenton
- Score
- 81/100
- State rank
- #101
- US rank
- #1528
Category grades
Schools grade is shown separately in the Schools card above.
Census & demographics
- County
- Manatee County · 416,364 people
- City population
- 227,091
- Metro
- North Port-Sarasota-Bradenton, FL
- Population (ZIP)
- 14,819
- Household income
- $64,355
- Rent vs Own
- Severe rent burden
- 313.0
Population outlook (Manatee County) Hauer SSP2
- Today (2025)
- 447,342 people
- By 2030
- 488,911 · +9.3%
- By 2040
- 567,934 · +27.0%
- By 2050
- 637,995 · +42.6%
- By 2075
- 781,970 · +74.8%
- By 2100
- 848,272 · +89.6%
Race, ethnicity, and origin ACS 2023
- Neighborhood character
- Predominantly White (70%)
- Race & ethnicity
- White 70% Hispanic / Latino 17% Two or more races 13% Black 7% Native American 2% Asian 1%
- Hispanic origin (detail)
- Mexican 8% Puerto Rican 2%
- Common ancestry
- Romanian 3% Slovak 2% Lithuanian 2%
- Foreign-born
- 8% · Canada, Jamaica, Vietnam
- Languages at home
- 88% English-only · Spanish 10% Other Indo-European 1% Vietnamese 1%
Political lean MEDSL · Manatee
- 2024 margin
- Strong R (+23.5) · D 37.9% · R 61.4%
- 2008→2024 swing
- -16.5pp toward R · 2008: -7.0pp · 2024: -23.5pp
- All cycles
- 2024: R+23.5 2020: R+16.1 2016: R+17.1 2012: R+12.5 2008: R+7.0
Not yet ingested
- Civics
- —
Market trends
- HPI YoY
- ▼ -107.75%
- Current HPI
- 293.2597
- Rent YoY
- —
- Metro
- North Port-Sarasota-Bradenton, FL
- State GDP YoY
- ▲ 3.28%
- F500 in state
- 36
Industry mix (Fortune 500 HQ in FL)
| Industry | F500 HQs | Revenue |
|---|---|---|
| Industrial Technology | 2 | $29B |
|
||
| Insurance | 2 | $17B |
|
||
| Retail | 1 | $60B |
|
||
| Technology Distribution | 1 | $58B |
|
||
| Homebuilding | 1 | $35B |
|
||
| Technology Manufacturing | 1 | $35B |
|
||
Price history
-14.8% since first listed4 events — show timeline
- 2026-05-10 Pending — Stellar MLS as Distributed by MLS Grid
- 2026-04-21 Price Changed $195,000 Stellar MLS as Distributed by MLS Grid
- 2026-01-12 Price Changed $215,000 Stellar MLS as Distributed by MLS Grid
- 2025-11-14 Listed $229,000 Stellar MLS as Distributed by MLS Grid
Property tax history
+2.3%/yrLatest (2025): $800 · +7.3% YoY. Source: county tax records.
Cash-flow waterfall
monthlySold comps — $/sqft
last 12 mo · ≤1 miLoading sold comps…