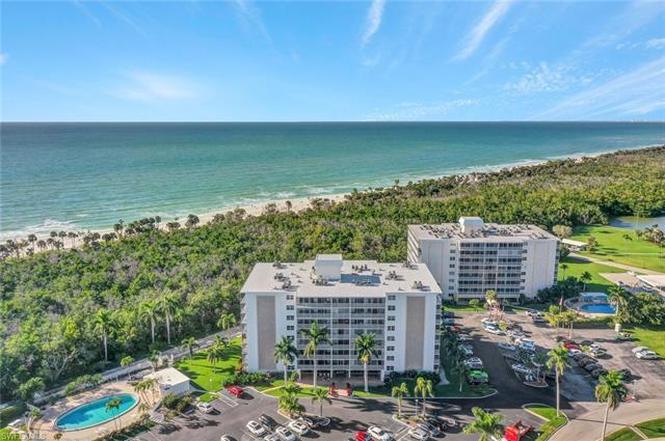
3 Bluebill Ave #509 · Naples Park, FL
Flood risk 9/10 · Severe
- FEMA flood zone
- AE
- Chance of flooding over 30 yrs
- 0.99%
- Est. flood insurance / yr
- $1,737 – $8,500
Fire risk 1/10 · Minimal
- Est. fire insurance / yr
- $947 – $1,759
Heat risk 10/10 · Severe
- Hot days now (above 107°F)
- 7 days/yr
- Hot days in 30 yrs
- 30 days/yr
Wind risk 10/10 · Severe
- Chance of severe wind over 30 yrs
- 99.0%
Air-quality risk 2/10 · Minimal
- Unhealthy air days now
- 1 days/yr
- Unhealthy air days in 30 yrs
- 1 days/yr
Risk factors via First Street. Map © Google.
Why this score? — see what drove the D+ grade
The composite is a weighted blend of 9 inputs, each scored 0–100. Each bar is that input's sub-score; the figure is the points it added to the 100-point composite (weight × sub-score).
- Cash flow +16.0/30.0
- ARV discount +7.5/15.0
- 1% rule +6.1/10.0
- Schools +5.0/10.0
- DSCR +4.9/10.0
- Rent growth +4.7/5.0
- Livability +3.2/5.0
- Condition / age +2.5/5.0
- Appreciation +0.0/10.0
$449,000
🖨 Deal sheet (PDF) 📄 Offer letter ✓ Due diligence
Listing remarks
INCOME PRODUCING • TRANSFERABLE LEASE • PRIME LOCATION Investor-ready condo with immediate cash flow—currently leased with a transferable tenant in place. Located in a gated waterfront community just steps from Vanderbilt Beach. Ideal for investors seeking stable income with upside through seasonal rentals or future appreciation. ? Income-producing from day one ? Transferable lease in place ? STR potential (up to 12x/year, 30-day min) ? Resort-style amenities + marina access Now offered at $449,000—one of the best value plays in the area.
Key facts
- Gated community
- Easy beach access
- Rental income
Tags
Neighborhood map
What this means for you Summary
Snapshot
- This is a 2-bed/2.0-bath condo listed at $449k.
Deal economics
- At list price, monthly cash flow is $-207 ($-2k/yr) — negative.
- To cash-flow at today's rent, offer at most $412k (8.1% below list).
- Meets the 1% rule at list price ($5k rent vs $449k).
- Recommended offer: $412k (8.1% below list) — sets the bar for cash-flow.
Location & tenants
- Location reads 64/100 on livability (#696 in FL) — a middle-class / working-renter tenant base. Strengths: crime A+, housing A-, employment B+; Watch: health & safety D, amenities F, commute F.
- Collier (suburban): math 60% / reading 56% proficiency, ranked #16 of 73 in FL (top 22%) — acceptable for families but not a draw, mixed tenant base, ~2y average lease.
- Zoned schools: Naples Park Elementary School (math 67% / reading 57%, grade B, #608 of 2,144 statewide, top 29%, 395 students, 48% FRL); North Naples Middle School (math 79% / reading 73%, grade A, #34 of 571 statewide, top 6%, 903 students, 25% FRL); Gulf Coast High School (math 57% / reading 68%, grade B-, #93 of 667 statewide, top 14%, 2,447 students, 20% FRL) — zoned schools average 31% FRL vs 55% district-wide (24 pts lower); this property's tenant base skews higher-income than the district average.
- Market conditions: Rents rising fast (+8.7%/yr); 684 active listings in the ZIP; 40 comparable units currently listed for rent nearby; rentals at typical pace (median 25d on market — plan ~3-4 weeks tenant-placement turnaround); high-income renter base; 3,520 units permitted in Collier County in 2024 (959 in 5+ unit buildings).
- At $4,984/mo this rent would consume 50% of the median local household income ($119k/yr) (locally 237% of renters already pay >50% of income on rent) — very limited rent-growth headroom before tenants either downsize or default.
Forward outlook
- Local home prices are declining (-3.0%/yr); year-one equity from $3k of loan paydown is wiped out by about $13k of value loss. Plan a longer hold.
- Collier County population projected at +30% by 2050 — long-run rental-demand tailwind backs the buy-and-hold thesis.
Negotiation context
- It's been on market 77 days — a 6% lower offer ($422k) is reasonable based on typical stale-listing flexibility.
- 9 sale attempts since 7y ago; this cycle's ask has dropped $96k (18%) from the opening price — seller is motivated, your offer sets the floor, not the list.
Risks & watch-outs
- Watch-outs: flood insurance adds $427/mo.
- Climate carrying-cost: in FEMA flood zone AE (mandatory federal flood insurance); severe wind risk, 99% chance of damaging wind over 30y; extreme-heat days projected 7→30/yr by 2055 (HVAC capex compounding) — expect insurance premiums to compound above CPI over the hold.
Questions for the listing agent
- What do current leases actually rent for vs. the listed asking? Can we see a recent rent roll and the last 12 months of T-12 income?
- It's been on market 77 days. Have you received any prior offers? Is the seller open to a 8% concession, seller financing, or rate buy-down credit?
- Built in 1972 — when were the roof, HVAC, electrical panel, plumbing, and water heater last replaced?
- What's the actual annual flood-insurance premium (NFIP or private), and is the property in a SFHA with mandatory coverage?
- What does the HOA fee cover, when was the last increase, and are there any pending special assessments or reserve-fund shortfalls?
- Any open or pending special assessments — roof, HVAC, plumbing, elevator, façade? What's the per-unit balance and payoff schedule, and is the seller paying it off at close or rolling it to the buyer?
- Why hasn't it sold? Are there any deal-killer items the seller is aware of (foundation, flood, title, zoning, code violations)?
- Is there a deadline driving the sale (1031 exchange, divorce, estate, relocation)? That informs how much negotiation room exists.
- Schools are F-rated, which usually means shorter tenancies and higher turnover. Who's the typical renter profile here, and what's been the actual vacancy rate?
- The area grade is low — what's the realistic commute time and amenity access for the typical tenant pool here? Any planned neighborhood developments (good or bad) we should know about?
- What's the average days-on-market for RENTAL listings here right now (not sales)? A rising rental-DOM trend means longer vacancies and softer asking-rent achievability than the comps imply.
- What's the recent tenant-quality profile in this submarket — average credit score on applications, eviction rate, late-payment / NSF rate, and stable-employment percentage? A property-management company in the area should have these aggregated.
- How much new apartment / multifamily construction is in the pipeline within 1–3 miles? Heavy new supply (>2% of stock underway) typically softens rents 12–24 months out; light construction supports rent growth.
Investment metrics
- 1% rule
- 1.11% ✓
- Cap rate
- 6.88%
- Cash-on-cash
- 2.09%
- DSCR
- 1.09
- GRM
- 7.5
CMA / ARV
No comps found within radius.
Projected returns pro-forma
-3.0% appreciation · 8.0% rent growth · sell at horizon
- IRR
- -12.2%
- Equity multiple
- 0.53×
- Total profit
- $-58,895
- Equity at exit
- $66,947
- IRR
- 4.6%
- Equity multiple
- 1.43×
- Total profit
- $54,513
- Equity at exit
- $38,821
Cash invested: $125,720 (down + closing). Projections, not guarantees.
Landlord ↔ Tenant lean methodology
- Overall (STATE)
- 87 Strongly Landlord-Friendly
- State Florida
- 87 Strongly Landlord-Friendly · R+3
- County
- — inherits STATE
- City
- — inherits STATE
ZIP-level market 34108
- Rents YoY
- 8.7%
- Active inventory
- 684
- Price-to-rent
- 7.5×
Monthly cashflow live
- Estimated rent
- $4,984 medium interval (Pro) →
- Mortgage (P&I)
- −$2,355
- Tax from tax record
- −$246 /mo · $2,954/yr
- Insurance
- −$187
- Flood insurance flood zone
- −$427 /mo · $5,118/yr
- HOA
- −$930
- Vacancy / Maint / Mgmt
- −$1,047
- Net cashflow
- $-207
Break-even live
Sensitivity live
| Price | -10% $47 | -5% $-80 | +0% $-207 | +5% $-334 | +10% $-461 |
|---|---|---|---|---|---|
| Rent | -10% $-601 | -5% $-404 | +0% $-207 | +5% $-10 | +10% $187 |
| Rate | -1.0pp $19 | -0.5pp $-93 | base $-207 | +0.5pp $-323 | +1.0pp $-442 |
UW: 25.0% down · 7.5% · 30yr · 1.5% tax · 5.0% vac · 8.0% maint · 8.0% mgmt
Financing live
Cash to close
- Down payment
- $112,250
- Closing costs
- $13,470
- Reserves months
- —
- Total cash needed
- —
Loan-product check · same deal, 3 products live
Conventional
25% down · 7.5% · 30yr
- Down + closing
- —
- Monthly P&I
- —
- Monthly cashflow
- —
- DSCR
- —
- Eligible?
- —
Personal DTI + credit; lowest rate.
DSCR
20% down · 8.5% · 30yr
- Down + closing
- —
- Monthly P&I
- —
- Monthly cashflow
- —
- DSCR
- —
- Eligible?
- —
No personal income docs; deal must DSCR.
Hard money
10% down · 12.0% · 12mo
- Down + closing
- —
- Monthly P&I
- —
- Monthly cashflow
- —
- DSCR
- —
- Eligible?
- —
Short-term bridge; refi at stabilization.
Rent comps 40 comps
| Address | Beds | Baths | Sqft | Rent | $/sqft | DOM | Units | Dist |
|---|---|---|---|---|---|---|---|---|
| 3 Bluebill Ave #610 Naples, FL | 1.0 | 1.0 | 810 | $5,000 | $6.17 | 25d | 1 | 0.01mi |
| 3 Bluebill Ave #801 Naples, FL | 3.0 | 2.0 | 1472 | $12,500 | $8.49 | 25d | 1 | 0.01mi |
| 3 Bluebill Ave #303 Naples, FL | 2.0 | 2.0 | 1071 | $8,000 | $7.47 | 23d | 1 | 0.01mi |
| 5 Bluebill Ave Unit 305-405 Naples, FL | 2.0 | 2.5 | 1133 | $3,495 | $3.08 | 25d | 1 | 0.04mi |
| 5 Bluebill Ave #403 Naples, FL | 2.0 | 2.0 | 1086 | $8,500 | $7.83 | 23d | 1 | 0.04mi |
| 5 Bluebill Ave Unit 108s Naples, FL | 1.0 | 1.0 | 859 | $4,995 | $5.81 | 25d | 1 | 0.04mi |
| 5 Bluebill Ave Unit 108A Naples, FL | 1.0 | 1.0 | 859 | $1,995 | $2.32 | 25d | 1 | 0.04mi |
| 5 Bluebill Ave #201 Naples, FL | 3.0 | 2.0 | 1441 | $9,000 | $6.25 | 25d | 1 | 0.04mi |
| 5 Bluebill Ave #301 Naples, FL | 3.0 | 2.0 | 1494 | $7,500 | $5.02 | 25d | 1 | 0.04mi |
| 5 Bluebill Ave #209 Naples, FL | 2.0 | 2.0 | 1076 | $8,500 | $7.90 | 25d | 1 | 0.04mi |
| 5 Bluebill Ave #104 Naples, FL | 1.0 | 1.0 | 817 | $5,000 | $6.12 | 25d | 1 | 0.04mi |
| 5 Bluebill Ave #103 Naples, FL | 1.0 | 1.0 | 809 | $2,750 | $3.40 | 25d | 1 | 0.04mi |
| 5 Bluebill Ave #504 Naples, FL | 1.0 | 1.0 | 896 | $7,000 | $7.81 | 25d | 1 | 0.04mi |
| 5 Bluebill Ave Unit 303-1 Naples, FL | 2.0 | 2.0 | 1068 | $6,500 | $6.09 | 25d | 1 | 0.04mi |
| 5 Bluebill Ave #210 Naples, FL | 1.0 | 1.0 | 812 | $6,000 | $7.39 | 25d | 1 | 0.04mi |
| 5 Bluebill Ave Unit 505/605 Naples, FL | 2.0 | 2.5 | 1035 | $6,500 | $6.28 | 25d | 1 | 0.04mi |
| 1 Bluebill Ave #803 Naples, FL | 1.0 | 2.0 | 1147 | $6,700 | $5.84 | 25d | 1 | 0.08mi |
| 1 Bluebill Ave #501 Naples, FL | 1.0 | 1.0 | 768 | $2,095 | $2.73 | 25d | 1 | 0.08mi |
| 1 Bluebill Ave #412 Naples, FL | 2.0 | 2.0 | 1050 | $8,000 | $7.62 | 25d | 1 | 0.08mi |
| 1 Bluebill Ave #210 Naples, FL | 2.0 | 2.0 | 1040 | $5,900 | $5.67 | 25d | 1 | 0.08mi |
| 1 Bluebill Ave #703 Naples, FL | 1.0 | 1.0 | 800 | $7,000 | $8.75 | 25d | 1 | 0.08mi |
| 1 Bluebill Ave #709 Naples, FL | 1.0 | 1.0 | 800 | $6,000 | $7.50 | 25d | 1 | 0.08mi |
| 1 Bluebill Ave #707 Naples, FL | 1.0 | 1.0 | 1040 | $6,500 | $6.25 | 25d | 1 | 0.08mi |
| 1 Bluebill Ave Naples, FL | 2.0 | 2.0 | 1051 | $7,500 | $7.14 | 25d | 1 | 0.08mi |
| 25 Bluebill Ave Unit 1263821P Naples, FL | 2.0 | 2.0 | 1485 | $5,079 | $3.42 | 23d | 1 | 0.11mi |
| 11118 Gulf Shore Dr #203 Naples, FL | 2.0 | 2.0 | 1470 | $9,400 | $6.39 | 15d | 1 | 0.15mi |
| 11118 Gulf Shore Dr Unit A203 Naples, FL | 2.0 | 2.0 | 1470 | $4,500 | $3.06 | 15d | 1 | 0.15mi |
| 11118 Gulf Shore Dr Unit A204 Naples, FL | 2.0 | 2.0 | 1359 | $4,000 | $2.94 | 15d | 1 | 0.15mi |
| 11118 Gulf Shore Dr Unit A401 Naples, FL | 2.0 | 2.0 | 1476 | $15,000 | $10.16 | 15d | 1 | 0.15mi |
| 11116 Gulf Shore Dr Unit B-904 Coco River, FL | 2.0 | 2.0 | 1476 | $15,000 | $10.16 | 15d | 1 | 0.17mi |
| 15 Bluebill Ave #206 Naples, FL | 2.0 | 2.0 | 1493 | $6,500 | $4.35 | 25d | 1 | 0.18mi |
| 17 Bluebill Ave #1102 Naples, FL | 2.0 | 2.0 | 1300 | $9,000 | $6.92 | 25d | 1 | 0.22mi |
| 17 Bluebill Ave #903 Naples, FL | 2.0 | 2.0 | 1214 | $17,250 | $14.21 | 25d | 1 | 0.22mi |
| 17 Bluebill Ave #904 Naples, FL | 2.0 | 2.0 | 1214 | $8,000 | $6.59 | 25d | 1 | 0.22mi |
| 10686 Gulf Shore Dr #304 Naples, FL | 2.0 | 2.0 | 1177 | $7,000 | $5.95 | 15d | 1 | 0.32mi |
| 10686 Gulf Shore Dr Unit A-104 Naples, FL | 2.0 | 2.0 | 1107 | $8,000 | $7.23 | 15d | 1 | 0.32mi |
| 10682 Gulf Shore Dr Unit C205 Naples, FL | 2.0 | 2.0 | 1248 | $11,000 | $8.81 | 15d | 1 | 0.39mi |
| 10682 Gulf Shore Dr Unit C-204 Naples, FL | 2.0 | 2.0 | 1177 | $12,000 | $10.20 | 15d | 1 | 0.39mi |
| 10682 Gulf Shore Dr Unit 304 C Naples, FL | 2.0 | 2.0 | 1490 | $5,600 | $3.76 | 25d | 1 | 0.39mi |
| 10682 Gulf Shore Dr Unit 304 C Naples, FL | 2.0 | 2.0 | 1490 | $5,600 | $3.76 | 15d | 1 | 0.39mi |
HOA detail condo
- Monthly dues
- $930 · $11,160/yr
- Likely covers
- watersecurity
- Assessments
- None detected in remarks — confirm with the listing agent.
Listing history 26 events
-
2026-04-23status Pending
-
2026-04-21price $449,000
-
2026-03-20price $489,000
-
2026-02-19price $499,000
-
2026-02-05$545,000 Active
-
2025-06-03historical
-
2025-03-31price $589,000
-
2025-03-08historical $2,500
-
2024-12-26$619,000 Active
-
2024-12-24$2,500
-
2024-12-24historical $5,000
-
2024-12-19$5,000
-
2024-12-04historical
-
2024-11-08$619,000 Active
-
2024-05-11historical
-
2024-03-28price $649,000
-
2024-01-31price $679,000
-
2023-11-16$699,000 Active
-
2022-06-13soldstatus $600,000
-
2022-06-06soldstatus $600,000 Sold
-
2022-05-07status Pending
-
2022-05-04$599,000 Active
-
2021-12-06historical
-
2021-07-01$599,000 Active
-
2021-03-01historical
-
2019-12-03$424,900 Active
ⓘ Source: listings_history table (triggers on properties + properties_extension) + one-shot
backfill from property_details.listing_events for pre-trigger history.
Tax reassessment forecast FL · Resets to sale price
- Current annual tax
- $2,954 · $246/mo
- Projected year-2 tax
- $3,727 · $311/mo
- Expected delta
- +$772/yr (+$64/mo · 26.1%)
ⓘ Screening estimate from a state-policy table — verify with the county assessor before closing.
Climate risk First Street
- Flood 9/10 Extreme FEMA zone AE · 99% chance over 30 yrs
- Wildfire 1/10 Low
- Heat 10/10 Extreme 7 d/yr ≥107°F today · 30 d/yr by 30 yrs out
- Wind 10/10 Extreme 99% chance of damaging wind over 30 yrs
- Air quality 2/10 Low 1 unhealthy d/yr today · 1 by 30 yrs out
Nearby sold comps map
Loading sold comps map…
Walkable amenities ~0.75 mi
Loading nearby amenities…
Taxation est. · year 1
- Rental income
- $59,807
- − Mortgage interest
- −$25,151
- − Property taxes
- −$2,954
- − Insurance
- −$7,364
- − Repairs & maintenance
- −$4,785
- − Management
- −$4,785
- − HOA
- −$11,160
- − Depreciation
- −$13,062
- Taxable loss
- −$9,453
- Est. tax savings @ 24.0%
- +$2,269
- After-tax cash flow
- $-217/yr
For passive investors: Depreciation is non-cash, so a rental often shows a tax loss while cash-flowing — sheltering income. Rental losses are passive: they offset passive income freely, and up to $25,000/yr can offset ordinary (W-2) income if you actively participate and your MAGI is under $100k (phasing out to $0 by $150k); unused losses carry forward. On sale, claimed depreciation is recaptured at up to 25%, and gains may owe capital-gains tax (a 1031 exchange can defer both). Figures are a year-1 estimate at your 24.0% rate — not tax advice; consult a CPA.
Schools (NCES district)
- District
- Collier
- NCES district ID
- 1200330
- Math proficiency
- 60% ▼ -4.00%
- Reading proficiency
- 56% ▼ -2.00%
- Median HH income
- $58,275
- Composite
- 50.23/100
- National rank
- #1892
- State rank
- #16 of 73 in FL
Livability — Naples Park
- Score
- 64/100
- State rank
- #696
- US rank
- #14564
Category grades
Schools grade is shown separately in the Schools card above.
Census & demographics
- County
- Collier County · 396,295 people
- Metro
- Naples-Marco Island, FL
- Population (ZIP)
- 16,237
- Household income
- $119,212
- Rent vs Own
- Severe rent burden
- 237.0
Population outlook (Collier County) Hauer SSP2
- Today (2025)
- 420,858 people
- By 2030
- 450,054 · +6.9%
- By 2040
- 502,232 · +19.3%
- By 2050
- 544,932 · +29.5%
- By 2075
- 627,203 · +49.0%
- By 2100
- 659,015 · +56.6%
Race, ethnicity, and origin ACS 2023
- Neighborhood character
- Predominantly White (87%)
- Race & ethnicity
- White 87% Hispanic / Latino 8% Two or more races 7% Asian 1% Black 1%
- Hispanic origin (detail)
- Mexican 2% Cuban 3%
- Common ancestry
- Romanian 5% Lithuanian 3% Slovak 3%
- Foreign-born
- 16% · Canada, Dominican Republic, South Korea
- Languages at home
- 86% English-only · Spanish 6% Russian/Polish/Slavic 2% Other Indo-European 2%
Political lean MEDSL · Collier
- 2024 margin
- Solid R (+33.1) · D 33.1% · R 66.2%
- 2008→2024 swing
- -10.6pp toward R · 2008: -22.5pp · 2024: -33.1pp
- All cycles
- 2024: R+33.1 2020: R+24.7 2016: R+26.0 2012: R+30.1 2008: R+22.5
Not yet ingested
- Civics
- —
Market trends
- HPI YoY
- ▼ -587.97%
- Current HPI
- 275.1872
- Rent YoY
- ▲ 8.74%
- Metro
- Naples-Marco Island, FL
- State GDP YoY
- ▲ 3.28%
- F500 in state
- 36
Industry mix (Fortune 500 HQ in FL)
| Industry | F500 HQs | Revenue |
|---|---|---|
| Industrial Technology | 2 | $29B |
|
||
| Insurance | 2 | $17B |
|
||
| Retail | 1 | $60B |
|
||
| Technology Distribution | 1 | $58B |
|
||
| Homebuilding | 1 | $35B |
|
||
| Technology Manufacturing | 1 | $35B |
|
||
Price history
+5.7% since first listed26 events — show timeline
- 2026-04-23 Pending — NAPLESMLS
- 2026-04-21 Price Changed $449,000 NAPLESMLS
- 2026-03-20 Price Changed $489,000 NAPLESMLS
- 2026-02-19 Price Changed $499,000 NAPLESMLS
- 2026-02-05 Listed $545,000 NAPLESMLS
- 2025-06-03 Listing Removed — NAPLESMLS
- 2025-03-31 Price Changed $589,000 NAPLESMLS
- 2025-03-08 Rental Removed $2,500 NAPLESMLS
- 2024-12-26 Listed $619,000 NAPLESMLS
- 2024-12-24 Listed for Rent $2,500 NAPLESMLS
- 2024-12-24 Rental Removed $5,000 NAPLESMLS
- 2024-12-19 Listed for Rent $5,000 NAPLESMLS
- 2024-12-04 Listing Removed — NAPLESMLS
- 2024-11-08 Listed $619,000 NAPLESMLS
- 2024-05-11 Listing Removed — NAPLESMLS
- 2024-03-28 Price Changed $649,000 NAPLESMLS
- 2024-01-31 Price Changed $679,000 NAPLESMLS
- 2023-11-16 Listed $699,000 NAPLESMLS
- 2022-06-13 Sold (Public Records) $600,000 Public Records
- 2022-06-06 Sold (MLS) $600,000 NAPLESMLS
- 2022-05-07 Pending — NAPLESMLS
- 2022-05-04 Listed $599,000 NAPLESMLS
- 2021-12-06 Listing Removed — NAPLESMLS
- 2021-07-01 Listed $599,000 NAPLESMLS
- 2021-03-01 Listing Removed — NAPLESMLS
- 2019-12-03 Listed $424,900 NAPLESMLS
Property tax history
+1.4%/yrLatest (2025): $2,954 · -0.6% YoY. Source: county tax records.
Cash-flow waterfall
monthlySold comps — $/sqft
last 12 mo · ≤1 miLoading sold comps…