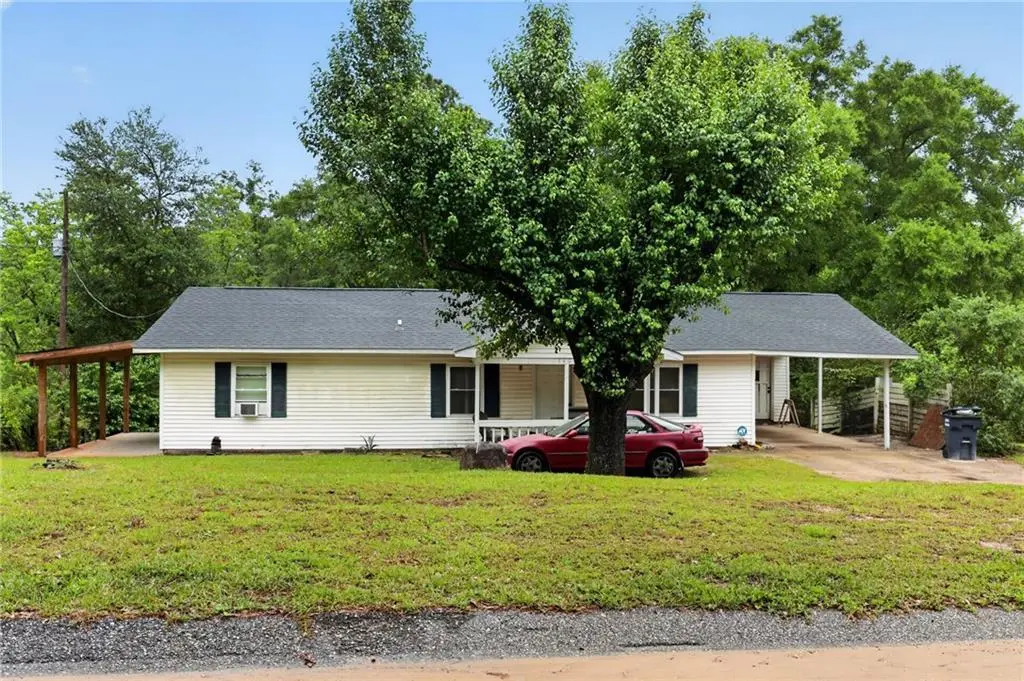
4401 Wilmer Dr · Tillmans Corner, AL
Flood risk 1/10 · Minimal
- FEMA flood zone
- X (unshaded)
- Chance of flooding over 30 yrs
- 0.0%
- Est. flood insurance / yr
- $507 – $1,088
Fire risk 5/10 · Moderate
- Est. fire insurance / yr
- $916 – $1,700
Heat risk 9/10 · Severe
- Hot days now (above 105°F)
- 7 days/yr
- Hot days in 30 yrs
- 20 days/yr
Wind risk 9/10 · Severe
- Chance of severe wind over 30 yrs
- 99.0%
Air-quality risk 1/10 · Minimal
- Unhealthy air days now
- 0 days/yr
- Unhealthy air days in 30 yrs
- 0 days/yr
Risk factors via First Street. Map © Google.
Why this score? — see what drove the C grade
The composite is a weighted blend of 9 inputs, each scored 0–100. Each bar is that input's sub-score; the figure is the points it added to the 100-point composite (weight × sub-score).
- Cash flow +21.2/30.0
- ARV discount +15.0/15.0
- DSCR +6.8/10.0
- 1% rule +4.3/10.0
- Livability +3.1/5.0
- Rent growth +2.5/5.0
- Condition / age +2.5/5.0
- Schools +2.3/10.0
- Appreciation +0.0/10.0
$139,900
🖨 Deal sheet 📄 Offer letter ✓ Due diligence
Listing remarks MLS
This 3 bed 1 1/2 bath House will make a Great income producing rental Property, or would make a great home for someone wanting a house for under 100k. The inside will need to be painted and may need a few updates. Call your favorite Realtor and make your appt today! Listing Agent makes no representation to accuracy of sq. ft. Buyer to verify all information.
Key facts
- 0.39 acre lot
- Parking
- Built 1982
Neighborhood map
What this means for you Summary
Snapshot
- This is a 3-bed/1.5-bath single-family listed at $140k.
Deal economics
- At list price, monthly cash flow is $202 ($2k/yr) — positive.
- The deal already cash-flows at list — no discount required.
- To meet the 1% rule (rent ≥ 1% of price), the offer needs to be $130k (7.1% below list).
- Recommended offer: $130k (7.1% below list) — sets the bar for 1% rule.
- Cap rate 8.0% vs local median 5.0% in Tillmans Corner — top-decile yield for the area; either an underpriced asset or a hidden risk that comps aren't pricing in. Stress-test before assuming the spread holds.
Location & tenants
- Location reads 61/100 on livability (#260 in AL) — a middle-class / working-renter tenant base. Strengths: cost of living A+, housing A+; Watch: crime D+, schools F, amenities F.
- Mobile County (urban): math 15% / reading 39% proficiency, ranked #81 of 129 in AL (top 63%) — low school quality limits family demand, transient renter base, plan for 1-2y turnover; 67% free/reduced lunch — lower-income household profile, screen leases tightly.
- Market conditions: 142 active listings in the ZIP; 1 comparable units currently listed for rent nearby; 1,678 units permitted in Mobile County in 2024 (264 in 5+ unit buildings).
Forward outlook
- Local home prices are declining (-3.0%/yr); year-one equity from $967 of loan paydown is wiped out by about $4k of value loss. Plan a longer hold.
- Mobile County population projected to shrink 8% by 2050 — rents likely to lag national; underwrite the cash flow, not the appreciation.
Negotiation context
- It's been on market 34 days — a 3% lower offer ($136k) is reasonable based on typical stale-listing flexibility.
- Current owner paid $83k; list at $140k implies a 69% gain — meaningful room to come down on a strong offer.
Risks & watch-outs
- Climate carrying-cost: severe wind risk, 99% chance of damaging wind over 30y; moderate wildfire risk; extreme-heat days projected 7→20/yr by 2055 (HVAC capex compounding) — expect insurance premiums to compound above CPI over the hold.
Questions for the listing agent
- It's been on market 34 days. Have you received any prior offers? Is the seller open to a 7% concession, seller financing, or rate buy-down credit?
- Is there a deadline driving the sale (1031 exchange, divorce, estate, relocation)? That informs how much negotiation room exists.
- Schools are F-rated, which usually means shorter tenancies and higher turnover. Who's the typical renter profile here, and what's been the actual vacancy rate?
- Crime grade is D in this area — have there been break-ins, vandalism, or insurance claims at this property in the last 3 years? What carrier currently insures it and at what premium?
- What's the average days-on-market for RENTAL listings here right now (not sales)? A rising rental-DOM trend means longer vacancies and softer asking-rent achievability than the comps imply.
- What's the recent tenant-quality profile in this submarket — average credit score on applications, eviction rate, late-payment / NSF rate, and stable-employment percentage? A property-management company in the area should have these aggregated.
- How much new for-sale + rental construction is in the pipeline within 1–3 miles? Heavy new supply typically softens prices + rents 12–24 months out; constrained supply supports both.
Investment metrics
- 1% rule
- 0.93% ✗
- Cap rate
- 8.03%
- Cash-on-cash
- 6.19%
- DSCR
- 1.28
- GRM
- 9.0
CMA / ARV
- ARV (median comp)
- $171,614
- List price
- $139,900
- Delta
- -18.48%
- Verdict
- UNDERPRICED
- Comps
- 20 within 1.0 mi
Show comp detail 12 sales within ~0.75 mi
| Address | Dist | Beds/Ba | Sqft | Sold | Price | $/sf | Match |
|---|---|---|---|---|---|---|---|
| 4570 Schimpfs Ln | 0.38mi | 3/2.0 | 1,456 (+1%) | 6mo | $220,000 | $151 | 74 |
| 4651 Emerald Dr W | 0.41mi | 3/1.5 | 1,375 (-4%) | 5mo | $178,500 | $130 | 69 |
| 4639 Emerald Dr E | 0.35mi | 3/2.0 | 1,350 (-6%) | 7mo | $205,000 | $152 | 65 |
| 4483 Bedford Ave | 0.21mi | 3/2.0 | 1,586 (+10%) | 10mo | $57,000 | $36 | 63 |
| 4571 Golden Ave | 0.40mi | 3/2.0 | 1,352 (-6%) | 8mo | $180,000 | $133 | 62 |
| 4580 Schimpfs Ln | 0.39mi | 4/2.0 (+1) | 1,514 (+5%) | 6mo | $239,000 | $158 | 61 |
| 4813 Emerald Dr W | 0.61mi | 3/2.0 | 1,376 (-4%) | 8mo | $187,500 | $136 | 56 |
| 4301 Derby Ave | 0.34mi | 4/2.0 (+1) | 1,566 (+9%) | 9mo | $215,000 | $137 | 56 |
| 4713 Emerald Dr | 0.48mi | 3/2.0 | 1,300 (-10%) | 8mo | $187,500 | $144 | 53 |
| 7202 N Mill House Rd | 0.67mi | 3/2.0 | 1,260 (-12%) | 2mo | $190,000 | $151 | 44 |
| 4860 Lucinda Dr | 0.66mi | 3/1.0 | 1,248 (-13%) | 2mo | $159,900 | $128 | 43 |
| 4931 Camelot Dr W | 0.75mi | 3/2.0 | 1,620 (+12%) | 9mo | $201,000 | $124 | 35 |
Match score weights: distance 35% · size 25% · config 20% · recency 20%. Top-matched comps best support the ARV.
Projected returns pro-forma
-3.0% appreciation · 3.0% rent growth · sell at horizon
- IRR
- -6.8%
- Equity multiple
- 0.75×
- Total profit
- $-9,867
- Equity at exit
- $20,860
- IRR
- 2.7%
- Equity multiple
- 1.20×
- Total profit
- $7,707
- Equity at exit
- $12,096
Cash invested: $39,172 (down + closing). Projections, not guarantees.
Landlord ↔ Tenant lean methodology
- Overall (STATE)
- 90 Strongly Landlord-Friendly
- State Alabama
- 90 Strongly Landlord-Friendly · R+15
- County
- — inherits STATE
- City
- — inherits STATE
ZIP-level market 36619
- Home prices YoY
- -20.8%
- Active inventory
- 142
- Price-to-rent
- 9.0×
Monthly cashflow live
- Estimated rent
- $1,300 medium interval (Pro) →
- Mortgage (P&I)
- −$734
- Tax from tax record
- −$33 /mo · $396/yr
- Insurance
- −$58
- HOA
- −$0
- Vacancy / Maint / Mgmt
- −$273
- Net cashflow
- $202
Break-even live
UW: 25.0% down · 7.5% · 30yr · 1.5% tax · 5.0% vac · 8.0% maint · 8.0% mgmt
Financing live
Cash to close
- Down payment
- $34,975
- Closing costs
- $4,197
- Reserves months
- —
- Total cash needed
- —
Loan-product check · same deal, 3 products live
Conventional
25% down · 7.5% · 30yr
- Down + closing
- —
- Monthly P&I
- —
- Monthly cashflow
- —
- DSCR
- —
- Eligible?
- —
Personal DTI + credit; lowest rate.
DSCR
20% down · 8.5% · 30yr
- Down + closing
- —
- Monthly P&I
- —
- Monthly cashflow
- —
- DSCR
- —
- Eligible?
- —
No personal income docs; deal must DSCR.
Hard money
10% down · 12.0% · 12mo
- Down + closing
- —
- Monthly P&I
- —
- Monthly cashflow
- —
- DSCR
- —
- Eligible?
- —
Short-term bridge; refi at stabilization.
Rent comps 1 comps
| Address | Beds | Baths | Sqft | Rent | $/sqft | DOM | Units | Dist |
|---|---|---|---|---|---|---|---|---|
| 5920 Windy Hill Cir S Mobile, AL | 3.0 | 1.0 | 960 | $1,300 | $1.35 | 21d | 1 | 1.23mi |
Listing history 12 events
-
2026-06-05days on market $139,900 Active 34 DOM
-
2026-06-03days on market $139,900 Active 33 DOM
-
2026-06-03price $139,900 Active 32 DOM
-
2026-06-02days on market $145,000 Active 32 DOM
-
2026-06-01days on market $145,000 Active 31 DOM
-
2026-05-31days on market $145,000 Active 30 DOM
-
2026-05-30days on market $145,000 Active 29 DOM
-
2026-05-12price $155,000 181-char remark
-
2026-05-01$165,000 Active 181-char remark
-
2022-05-11soldstatus $83,000
-
2022-05-10soldstatus $83,000 362-char remark
Show marketing remark (362 chars)
This 3 bed 1 1/2 bath House will make a Great income producing rental Property, or would make a great home for someone wanting a house for under 100k. The inside will need to be painted and may need a few updates. Call your favorite Realtor and make your appt today! Listing Agent makes no representation to accuracy of sq. ft. Buyer to verify all information.
-
2020-07-16soldstatus $40,000
ⓘ Source: listings_history table (triggers on properties + properties_extension) + one-shot
backfill from property_details.listing_events for pre-trigger history.
Tax reassessment forecast AL · Resets to sale price
- Current annual tax
- $396 · $33/mo
- Projected year-2 tax
- $574 · $48/mo
- Expected delta
- +$178/yr (+$15/mo · 45.0%)
ⓘ Screening estimate from a state-policy table — verify with the county assessor before closing.
Climate risk First Street
- Flood 1/10 Low FEMA zone X (unshaded) · 0% chance over 30 yrs
- Wildfire 5/10 Major
- Heat 9/10 Extreme 7 d/yr ≥105°F today · 20 d/yr by 30 yrs out
- Wind 9/10 Extreme 99% chance of damaging wind over 30 yrs
- Air quality 1/10 Low 0 unhealthy d/yr today · 0 by 30 yrs out
Nearby sold comps map
Loading sold comps map…
Walkable amenities ~0.75 mi
Loading nearby amenities…
Taxation est. · year 1
- Rental income
- $15,600
- − Mortgage interest
- −$7,837
- − Property taxes
- −$396
- − Insurance
- −$700
- − Repairs & maintenance
- −$1,248
- − Management
- −$1,248
- − Depreciation
- −$4,070
- Taxable income
- $102
- Est. tax owed @ 24.0%
- −$25
- After-tax cash flow
- $2,400/yr
For passive investors: Depreciation is non-cash, so a rental often shows a tax loss while cash-flowing — sheltering income. Rental losses are passive: they offset passive income freely, and up to $25,000/yr can offset ordinary (W-2) income if you actively participate and your MAGI is under $100k (phasing out to $0 by $150k); unused losses carry forward. On sale, claimed depreciation is recaptured at up to 25%, and gains may owe capital-gains tax (a 1031 exchange can defer both). Figures are a year-1 estimate at your 24.0% rate — not tax advice; consult a CPA.
Schools (NCES district)
- District
- Mobile County
- NCES district ID
- 0102370
- Math proficiency
- 15% ▼ -28.00%
- Reading proficiency
- 39% ▬ 0.00%
- Median HH income
- $42,455
- Composite
- 22.9/100
- National rank
- #8002
- State rank
- #81 of 129 in AL
Livability — Tillmans Corner
- Score
- 61/100
- State rank
- #260
- US rank
- #18090
Category grades
Schools grade is shown separately in the Schools card above.
Census & demographics
- Census place
- Tillmans Corner, AL
- City population
- 14,550
- Population (ZIP)
- 14,550
Population outlook (Mobile County) Hauer SSP2
- Today (2025)
- 415,303 people
- By 2030
- 411,755 · -0.9%
- By 2040
- 399,670 · -3.8%
- By 2050
- 382,616 · -7.9%
- By 2075
- 337,353 · -18.8%
- By 2100
- 283,391 · -31.8%
Race, ethnicity, and origin ACS 2023
- Neighborhood character
- Predominantly White (74%)
- Race & ethnicity
- White 74% Black 11% Two or more races 6% Hispanic / Latino 6% Asian 6%
- Hispanic origin (detail)
- Mexican 2% Puerto Rican 2%
- Common ancestry
- Lithuanian 5% Romanian 1% Portuguese 1%
- Foreign-born
- 4% · Canada, Vietnam
- Languages at home
- 90% English-only · Vietnamese 5% Spanish 4% French/Haitian/Cajun 1%
Political lean MEDSL · Mobile
- 2024 margin
- R (+16.4) · D 41.3% · R 57.7%
- 2008→2024 swing
- -7.7pp toward R · 2008: -8.7pp · 2024: -16.4pp
- All cycles
- 2024: R+16.4 2020: R+11.9 2016: R+13.9 2012: R+9.3 2008: R+8.7
Not yet ingested
- Civics
- —
Market trends
- HPI YoY
- ▼ -51.67%
- Current HPI
- 197.1074
- Rent YoY
- —
- Metro
- —
- State GDP YoY
- ▲ 2.94%
- F500 in state
- 4
Industry mix (Fortune 500 HQ in AL)
| Industry | F500 HQs | Revenue |
|---|---|---|
| Financial Services | 1 | $8B |
|
||
| Healthcare | 1 | $5B |
|
||
Price history
+249.8% since first listed6 events — show timeline
- 2026-06-02 Price Changed $139,900 GCMLS AL
- 2026-05-27 Price Changed $145,000 GCMLS AL
- 2026-05-12 Price Changed $155,000 GCMLS AL
- 2022-05-11 Sold (Public Records) $83,000 Public Records
- 2022-05-10 Sold (MLS) $83,000 GCMLS AL
- 2020-07-16 Sold (Public Records) $40,000 Public Records
Property tax history
-1.6%/yrLatest (2025): $396 · +8.2% YoY. Source: county tax records.
Cash-flow waterfall
monthlySold comps — $/sqft
last 12 mo · ≤1 miLoading sold comps…