 Multi-family
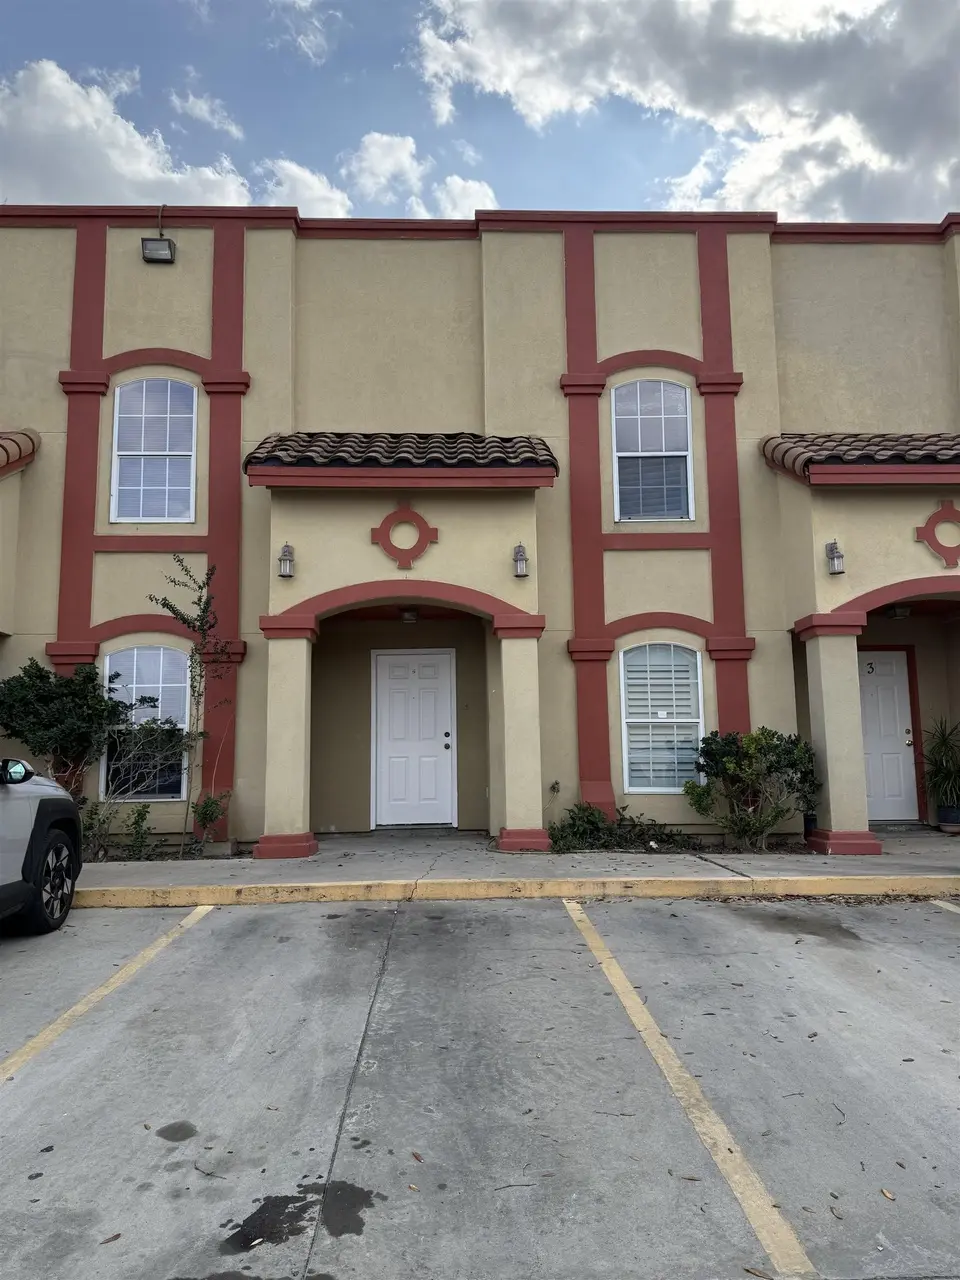
1020 Dicky Ln #2 · Laredo, TX
Flood risk No data
- FEMA flood zone
- —
- Chance of flooding over 30 yrs
- —
- Est. flood insurance / yr
- —
Fire risk No data
- Est. fire insurance / yr
- —
Heat risk No data
- Hot days now (above threshold)
- —
- Hot days in 30 yrs
- —
Wind risk No data
- Chance of severe wind over 30 yrs
- —
Air-quality risk No data
- Unhealthy air days now
- —
- Unhealthy air days in 30 yrs
- —
Risk factors via First Street. Map © Google.
Why this score? — see what drove the D+ grade
The composite is a weighted blend of 9 inputs, each scored 0–100. Each bar is that input's sub-score; the figure is the points it added to the 100-point composite (weight × sub-score).
- Cash flow +16.0/30.0
- ARV discount +7.5/15.0
- DSCR +4.9/10.0
- 1% rule +4.4/10.0
- Condition / age +3.8/5.0
- Rent growth +3.7/5.0
- Livability +3.7/5.0
- Schools +2.8/10.0
- Appreciation +0.0/10.0
$165,000
🖨 Deal sheet (PDF) 📄 Offer letter ✓ Due diligence
Multi-family units
County records classify this as Multi-Family (5+ Unit). Listing-text estimate: 1 unit. estimate disagrees with records
5+ unit building — per-unit beds/baths from public records are typically unavailable; the breakdown below (if shown) is an estimate from the listing text.
Listing remarks
Newly painted condo in central Laredo. Offering 3 bedrooms 2.5 baths
Key facts
- 2,766 sq ft lot
- Built 2006
- Listed 62 days
Property features AI
Exterior
- Parking: Concrete parking
- Utilities: Public water; Underground utilities
- Home design: Condo/Townhouse (residential); 2 stories
- Construction: Stucco construction; Slab foundation
- Exterior features: Level lot
Interior
- Flooring: Tile flooring; Wood flooring
- Bathrooms: 2 full bathrooms; 1 half bathroom
- Heating & cooling: Central heating (electric); Central air; Ceiling fans
- Interior features: Electric water heater
Neighborhood map
What this means for you Summary
Snapshot
- This is a 3-bed/2.5-bath multifamily listed at $165k. Condition is rated good.
Deal economics
- At list price, monthly cash flow is $80 ($963/yr) — positive.
- The deal already cash-flows at list — no discount required.
- To meet the 1% rule (rent ≥ 1% of price), the offer needs to be $155k (6.4% below list).
- Recommended offer: $155k (6.4% below list) — sets the bar for 1% rule.
- Cap rate 6.9% vs local median 4.1% in Laredo — top-decile yield for the area; either an underpriced asset or a hidden risk that comps aren't pricing in. Stress-test before assuming the spread holds.
Location & tenants
- Location reads 73/100 on livability (#227 in TX) — a middle-class / working-renter tenant base. Strengths: cost of living A+, housing A+, health & safety A+; Watch: crime C-, employment D+, amenities F.
- United ISD (urban): math 27% / reading 38% proficiency, ranked #568 of 826 in TX (top 69%) — families likely to look elsewhere, expect single-tenant / working-renter base with shorter leases; 72% free/reduced lunch — lower-income household profile, screen leases tightly.
- Zoned schools: Bonnie L Garcia El (math 18% / reading 27%, grade F, #3,311 of 4,322 statewide, top 77%, 741 students, 84% FRL); United South Middle (math 25% / reading 33%, grade F, #1,103 of 1,662 statewide, top 67%, 1,009 students, 84% FRL); United South H S (math 44% / reading 44%, grade F, #697 of 1,632 statewide, top 43%, 3,243 students, 85% FRL).
- Market conditions: Rents rising fast (+4.7%/yr); 399 active listings in the ZIP; 9 comparable units currently listed for rent nearby; rentals lingering (median 46d on market — plan ~5-8 weeks vacancy on turnover, expect pricing pressure); 100% of comp listings sitting > 30 days — soft ceiling on asking rent; solid renter incomes; 1,448 units permitted in Webb County in 2024 (245 in 5+ unit buildings).
Forward outlook
- Local home prices are declining (-3.0%/yr); year-one equity from $1k of loan paydown is wiped out by about $5k of value loss. Plan a longer hold.
- Webb County population projected at +23% by 2050 — long-run rental-demand tailwind backs the buy-and-hold thesis.
Negotiation context
- It's been on market 63 days — a 6% lower offer ($155k) is reasonable based on typical stale-listing flexibility.
- 2 sale attempts; this cycle's ask has dropped $15k (8%) from the opening price — seller is motivated, your offer sets the floor, not the list.
Questions for the listing agent
- It's been on market 63 days. Have you received any prior offers? Is the seller open to a 6% concession, seller financing, or rate buy-down credit?
- Why hasn't it sold? Are there any deal-killer items the seller is aware of (foundation, flood, title, zoning, code violations)?
- Is there a deadline driving the sale (1031 exchange, divorce, estate, relocation)? That informs how much negotiation room exists.
- The area grade is low — what's the realistic commute time and amenity access for the typical tenant pool here? Any planned neighborhood developments (good or bad) we should know about?
- What's the average days-on-market for RENTAL listings here right now (not sales)? A rising rental-DOM trend means longer vacancies and softer asking-rent achievability than the comps imply.
- What's the recent tenant-quality profile in this submarket — average credit score on applications, eviction rate, late-payment / NSF rate, and stable-employment percentage? A property-management company in the area should have these aggregated.
- How much new apartment / multifamily construction is in the pipeline within 1–3 miles? Heavy new supply (>2% of stock underway) typically softens rents 12–24 months out; light construction supports rent growth.
Investment metrics
- 1% rule
- 0.94% ✗
- Cap rate
- 6.88%
- Cash-on-cash
- 2.09%
- DSCR
- 1.09
- GRM
- 8.9
CMA / ARV
No comps found within radius.
Projected returns pro-forma
-3.0% appreciation · 4.7% rent growth · sell at horizon
- IRR
- -11.1%
- Equity multiple
- 0.59×
- Total profit
- $-18,913
- Equity at exit
- $24,602
- IRR
- 0.5%
- Equity multiple
- 1.04×
- Total profit
- $1,626
- Equity at exit
- $14,266
Cash invested: $46,200 (down + closing). Projections, not guarantees.
Landlord ↔ Tenant lean methodology
- Overall (STATE)
- 87 Strongly Landlord-Friendly
- State Texas
- 87 Strongly Landlord-Friendly · R+5
- County
- — inherits STATE
- City
- — inherits STATE
ZIP-level market 78045
- Home prices YoY
- -34.5%
- Rents YoY
- 4.7%
- Active inventory
- 399
- Price-to-rent
- 8.9×
Monthly cashflow live
- Estimated rent
- $1,545 high interval (Pro) →
- Mortgage (P&I)
- −$865
- Tax est. 1.5%
- −$206 /mo · $2,475/yr
- Insurance
- −$69
- HOA
- −$0
- Vacancy / Maint / Mgmt
- −$324
- Net cashflow
- $80
Break-even live
Sensitivity live
| Price | -10% $194 | -5% $137 | +0% $80 | +5% $23 | +10% $-34 |
|---|---|---|---|---|---|
| Rent | -10% $-42 | -5% $19 | +0% $80 | +5% $141 | +10% $202 |
| Rate | -1.0pp $163 | -0.5pp $122 | base $80 | +0.5pp $38 | +1.0pp $-6 |
UW: 25.0% down · 7.5% · 30yr · 1.5% tax · 5.0% vac · 8.0% maint · 8.0% mgmt
Financing live
Cash to close
- Down payment
- $41,250
- Closing costs
- $4,950
- Reserves months
- —
- Total cash needed
- —
Loan-product check · same deal, 3 products live
Conventional
25% down · 7.5% · 30yr
- Down + closing
- —
- Monthly P&I
- —
- Monthly cashflow
- —
- DSCR
- —
- Eligible?
- —
Personal DTI + credit; lowest rate.
DSCR
20% down · 8.5% · 30yr
- Down + closing
- —
- Monthly P&I
- —
- Monthly cashflow
- —
- DSCR
- —
- Eligible?
- —
No personal income docs; deal must DSCR.
Hard money
10% down · 12.0% · 12mo
- Down + closing
- —
- Monthly P&I
- —
- Monthly cashflow
- —
- DSCR
- —
- Eligible?
- —
Short-term bridge; refi at stabilization.
Rent comps 9 comps
| Address | Beds | Baths | Sqft | Rent | $/sqft | DOM | Units | Dist |
|---|---|---|---|---|---|---|---|---|
| 1020 Dicky Ln Unit 2 Laredo, TX | 3.0 | 2.5 | 1265 | $1,500 | $1.19 | 45d | 1 | 0.02mi |
| 4248 Dorel Dr Unit 102C Laredo, TX | 3.0 | 2.5 | 1450 | $1,300 | $0.90 | 45d | 1 | 0.22mi |
| 4246 Dorel Dr Unit 22 Laredo, TX | 2.0 | 2.5 | 1184 | $1,250 | $1.06 | 45d | 1 | 0.28mi |
| 1011 Emerald Valley Dr Unit 112 B Laredo, TX | 3.0 | 2.5 | 1659 | $1,500 | $0.90 | 45d | 1 | 0.33mi |
| 1011 Emerald Valley Dr #101 Laredo, TX | 3.0 | 2.5 | 1659 | $1,700 | $1.02 | 45d | 1 | 0.33mi |
| 311 Dorel Dr Unit 203 Laredo, TX | 2.0 | 1.0 | 923 | $1,200 | $1.30 | 45d | 1 | 0.44mi |
| 3118 Garfield St Unit 5 Laredo, TX | 2.0 | 1.0 | 887 | $1,050 | $1.18 | 45d | 1 | 0.84mi |
| 402 Prescott Loop Laredo, TX | 3.0 | 2.0 | 1122 | $1,550 | $1.38 | 45d | 1 | 1.16mi |
| 1201 Gage Loop Unit G80 Laredo, TX | 3.0 | 2.0 | 981 | $1,475 | $1.50 | 45d | 1 | 1.42mi |
Listing history 22 events
-
2026-06-22days on market $165,000 Active 63 DOM
-
2026-06-21days on market $165,000 Active 62 DOM
-
2026-06-19days on market $165,000 Active 60 DOM
-
2026-06-18days on market $165,000 Active 59 DOM
-
2026-06-18price $165,000 Active 58 DOM
-
2026-06-17days on market $174,000 Active 58 DOM
-
2026-06-16days on market $174,000 Active 57 DOM
-
2026-06-15days on market $174,000 Active 56 DOM
-
2026-06-14days on market $174,000 Active 54 DOM
-
2026-06-13days on market $174,000 Active 53 DOM
-
2026-06-10days on market $174,000 Active 51 DOM
-
2026-06-09days on market $174,000 Active 50 DOM
-
2026-06-08days on market $174,000 Active 49 DOM
-
2026-06-07days on market $174,000 Active 48 DOM
-
2026-06-03days on market $174,000 Active 44 DOM
-
2026-06-02days on market $174,000 Active 43 DOM
-
2026-06-01days on market $174,000 Active 42 DOM
-
2026-05-31days on market $174,000 Active 41 DOM
-
2026-05-30days on market $174,000 Active 40 DOM
-
2026-05-15price $174,000 68-char remark
-
2026-04-20$180,000 Active 68-char remark
-
2026-03-28$1,500
ⓘ Source: listings_history table (triggers on properties + properties_extension) + one-shot
backfill from property_details.listing_events for pre-trigger history.
Nearby sold comps map
Loading sold comps map…
Walkable amenities ~0.75 mi
Loading nearby amenities…
Taxation est. · year 1
- Rental income
- $18,540
- − Mortgage interest
- −$9,243
- − Property taxes
- −$2,475
- − Insurance
- −$825
- − Repairs & maintenance
- −$1,483
- − Management
- −$1,483
- − Depreciation
- −$4,800
- Taxable loss
- −$1,769
- Est. tax savings @ 24.0%
- +$425
- After-tax cash flow
- $1,388/yr
For passive investors: Depreciation is non-cash, so a rental often shows a tax loss while cash-flowing — sheltering income. Rental losses are passive: they offset passive income freely, and up to $25,000/yr can offset ordinary (W-2) income if you actively participate and your MAGI is under $100k (phasing out to $0 by $150k); unused losses carry forward. On sale, claimed depreciation is recaptured at up to 25%, and gains may owe capital-gains tax (a 1031 exchange can defer both). Figures are a year-1 estimate at your 24.0% rate — not tax advice; consult a CPA.
Condition & rehab AI · 1 photo
This property is in good condition with a recently painted exterior and well-maintained landscaping, making it a good candidate for both resale and rental.
Value-add opportunities
- Both Paint exterior — Enhances curb appeal and resale value
- Both Landscaping — Improves curb appeal and rental value
- Both HVAC maintenance — Ensures comfort and energy efficiency
Renovation cost estimate screening
Value-add ROI direction
- Both Paint exterior — Enhances curb appeal and resale value ↑
- Both Landscaping — Improves curb appeal and rental value ↑
- Both HVAC maintenance — Ensures comfort and energy efficiency ↑
ⓘ Cost ranges are severity-bucket heuristics (US national rule-of-thumb). Get contractor quotes + a written scope before underwriting a rehab budget.
Schools (NCES district)
- District
- United ISD
- NCES district ID
- 4843650
- Math proficiency
- 27% ▼ -36.00%
- Reading proficiency
- 38% ▼ -11.00%
- Median HH income
- $47,780
- Composite
- 28.02/100
- National rank
- #6848
- State rank
- #568 of 826 in TX
Livability — Laredo
- Score
- 73/100
- State rank
- #227
- US rank
- #5399
Category grades
Schools grade is shown separately in the Schools card above.
Census & demographics
- Census place
- Laredo, TX
- County
- Webb County · 67,333 people
- City population
- 67,333
- Metro
- Laredo, TX
- Population (ZIP)
- 67,333
- Household income
- $90,608
- Rent vs Own
- Severe rent burden
- 1042.0
Population outlook (Webb County) Hauer SSP2
- Today (2025)
- 301,387 people
- By 2030
- 316,307 · +5.0%
- By 2040
- 345,636 · +14.7%
- By 2050
- 370,647 · +23.0%
- By 2075
- 413,907 · +37.3%
- By 2100
- 416,458 · +38.2%
Race, ethnicity, and origin ACS 2023
- Neighborhood character
- Predominantly Hispanic (93%)
- Race & ethnicity
- Hispanic / Latino 93% Two or more races 50% White 5%
- Hispanic origin (detail)
- Mexican 87%
- Foreign-born
- 26% · Canada
- Languages at home
- 16% English-only · Spanish 82%
Political lean MEDSL · Webb
- 2024 margin
- Toss-up / Even · D 48.5% · R 50.7%
- 2008→2024 swing
- -45.6pp toward R · 2008: 43.4pp · 2024: -2.2pp
- All cycles
- 2024: R+2.2 2020: D+23.3 2016: D+51.6 2012: D+54.0 2008: D+43.4
Not yet ingested
- Civics
- —
Market trends
- HPI YoY
- ▼ -88.24%
- Current HPI
- 167.3597
- Rent YoY
- ▲ 4.70%
- Metro
- Laredo, TX
- State GDP YoY
- ▲ 3.95%
- F500 in state
- 110
Industry mix (Fortune 500 HQ in TX)
| Industry | F500 HQs | Revenue |
|---|---|---|
| Energy | 16 | $1,198B |
|
||
| Technology | 5 | $198B |
|
||
| Engineering / Construction | 4 | $72B |
|
||
| Energy Services | 3 | $60B |
|
||
| Utilities | 3 | $41B |
|
||
| Healthcare | 2 | $330B |
|
||
Price history
+10900.0% since first listed5 events — show timeline
- 2026-06-17 Price Changed $165,000 LAOR
- 2026-06-13 Rental Removed $1,500 LAOR
- 2026-05-15 Price Changed $174,000 LAOR
- 2026-04-20 Listed $180,000 LAOR
- 2026-03-28 Listed for Rent $1,500 LAOR
Cash-flow waterfall
monthlySold comps — $/sqft
last 12 mo · ≤1 miLoading sold comps…