50523 US Hwy 93 Spc 7 · Big Arm, MT
Flood risk No data
- FEMA flood zone
- —
- Chance of flooding over 30 yrs
- —
- Est. flood insurance / yr
- —
Fire risk No data
- Est. fire insurance / yr
- —
Heat risk No data
- Hot days now (above threshold)
- —
- Hot days in 30 yrs
- —
Wind risk No data
- Chance of severe wind over 30 yrs
- —
Air-quality risk No data
- Unhealthy air days now
- —
- Unhealthy air days in 30 yrs
- —
Risk factors via First Street. Map © Google.
Why this score? — see what drove the B- grade
The composite is a weighted blend of 9 inputs, each scored 0–100. Each bar is that input's sub-score; the figure is the points it added to the 100-point composite (weight × sub-score).
- Cash flow +30.0/30.0
- 1% rule +10.0/10.0
- DSCR +10.0/10.0
- ARV discount +7.5/15.0
- Schools +2.7/10.0
- Rent growth +2.5/5.0
- Livability +2.2/5.0
- Condition / age +1.0/5.0
- Appreciation +0.0/10.0
$99,000
🖨 Deal sheet 📄 Offer letter ✓ Due diligence
Key facts
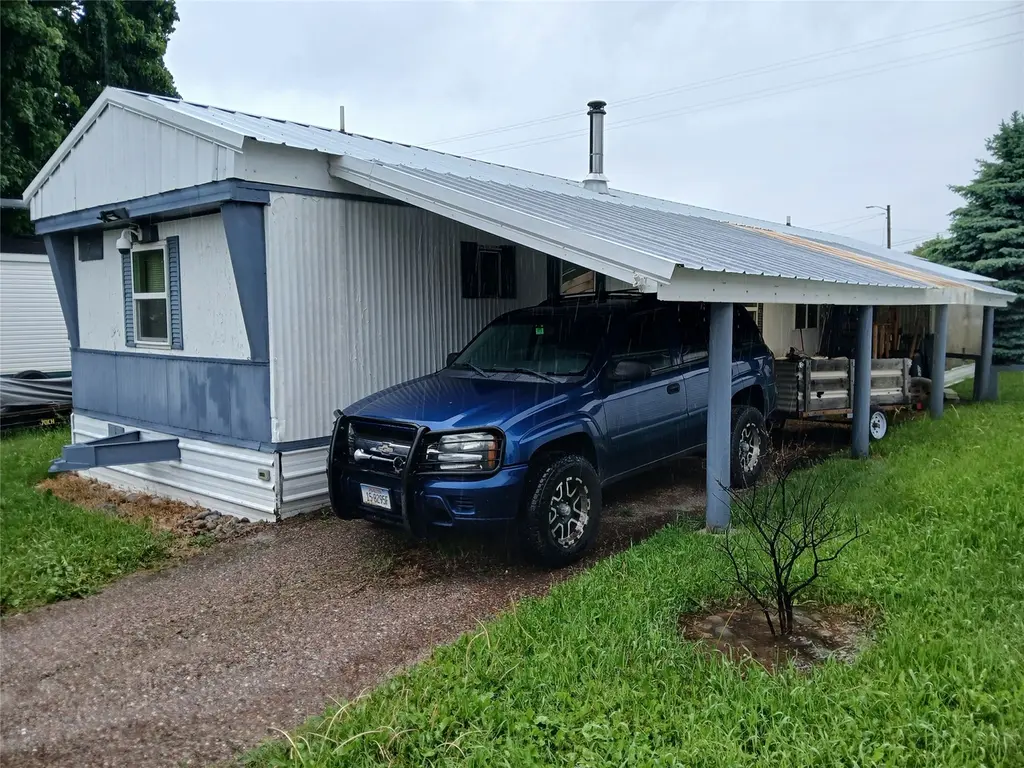
- Brand new metal shed
- Parking
- Built 1977
Tags
Property features AI
Finance
- Financial info: Land is leased
Exterior
- Parking: Carport (1 space)
- Home design: Manufactured home; Residential property
- Construction: Other foundation
- Exterior features: Metal roof
Interior
- Kitchen: Dishwasher; Microwave; Range; Refrigerator
- Bathrooms: 1 full bathroom; 1 half bathroom
- Heating & cooling: Electric heating; Forced air; Wood stove
- Interior features: Dryer; Dishwasher; Microwave; Range; Refrigerator; Washer
- Laundry & utility: Washer hookup; Washer; Dryer
Neighborhood map
What this means for you Summary
Snapshot
- This is a 3-bed/1.5-bath manufactured listed at $99k. Condition is rated poor.
Deal economics
- At list price, monthly cash flow is $651 ($8k/yr) — positive.
- The deal already cash-flows at list — no discount required.
- Meets the 1% rule at list price ($2k rent vs $99k).
- Recommended offer: $98k (1.5% below list) — sets the bar for market timing.
Location & tenants
- Location reads 44/100 on livability (#346 in MT) — a working-class tenant base; expect higher turnover. Strengths: cost of living A+, crime A; Watch: schools F, amenities F, commute F.
- Polson Elementary (town): math 26% / reading 38% proficiency, ranked #82 of 116 in MT (top 71%) — families likely to look elsewhere, expect single-tenant / working-renter base with shorter leases.
- Market conditions: 217 active listings in the ZIP; 19 units permitted in Lake County in 2024 (0 in 5+ unit buildings).
Forward outlook
- Local home prices are declining (-3.0%/yr); year-one equity from $684 of loan paydown is wiped out by about $3k of value loss. Plan a longer hold.
- At projected returns (-3.0% appreciation + 3.0% rent growth), your $28k cash investment doubles in ~5 years — after that, you're playing with house money.
Negotiation context
- It's been on market 15 days — a 2% lower offer ($98k) is reasonable based on typical stale-listing flexibility.
Questions for the listing agent
- Have any recent inspections been done? Can we get a copy of the seller's disclosures and any deferred-maintenance estimates?
- Built in 1977 — when were the roof, HVAC, electrical panel, plumbing, and water heater last replaced?
- Is there a deadline driving the sale (1031 exchange, divorce, estate, relocation)? That informs how much negotiation room exists.
- Schools are F-rated, which usually means shorter tenancies and higher turnover. Who's the typical renter profile here, and what's been the actual vacancy rate?
- What's the average days-on-market for RENTAL listings here right now (not sales)? A rising rental-DOM trend means longer vacancies and softer asking-rent achievability than the comps imply.
- What's the recent tenant-quality profile in this submarket — average credit score on applications, eviction rate, late-payment / NSF rate, and stable-employment percentage? A property-management company in the area should have these aggregated.
- How much new for-sale + rental construction is in the pipeline within 1–3 miles? Heavy new supply typically softens prices + rents 12–24 months out; constrained supply supports both.
Investment metrics
- 1% rule
- 1.71% ✓
- Cap rate
- 14.19%
- Cash-on-cash
- 28.19%
- DSCR
- 2.25
- GRM
- 4.9
CMA / ARV
No comps found within radius.
Projected returns pro-forma
-3.0% appreciation · 3.0% rent growth · sell at horizon
- IRR
- 22.4%
- Equity multiple
- 1.92×
- Total profit
- $25,453
- Equity at exit
- $14,761
- IRR
- 30.4%
- Equity multiple
- 3.73×
- Total profit
- $75,666
- Equity at exit
- $8,560
Cash invested: $27,720 (down + closing). Projections, not guarantees.
Landlord ↔ Tenant lean methodology
- Overall (STATE)
- 82 Strongly Landlord-Friendly
- State Montana
- 82 Strongly Landlord-Friendly · R+11
- County
- — inherits STATE
- City
- — inherits STATE
ZIP-level market 59860
- Home prices YoY
- -33.6%
- Active inventory
- 217
- Price-to-rent
- 4.9×
Monthly cashflow live
- Estimated rent
- $1,690 medium interval (Pro) →
- Mortgage (P&I)
- −$519
- Tax est. 1.5%
- −$124 /mo · $1,485/yr
- Insurance
- −$41
- HOA
- −$0
- Vacancy / Maint / Mgmt
- −$355
- Net cashflow
- $651
Break-even live
UW: 25.0% down · 7.5% · 30yr · 1.5% tax · 5.0% vac · 8.0% maint · 8.0% mgmt
Financing live
Cash to close
- Down payment
- $24,750
- Closing costs
- $2,970
- Reserves months
- —
- Total cash needed
- —
Loan-product check · same deal, 3 products live
Conventional
25% down · 7.5% · 30yr
- Down + closing
- —
- Monthly P&I
- —
- Monthly cashflow
- —
- DSCR
- —
- Eligible?
- —
Personal DTI + credit; lowest rate.
DSCR
20% down · 8.5% · 30yr
- Down + closing
- —
- Monthly P&I
- —
- Monthly cashflow
- —
- DSCR
- —
- Eligible?
- —
No personal income docs; deal must DSCR.
Hard money
10% down · 12.0% · 12mo
- Down + closing
- —
- Monthly P&I
- —
- Monthly cashflow
- —
- DSCR
- —
- Eligible?
- —
Short-term bridge; refi at stabilization.
Listing history 11 events
-
2026-06-18days on market $99,000 Active 15 DOM
-
2026-06-17days on market $99,000 Active 14 DOM
-
2026-06-16days on market $99,000 Active 13 DOM
-
2026-06-15days on market $99,000 Active 12 DOM
-
2026-06-13days on market $99,000 Active 10 DOM
-
2026-06-12days on market $99,000 Active 9 DOM
-
2026-06-09days on market $99,000 Active 6 DOM
-
2026-06-08days on market $99,000 Active 5 DOM
-
2026-06-07days on market $99,000 Active 4 DOM
-
2026-06-05days on market $99,000 Active 2 DOM
-
2026-06-04$99,000 Active 1 DOM
ⓘ Source: listings_history table (triggers on properties + properties_extension) + one-shot
backfill from property_details.listing_events for pre-trigger history.
Nearby sold comps map
Loading sold comps map…
Walkable amenities ~0.75 mi
Loading nearby amenities…
Taxation est. · year 1
- Rental income
- $20,283
- − Mortgage interest
- −$5,546
- − Property taxes
- −$1,485
- − Insurance
- −$495
- − Repairs & maintenance
- −$1,623
- − Management
- −$1,623
- − Depreciation
- −$2,880
- Taxable income
- $6,632
- Est. tax owed @ 24.0%
- −$1,592
- After-tax cash flow
- $6,222/yr
For passive investors: Depreciation is non-cash, so a rental often shows a tax loss while cash-flowing — sheltering income. Rental losses are passive: they offset passive income freely, and up to $25,000/yr can offset ordinary (W-2) income if you actively participate and your MAGI is under $100k (phasing out to $0 by $150k); unused losses carry forward. On sale, claimed depreciation is recaptured at up to 25%, and gains may owe capital-gains tax (a 1031 exchange can defer both). Figures are a year-1 estimate at your 24.0% rate — not tax advice; consult a CPA.
Condition & rehab AI · 2 photos
This manufactured home requires extensive repairs and maintenance, including a new roof, exterior siding repair, and landscaping improvements. Immediate action is needed to prevent further damage and increase its value.
Repairs flagged
- Major roof — Rusty metal roof with visible rust
- Major exterior siding — Weathered siding with visible damage
- Major landscaping — Overgrown and unkempt yard
Value-add opportunities
- Both repair and paint exterior siding — Enhances curb appeal and property value
- Both trim and maintain landscaping — Improves curb appeal and property value
- Both repair and replace roof — Critical to prevent water damage and maintain property value
Renovation cost estimate screening
| Repair item | Severity | Est. cost |
|---|---|---|
| roof · Rusty metal roof with visible rust | Major | $15,000–50,000 |
| exterior siding · Weathered siding with visible damage | Major | $15,000–50,000 |
| landscaping · Overgrown and unkempt yard | Major | $15,000–50,000 |
| Total estimated repair cost · 3 items | $45,000–150,000 |
Value-add ROI direction
- Both repair and paint exterior siding — Enhances curb appeal and property value ↑
- Both trim and maintain landscaping — Improves curb appeal and property value ↑
- Both repair and replace roof — Critical to prevent water damage and maintain property value ↑
ⓘ Cost ranges are severity-bucket heuristics (US national rule-of-thumb). Get contractor quotes + a written scope before underwriting a rehab budget.
Schools (NCES district)
- District
- Polson Elementary
- NCES district ID
- 3021060
- Math proficiency
- 26% ▼ -12.00%
- Reading proficiency
- 38% ▼ -11.00%
- Median HH income
- $38,859
- Composite
- 26.75/100
- National rank
- #7137
- State rank
- #82 of 116 in MT
Livability — Big Arm
- Score
- 44/100
- State rank
- #346
- US rank
- #26731
Category grades
Schools grade is shown separately in the Schools card above.
Census & demographics
- Population (ZIP)
- 11,580
Population outlook (Lake County) Hauer SSP2
- Today (2025)
- 30,614 people
- By 2030
- 30,774 · +0.5%
- By 2040
- 30,830 · +0.7%
- By 2050
- 31,195 · +1.9%
- By 2075
- 33,748 · +10.2%
- By 2100
- 35,779 · +16.9%
Race, ethnicity, and origin ACS 2023
- Neighborhood character
- Predominantly White (70%)
- Race & ethnicity
- White 70% Two or more races 14% Native American 13% Hispanic / Latino 4%
- Common ancestry
- Portuguese 5% Slovak 3% Lithuanian 3%
- Foreign-born
- 3% · Canada
- Languages at home
- 97% English-only · Spanish 1%
Political lean MEDSL · Lake
- 2024 margin
- R (+19.9) · D 38.5% · R 58.4% · Other 3.1%
- 2008→2024 swing
- -21.9pp toward R · 2008: 1.9pp · 2024: -19.9pp
- All cycles
- 2024: R+19.9 2020: R+14.5 2016: R+21.3 2012: R+10.4 2008: D+1.9
Not yet ingested
- Civics
- —
Market trends
- HPI YoY
- ▼ -120.28%
- Current HPI
- 238.0612
- Rent YoY
- —
- Metro
- —
- State GDP YoY
- ▲ 3.41%
- F500 in state
- 2
Industry mix (Fortune 500 HQ in MT)
| Industry | F500 HQs | Revenue |
|---|---|---|
| Technology / Analytics | 1 | $2B |
|
||
Price history
1 event — show timeline
- 2026-06-03 Listed $99,000 MRMLS
Cash-flow waterfall
monthlySold comps — $/sqft
last 12 mo · ≤1 miLoading sold comps…