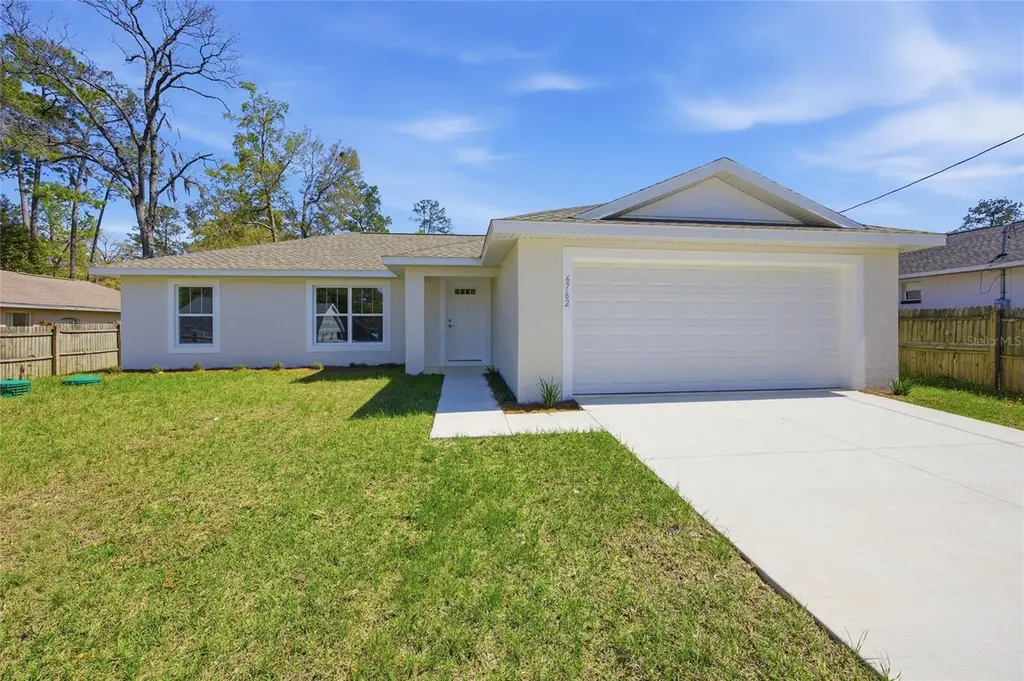
6762 W Cherry Rd · Silver Springs Shores, FL
Flood risk 1/10 · Minimal
- FEMA flood zone
- X (unshaded)
- Chance of flooding over 30 yrs
- 0.0%
- Est. flood insurance / yr
- $507 – $1,088
Fire risk 4/10 · Minor
- Est. fire insurance / yr
- $947 – $1,759
Heat risk 8/10 · Major
- Hot days now (above 108°F)
- 7 days/yr
- Hot days in 30 yrs
- 22 days/yr
Wind risk 9/10 · Severe
- Chance of severe wind over 30 yrs
- 99.0%
Air-quality risk 4/10 · Minor
- Unhealthy air days now
- 4 days/yr
- Unhealthy air days in 30 yrs
- 4 days/yr
Risk factors via First Street. Map © Google.
Why this score? — see what drove the F grade
The composite is a weighted blend of 9 inputs, each scored 0–100. Each bar is that input's sub-score; the figure is the points it added to the 100-point composite (weight × sub-score).
- Appreciation +8.0/10.0
- Cash flow +5.8/30.0
- Schools +3.6/10.0
- Livability +3.4/5.0
- Rent growth +2.5/5.0
- Condition / age +2.5/5.0
- ARV discount +1.6/15.0
- 1% rule +1.2/10.0
- DSCR +0.2/10.0
$279,999
🖨 Deal sheet (PDF) 📄 Offer letter ✓ Due diligence
Listing remarks MLS
Be the first to own this beautiful new construction 3-bedroom, 2-bath home designed with comfort, style, and modern living in mind. Featuring a spacious open floor plan, this home showcases durable luxury vinyl plank (LVP) flooring in the main living areas for a sleek look and easy maintenance. The open kitchen is perfect for entertaining, offering plenty of space to gather, along with granite countertops throughout, ample cabinetry, and a seamless flow into the dining and living areas—ideal for hosting family and friends. The primary suite provides a relaxing retreat, highlighted by a trey ceiling that adds elegance and character, along with a private en-suite bathroom and generous closet space. Two additional bedrooms for family, guests, or a home office. Step outside to enjoy the covered back porch, overlooking a fully fenced backyard—perfect for pets, play, or added privacy while entertaining. A 2-car garage adds convenience and additional storage. Conveniently located near Silver Springs State Park and close to shopping, dining, and everyday amenities—offering the perfect balance of nature and convenience.
Key facts
- Open floor plan
- New construction
- Granite countertops
Tags
Neighborhood map
What this means for you Summary
Snapshot
- This is a 3-bed/2.0-bath land listed at $280k.
Deal economics
- At list price, monthly cash flow is $-560 ($-7k/yr) — negative.
- To cash-flow at today's rent, offer at most $199k (28.9% below list).
- To meet the 1% rule (rent ≥ 1% of price), the offer needs to be $174k (37.8% below list).
- Recommended offer: $174k (37.8% below list) — sets the bar for 1% rule.
Location & tenants
- Location reads 68/100 on livability (#527 in FL) — a middle-class / working-renter tenant base. Strengths: cost of living A+, housing A+, health & safety A-; Watch: crime C-, employment D, schools F.
- Marion (rural): math 42% / reading 43% proficiency, ranked #61 of 73 in FL (top 84%) — families likely to look elsewhere, expect single-tenant / working-renter base with shorter leases; 61% free/reduced lunch — lower-income household profile, screen leases tightly.
- Market conditions: Rents flat; 674 active listings in the ZIP; 20 comparable units currently listed for rent nearby; rentals at typical pace (median 22d on market — plan ~3-4 weeks tenant-placement turnaround); 7,071 units permitted in Marion County in 2024 (534 in 5+ unit buildings).
- This rent runs 33% of the median local income ($64k/yr) — at the standard rent-burdened threshold; future hikes will face affordability resistance.
Forward outlook
- In year one you build about $19k of equity ($2k loan paydown + $17k appreciation (5.9% local appreciation)).
- Marion County population projected at +13% by 2050 — modest demand growth; plan on rents tracking national, not racing it.
- By year 3, paydown + projected appreciation supports a ~$46k cash-out refi (75% LTV) — recoverable capital for the next deal without selling this one.
Negotiation context
- It's been on market 85 days — a 6% lower offer ($263k) is reasonable based on typical stale-listing flexibility.
- 2 sale attempts since 2y ago with the ask held roughly flat each time — persistent listings suggest the price (not the market) is what's stuck; bring a comps-based counter.
- Current owner paid $8k; list at $280k implies a 3400% gain — meaningful room to come down on a strong offer.
Risks & watch-outs
- Climate carrying-cost: severe wind risk, 99% chance of damaging wind over 30y; extreme-heat days projected 7→22/yr by 2055 (HVAC capex compounding) — expect insurance premiums to compound above CPI over the hold.
Questions for the listing agent
- What do current leases actually rent for vs. the listed asking? Can we see a recent rent roll and the last 12 months of T-12 income?
- It's been on market 85 days. Have you received any prior offers? Is the seller open to a 38% concession, seller financing, or rate buy-down credit?
- Why hasn't it sold? Are there any deal-killer items the seller is aware of (foundation, flood, title, zoning, code violations)?
- Is there a deadline driving the sale (1031 exchange, divorce, estate, relocation)? That informs how much negotiation room exists.
- Schools are F-rated, which usually means shorter tenancies and higher turnover. Who's the typical renter profile here, and what's been the actual vacancy rate?
- The area grade is low — what's the realistic commute time and amenity access for the typical tenant pool here? Any planned neighborhood developments (good or bad) we should know about?
- What's the average days-on-market for RENTAL listings here right now (not sales)? A rising rental-DOM trend means longer vacancies and softer asking-rent achievability than the comps imply.
- What's the recent tenant-quality profile in this submarket — average credit score on applications, eviction rate, late-payment / NSF rate, and stable-employment percentage? A property-management company in the area should have these aggregated.
- How much new for-sale + rental construction is in the pipeline within 1–3 miles? Heavy new supply typically softens prices + rents 12–24 months out; constrained supply supports both.
Investment metrics
- 1% rule
- 0.62% ✗
- Cap rate
- 3.89%
- Cash-on-cash
- -8.56%
- DSCR
- 0.62
- GRM
- 13.4
CMA / ARV
- ARV (median comp)
- $247,432
- List price
- $279,999
- Delta
- 13.16%
- Verdict
- OVERPRICED
- Comps
- 20 within 1.0 mi
Projected returns pro-forma
5.93% appreciation · 0.17% rent growth · sell at horizon
- IRR
- 7.4%
- Equity multiple
- 1.50×
- Total profit
- $39,289
- Equity at exit
- $174,827
- IRR
- 8.6%
- Equity multiple
- 2.72×
- Total profit
- $135,103
- Equity at exit
- $316,016
Cash invested: $78,400 (down + closing). Projections, not guarantees.
Landlord ↔ Tenant lean methodology
- Overall (STATE)
- 87 Strongly Landlord-Friendly
- State Florida
- 87 Strongly Landlord-Friendly · R+3
- County
- — inherits STATE
- City
- — inherits STATE
ZIP-level market 34472
- Home prices YoY
- 2.4%
- Rents YoY
- 0.2%
- Active inventory
- 674
- Price-to-rent
- 13.4×
Monthly cashflow live
- Estimated rent
- $1,741 high interval (Pro) →
- Mortgage (P&I)
- −$1,468
- Tax est. 1.5%
- −$350 /mo · $4,200/yr
- Insurance
- −$117
- HOA
- −$0
- Vacancy / Maint / Mgmt
- −$366
- Net cashflow
- $-560
Break-even live
Sensitivity live
| Price | -10% $-366 | -5% $-463 | +0% $-560 | +5% $-656 | +10% $-753 |
|---|---|---|---|---|---|
| Rent | -10% $-697 | -5% $-628 | +0% $-560 | +5% $-491 | +10% $-422 |
| Rate | -1.0pp $-419 | -0.5pp $-488 | base $-560 | +0.5pp $-632 | +1.0pp $-706 |
UW: 25.0% down · 7.5% · 30yr · 1.5% tax · 5.0% vac · 8.0% maint · 8.0% mgmt
Financing live
Cash to close
- Down payment
- $70,000
- Closing costs
- $8,400
- Reserves months
- —
- Total cash needed
- —
Loan-product check · same deal, 3 products live
Conventional
25% down · 7.5% · 30yr
- Down + closing
- —
- Monthly P&I
- —
- Monthly cashflow
- —
- DSCR
- —
- Eligible?
- —
Personal DTI + credit; lowest rate.
DSCR
20% down · 8.5% · 30yr
- Down + closing
- —
- Monthly P&I
- —
- Monthly cashflow
- —
- DSCR
- —
- Eligible?
- —
No personal income docs; deal must DSCR.
Hard money
10% down · 12.0% · 12mo
- Down + closing
- —
- Monthly P&I
- —
- Monthly cashflow
- —
- DSCR
- —
- Eligible?
- —
Short-term bridge; refi at stabilization.
Rent comps 20 comps
| Address | Beds | Baths | Sqft | Rent | $/sqft | DOM | Units | Dist |
|---|---|---|---|---|---|---|---|---|
| 6688 Cherry Rd Ocala, FL | 3.0 | 2.0 | 1270 | $1,950 | $1.54 | 14d | 1 | 0.22mi |
| 62 Teak Loop Ocala, FL | 3.0 | 1.0 | 1018 | $1,450 | $1.42 | 14d | 1 | 0.23mi |
| 9 Banyan Course Run Ocala, FL | 3.0 | 2.0 | 1345 | $1,599 | $1.19 | 22d | 1 | 0.38mi |
| 9 Teak Way Dr Ocala, FL | 3.0 | 2.0 | 1352 | $1,800 | $1.33 | 14d | 1 | 0.46mi |
| 1503 Peachtree Ln Ocala, FL | 2.0 | 2.0 | 1152 | $1,450 | $1.26 | 22d | 1 | 0.55mi |
| 19 Pecan Pass Ter Ocala, FL | 3.0 | 2.0 | 1368 | $1,750 | $1.28 | 22d | 1 | 1.00mi |
| 5614 Pecan Rd Ocala, FL | 3.0 | 2.0 | 1337 | $1,595 | $1.19 | 22d | 1 | 1.05mi |
| 36 Pecan Run Crse Ocala, FL | 3.0 | 2.0 | 1188 | $1,850 | $1.56 | 14d | 1 | 1.09mi |
| 5370 SE 30th Pl Unit Greenfields C Ocala, FL | 2.0 | 2.0 | 1000 | $1,150 | $1.15 | 22d | 1 | 1.10mi |
| 96 Redwood Rd Ocala, FL | 3.0 | 2.0 | 1188 | $1,650 | $1.39 | 14d | 1 | 1.18mi |
| 6001 SE 4th Pl Ocala, FL | 3.0 | 2.0 | 1865 | $2,295 | $1.23 | 14d | 1 | 1.28mi |
| 5230 SE 31st St Unit Whispering Sands D Ocala, FL | 2.0 | 1.5 | 1000 | $1,050 | $1.05 | 22d | 1 | 1.29mi |
| 5200 SE 31st St Unit D Ocala, FL | 2.0 | 1.5 | 945 | $1,250 | $1.32 | 22d | 1 | 1.31mi |
| 106 Redwood Track Crse Ocala, FL | 3.0 | 2.0 | 1412 | $1,675 | $1.19 | 14d | 1 | 1.31mi |
| 5011 SE 29th St Apt C Ocala, FL | 2.0 | 1.0 | 1000 | $990 | $0.99 | 14d | 1 | 1.35mi |
| 13 Redwood Trace Ln Ocala, FL | 3.0 | 2.0 | 1337 | $1,595 | $1.19 | 22d | 1 | 1.39mi |
| 100 SE 68th Ct Ocala, FL | 3.0 | 2.0 | 1612 | $1,850 | $1.15 | 22d | 1 | 1.44mi |
| 5725 SE 3rd Pl Ocala, FL | 3.0 | 2.0 | 1608 | $1,550 | $0.96 | 22d | 1 | 1.47mi |
| 15 NE 63rd Ct Ocala, FL | 3.0 | 2.0 | 1500 | $1,700 | $1.13 | 22d | 1 | 1.48mi |
| 6772 NE 1st St Unit Na Ocala, FL | 3.0 | 2.0 | 1300 | $1,500 | $1.15 | 14d | 1 | 1.50mi |
Listing history 19 events
-
2026-06-18days on market $279,999 Active 85 DOM
-
2026-06-17days on market $279,999 Active 84 DOM
-
2026-06-16days on market $279,999 Active 83 DOM
-
2026-06-15days on market $279,999 Active 82 DOM
-
2026-06-14days on market $279,999 Active 80 DOM
-
2026-06-13days on market $279,999 Active 79 DOM
-
2026-06-10days on market $279,999 Active 77 DOM
-
2026-06-09days on market $279,999 Active 76 DOM
-
2026-06-08days on market $279,999 Active 75 DOM
-
2026-06-07days on market $279,999 Active 74 DOM
-
2026-06-03days on market $279,999 Active 70 DOM
-
2026-06-02days on market $279,999 Active 69 DOM
-
2026-06-01days on market $279,999 Active 68 DOM
-
2026-05-31days on market $279,999 Active 67 DOM
-
2026-05-30days on market $279,999 Active 66 DOM
-
2026-03-25$279,999 Active 1146-char remark
Show marketing remark (1146 chars)
Be the first to own this beautiful new construction 3-bedroom, 2-bath home designed with comfort, style, and modern living in mind. Featuring a spacious open floor plan, this home showcases durable luxury vinyl plank (LVP) flooring in the main living areas for a sleek look and easy maintenance. The open kitchen is perfect for entertaining, offering plenty of space to gather, along with granite countertops throughout, ample cabinetry, and a seamless flow into the dining and living areas—ideal for hosting family and friends. The primary suite provides a relaxing retreat, highlighted by a trey ceiling that adds elegance and character, along with a private en-suite bathroom and generous closet space. Two additional bedrooms for family, guests, or a home office. Step outside to enjoy the covered back porch, overlooking a fully fenced backyard—perfect for pets, play, or added privacy while entertaining. A 2-car garage adds convenience and additional storage. Conveniently located near Silver Springs State Park and close to shopping, dining, and everyday amenities—offering the perfect balance of nature and convenience.
-
2024-05-06$35,000 Active
-
2015-06-18soldstatus $8,000
-
1994-06-14soldstatus $7,000
ⓘ Source: listings_history table (triggers on properties + properties_extension) + one-shot
backfill from property_details.listing_events for pre-trigger history.
Climate risk First Street
- Flood 1/10 Low FEMA zone X (unshaded) · 0% chance over 30 yrs
- Wildfire 4/10 Moderate
- Heat 8/10 Severe 7 d/yr ≥108°F today · 22 d/yr by 30 yrs out
- Wind 9/10 Extreme 99% chance of damaging wind over 30 yrs
- Air quality 4/10 Moderate 4 unhealthy d/yr today · 4 by 30 yrs out
Nearby sold comps map
Loading sold comps map…
Walkable amenities ~0.75 mi
Loading nearby amenities…
Taxation est. · year 1
- Rental income
- $20,893
- − Mortgage interest
- −$15,684
- − Property taxes
- −$4,200
- − Insurance
- −$1,400
- − Repairs & maintenance
- −$1,671
- − Management
- −$1,671
- − Depreciation
- −$8,145
- Taxable loss
- −$11,879
- Est. tax savings @ 24.0%
- +$2,851
- After-tax cash flow
- $-3,863/yr
For passive investors: Depreciation is non-cash, so a rental often shows a tax loss while cash-flowing — sheltering income. Rental losses are passive: they offset passive income freely, and up to $25,000/yr can offset ordinary (W-2) income if you actively participate and your MAGI is under $100k (phasing out to $0 by $150k); unused losses carry forward. On sale, claimed depreciation is recaptured at up to 25%, and gains may owe capital-gains tax (a 1031 exchange can defer both). Figures are a year-1 estimate at your 24.0% rate — not tax advice; consult a CPA.
Schools (NCES district)
- District
- Marion
- NCES district ID
- 1201260
- Math proficiency
- 42% ▼ -7.00%
- Reading proficiency
- 43% ▼ -4.00%
- Median HH income
- $40,015
- Composite
- 35.61/100
- National rank
- #4890
- State rank
- #61 of 73 in FL
Livability — Silver Springs Shores
- Score
- 68/100
- State rank
- #527
- US rank
- #9854
Category grades
Schools grade is shown separately in the Schools card above.
Census & demographics
- County
- Marion County · 315,796 people
- City population
- 34,665
- Metro
- Ocala, FL
- Population (ZIP)
- 35,851
- Household income
- $64,208
- Rent vs Own
- Severe rent burden
- 655.0
Population outlook (Marion County) Hauer SSP2
- Today (2025)
- 365,905 people
- By 2030
- 376,768 · +3.0%
- By 2040
- 396,555 · +8.4%
- By 2050
- 412,723 · +12.8%
- By 2075
- 446,090 · +21.9%
- By 2100
- 436,193 · +19.2%
Race, ethnicity, and origin ACS 2023
- Neighborhood character
- Diverse neighborhood (Simpson 0.65)
- Race & ethnicity
- White 50% Hispanic / Latino 25% Black 21% Two or more races 18% Asian 2%
- Hispanic origin (detail)
- Mexican 2% Puerto Rican 14% Cuban 3%
- Common ancestry
- Romanian 2% Iranian 1% Lithuanian 1%
- Foreign-born
- 11% · Canada, Jamaica, China
- Languages at home
- 78% English-only · Spanish 19% Other Indo-European 1%
Political lean MEDSL · Marion
- 2024 margin
- Solid R (+31.6) · D 33.8% · R 65.5%
- 2008→2024 swing
- -20.0pp toward R · 2008: -11.6pp · 2024: -31.6pp
- All cycles
- 2024: R+31.6 2020: R+25.9 2016: R+26.2 2012: R+16.2 2008: R+11.6
Not yet ingested
- Civics
- —
Market trends
- HPI YoY
- ▲ 5.93%
- Current HPI
- 255.0714
- Rent YoY
- ▲ 0.17%
- Metro
- Ocala, FL
- State GDP YoY
- ▲ 3.28%
- F500 in state
- 36
Industry mix (Fortune 500 HQ in FL)
| Industry | F500 HQs | Revenue |
|---|---|---|
| Industrial Technology | 2 | $29B |
|
||
| Insurance | 2 | $17B |
|
||
| Retail | 1 | $60B |
|
||
| Technology Distribution | 1 | $58B |
|
||
| Homebuilding | 1 | $35B |
|
||
| Technology Manufacturing | 1 | $35B |
|
||
Price history
+3900.0% since first listed4 events — show timeline
- 2026-03-25 Listed $279,999 Stellar MLS as Distributed by MLS Grid
- 2024-05-06 Listed $35,000 Stellar MLS as Distributed by MLS Grid
- 2015-06-18 Sold (Public Records) $8,000 Public Records
- 1994-06-14 Sold (Public Records) $7,000 Public Records
Property tax history
+9.3%/yrLatest (2025): $419 · +6.7% YoY. Source: county tax records.
Cash-flow waterfall
monthlySold comps — $/sqft
last 12 mo · ≤1 miLoading sold comps…