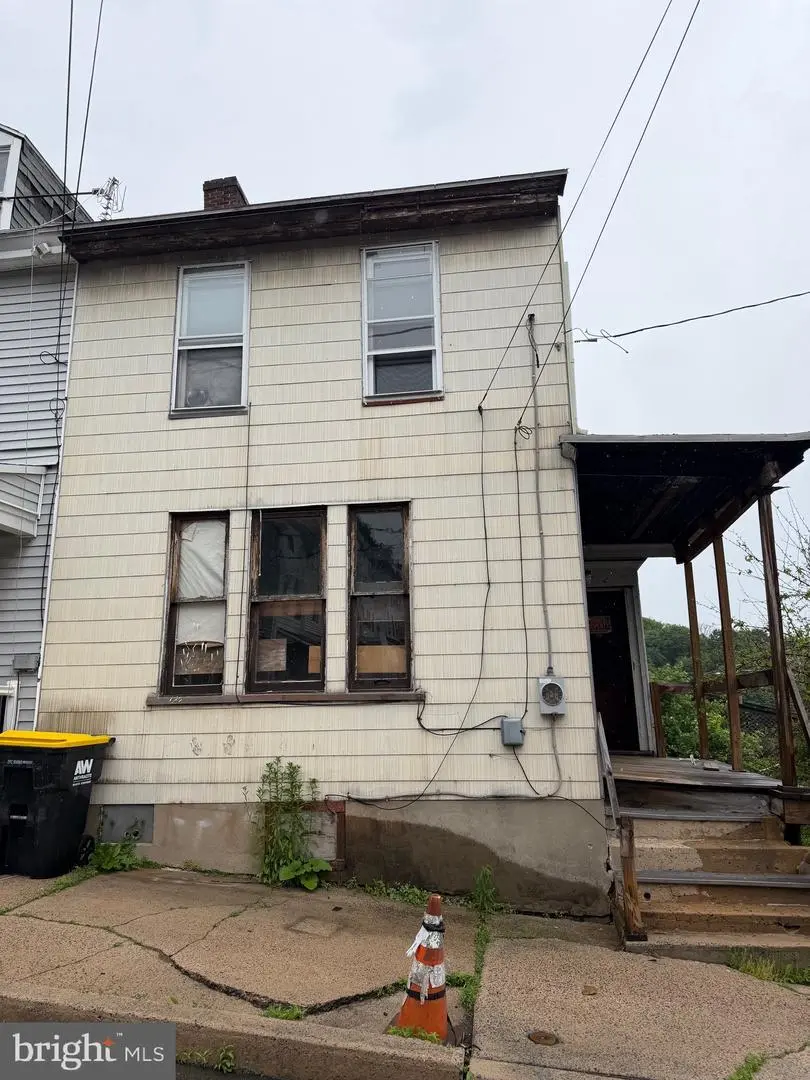
600 N 2nd St · Pottsville, PA
Flood risk 1/10 · Minimal
- FEMA flood zone
- X (unshaded)
- Chance of flooding over 30 yrs
- 0.0%
- Est. flood insurance / yr
- $473 – $860
Fire risk 2/10 · Minimal
- Est. fire insurance / yr
- $511 – $949
Heat risk 5/10 · Moderate
- Hot days now (above 96°F)
- 7 days/yr
- Hot days in 30 yrs
- 16 days/yr
Wind risk 4/10 · Minor
- Chance of severe wind over 30 yrs
- 8.0%
Air-quality risk 2/10 · Minimal
- Unhealthy air days now
- 1 days/yr
- Unhealthy air days in 30 yrs
- 1 days/yr
Risk factors via First Street. Map © Google.
Why this score? — see what drove the B+ grade
The composite is a weighted blend of 9 inputs, each scored 0–100. Each bar is that input's sub-score; the figure is the points it added to the 100-point composite (weight × sub-score).
- Cash flow +30.0/30.0
- ARV discount +14.5/15.0
- 1% rule +10.0/10.0
- DSCR +10.0/10.0
- Rent growth +3.9/5.0
- Livability +3.8/5.0
- Schools +3.1/10.0
- Condition / age +2.5/5.0
- Appreciation +0.0/10.0
$60,000
🖨 Deal sheet 📄 Offer letter ✓ Due diligence
Listing remarks MLS
Rehab with TONS of potential, can be up to 6 bedroom home. New gas line being installed by UGI for gas heat Needs renovation Possible rent $1200-$1300/mo after. Rehab has started - price will increase as repairs are made.
Key facts
- Built 1900
- Listed 13 days
Property features AI
Exterior
- Utilities: Public water; Public sewer
- Home design: End-of-row townhouse; Ownership is fee simple; Year built estimated
- Construction: Concrete perimeter foundation; Above-grade and below-grade structures noted
- Exterior features: Not in a federal flood zone; Lot dimensions approximately 25 x 99 (per assessor)
Interior
- Bedrooms: Three bedrooms on the first upper level
- Bathrooms: One full bathroom
- Interior features: No basement; Finished area measurements per assessor
Neighborhood map
What this means for you Summary
Snapshot
- This is a 2-bed/1.0-bath townhouse listed at $60k.
Deal economics
- At list price, monthly cash flow is $574 ($7k/yr) — positive.
- The deal already cash-flows at list — no discount required.
- Meets the 1% rule at list price ($1k rent vs $60k).
- Cap rate 17.8% vs local median 6.1% in Pottsville — top-decile yield for the area; either an underpriced asset or a hidden risk that comps aren't pricing in. Stress-test before assuming the spread holds.
Location & tenants
- Location reads 75/100 on livability (#442 in PA, #4,025 nationally) — a middle-class / working-renter tenant base. Strengths: amenities A+, cost of living A+, housing A+; Watch: commute F, employment F.
- Pottsville Area SD (town): math 29% / reading 46% proficiency, ranked #395 of 539 in PA (top 73%) — families likely to look elsewhere, expect single-tenant / working-renter base with shorter leases.
- Market conditions: Rents rising fast (+5.7%/yr); 177 active listings in the ZIP; 7 comparable units currently listed for rent nearby; rentals lingering (median 44d on market — plan ~5-8 weeks vacancy on turnover, expect pricing pressure); 100% of comp listings sitting > 30 days — soft ceiling on asking rent; 169 units permitted in Schuylkill County in 2024 (0 in 5+ unit buildings).
Forward outlook
- Local home prices are declining (-3.0%/yr); year-one equity from $415 of loan paydown is wiped out by about $2k of value loss. Plan a longer hold.
- Schuylkill County population projected at -16% by 2050 — secular population decline; favor cash flow + early exit over multi-decade hold.
- At projected returns (-3.0% appreciation + 5.7% rent growth), your $17k cash investment doubles in ~3 years — after that, you're playing with house money.
Negotiation context
- Only 14 days on market — expect competitive offers; lowballing is unlikely to land.
- 5 sale attempts since 16y ago with the ask held roughly flat each time — persistent listings suggest the price (not the market) is what's stuck; bring a comps-based counter.
- Current owner paid $32k; list at $60k implies a 88% gain — meaningful room to come down on a strong offer.
Risks & watch-outs
- Watch-outs: built in 1900 — expect roof / HVAC / electrical / plumbing capex.
- Climate carrying-cost: extreme-heat days projected 7→16/yr by 2055 (HVAC capex compounding) — expect insurance premiums to compound above CPI over the hold.
Questions for the listing agent
- Built in 1900 — when were the roof, HVAC, electrical panel, plumbing, and water heater last replaced?
- Is there a deadline driving the sale (1031 exchange, divorce, estate, relocation)? That informs how much negotiation room exists.
- Schools are B-rated — typically a magnet for longer-tenancy family renters. What's the average tenant stay here, and is there a school-zone premium baked into asking?
- What's the average days-on-market for RENTAL listings here right now (not sales)? A rising rental-DOM trend means longer vacancies and softer asking-rent achievability than the comps imply.
- What's the recent tenant-quality profile in this submarket — average credit score on applications, eviction rate, late-payment / NSF rate, and stable-employment percentage? A property-management company in the area should have these aggregated.
- How much new for-sale + rental construction is in the pipeline within 1–3 miles? Heavy new supply typically softens prices + rents 12–24 months out; constrained supply supports both.
Investment metrics
- 1% rule
- 2.08% ✓
- Cap rate
- 17.76%
- Cash-on-cash
- 40.97%
- DSCR
- 2.82
- GRM
- 4.0
CMA / ARV
- ARV (on-the-fly)
- $70,980
- Comps found
- 12
Show comp detail 12 sales within ~0.75 mi
| Address | Dist | Beds/Ba | Sqft | Sold | Price | $/sf | Match |
|---|---|---|---|---|---|---|---|
| 315 Morgan Ave | 0.14mi | 3/1.0 (+1) | 1,152 (-3%) | 9mo | $90,000 | $78 | 77 |
| 606-604 Fairview St | 0.25mi | 3/1.0 (+1) | 1,137 (-4%) | 1mo | $105,000 | $92 | 76 |
| 611 Fairview St | 0.25mi | 3/1.0 (+1) | 1,300 (+10%) | 2mo | $45,000 | $35 | 66 |
| 607 E Market St | 0.53mi | 2/1.0 | 1,240 (+5%) | 6mo | $85,000 | $69 | 62 |
| 6 N 12th St | 0.63mi | 2/1.0 | 1,224 (+4%) | 4mo | $55,000 | $45 | 62 |
| 8 N Wolfe St | 0.51mi | 3/1.0 (+1) | 1,260 (+6%) | 2mo | $150,000 | $119 | 59 |
| 513 W Arch St | 0.32mi | 3/1.0 (+1) | 1,308 (+11%) | 6mo | $57,000 | $44 | 57 |
| 608 Fairview St | 0.25mi | 3/1.0 (+1) | 1,005 (-15%) | 4mo | $90,000 | $90 | 55 |
| 515 W Arch St | 0.33mi | 3/1.0 (+1) | 1,344 (+14%) | 5mo | $80,000 | $60 | 53 |
| 248 N 12th St | 0.53mi | 2/1.0 | 1,320 (+12%) | 8mo | $78,000 | $59 | 50 |
| 350 North St | 0.51mi | 3/1.0 (+1) | 1,308 (+11%) | 6mo | $38,500 | $29 | 49 |
| 315 Schuylkill Ave | 0.49mi | 3/2.5 (+1) | 1,008 (-15%) | 6mo | $60,000 | $60 | 36 |
Match score weights: distance 35% · size 25% · config 20% · recency 20%. Top-matched comps best support the ARV.
Projected returns pro-forma
-3.0% appreciation · 5.7% rent growth · sell at horizon
- IRR
- 40.5%
- Equity multiple
- 2.80×
- Total profit
- $30,317
- Equity at exit
- $8,946
- IRR
- 48.1%
- Equity multiple
- 6.28×
- Total profit
- $88,653
- Equity at exit
- $5,188
Cash invested: $16,800 (down + closing). Projections, not guarantees.
Landlord ↔ Tenant lean methodology
- Overall (STATE)
- 62 Landlord-Friendly
- State Pennsylvania
- 62 Landlord-Friendly · EVEN
- County
- — inherits STATE
- City
- — inherits STATE
ZIP-level market 17901
- Home prices YoY
- -21.2%
- Rents YoY
- 5.7%
- Active inventory
- 177
- Price-to-rent
- 4.0×
Monthly cashflow live
- Estimated rent
- $1,251 high interval (Pro) →
- Mortgage (P&I)
- −$315
- Tax est. 1.5%
- −$75 /mo · $900/yr
- Insurance
- −$25
- HOA
- −$0
- Vacancy / Maint / Mgmt
- −$263
- Net cashflow
- $574
Break-even live
UW: 25.0% down · 7.5% · 30yr · 1.5% tax · 5.0% vac · 8.0% maint · 8.0% mgmt
Financing live
Cash to close
- Down payment
- $15,000
- Closing costs
- $1,800
- Reserves months
- —
- Total cash needed
- —
Loan-product check · same deal, 3 products live
Conventional
25% down · 7.5% · 30yr
- Down + closing
- —
- Monthly P&I
- —
- Monthly cashflow
- —
- DSCR
- —
- Eligible?
- —
Personal DTI + credit; lowest rate.
DSCR
20% down · 8.5% · 30yr
- Down + closing
- —
- Monthly P&I
- —
- Monthly cashflow
- —
- DSCR
- —
- Eligible?
- —
No personal income docs; deal must DSCR.
Hard money
10% down · 12.0% · 12mo
- Down + closing
- —
- Monthly P&I
- —
- Monthly cashflow
- —
- DSCR
- —
- Eligible?
- —
Short-term bridge; refi at stabilization.
Rent comps 7 comps
| Address | Beds | Baths | Sqft | Rent | $/sqft | DOM | Units | Dist |
|---|---|---|---|---|---|---|---|---|
| 210 Harrison St Pottsville, PA | 3.0 | 1.0 | 1078 | $1,200 | $1.11 | 43d | 1 | 0.01mi |
| 631 W Race St Pottsville, PA | 3.0 | 1.0 | 1340 | $1,200 | $0.90 | 43d | 1 | 0.33mi |
| 536 E Arch St Pottsville, PA | 2.0 | 1.0 | 1360 | $975 | $0.72 | 43d | 1 | 0.44mi |
| 426 Adams St Pottsville, PA | 3.0 | 1.0 | 1104 | $1,350 | $1.22 | 43d | 1 | 0.45mi |
| 8 N Wolfe St Pottsville, PA | 3.0 | 1.0 | 1260 | $1,795 | $1.42 | 43d | 1 | 0.54mi |
| 909 Mahantongo St Unit 1 Pottsville, PA | 2.0 | 1.0 | 1100 | $1,200 | $1.09 | 43d | 1 | 0.57mi |
| 119 S 11th St Pottsville, PA | 3.0 | 1.5 | 1140 | $1,450 | $1.27 | 43d | 1 | 0.64mi |
Listing history 12 events
-
2026-06-19days on market $60,000 Active 14 DOM
-
2026-06-18days on market $60,000 Active 13 DOM
-
2026-06-17days on market $60,000 Active 12 DOM
-
2026-06-16days on market $60,000 Active 11 DOM
-
2026-06-15days on market $60,000 Active 10 DOM
-
2026-06-14days on market $60,000 Active 8 DOM
-
2026-06-12days on market $60,000 Active 7 DOM
-
2026-06-09days on market $60,000 Active 4 DOM
-
2026-06-08days on market $60,000 Active 3 DOM
-
2026-06-07days on market $60,000 Active 2 DOM
-
2026-06-07remarks 699-char remark
-
2026-06-07$60,000 Active 1 DOM
ⓘ Source: listings_history table (triggers on properties + properties_extension) + one-shot
backfill from property_details.listing_events for pre-trigger history.
Climate risk First Street
- Flood 1/10 Low FEMA zone X (unshaded) · 0% chance over 30 yrs
- Wildfire 2/10 Low
- Heat 5/10 Major 7 d/yr ≥96°F today · 16 d/yr by 30 yrs out
- Wind 4/10 Moderate 8% chance of damaging wind over 30 yrs
- Air quality 2/10 Low 1 unhealthy d/yr today · 1 by 30 yrs out
Nearby sold comps map
Loading sold comps map…
Walkable amenities ~0.75 mi
Loading nearby amenities…
Taxation est. · year 1
- Rental income
- $15,011
- − Mortgage interest
- −$3,361
- − Property taxes
- −$900
- − Insurance
- −$300
- − Repairs & maintenance
- −$1,201
- − Management
- −$1,201
- − Depreciation
- −$1,745
- Taxable income
- $6,303
- Est. tax owed @ 24.0%
- −$1,513
- After-tax cash flow
- $5,370/yr
For passive investors: Depreciation is non-cash, so a rental often shows a tax loss while cash-flowing — sheltering income. Rental losses are passive: they offset passive income freely, and up to $25,000/yr can offset ordinary (W-2) income if you actively participate and your MAGI is under $100k (phasing out to $0 by $150k); unused losses carry forward. On sale, claimed depreciation is recaptured at up to 25%, and gains may owe capital-gains tax (a 1031 exchange can defer both). Figures are a year-1 estimate at your 24.0% rate — not tax advice; consult a CPA.
Schools (NCES district)
- District
- Pottsville Area SD
- NCES district ID
- 4219710
- Math proficiency
- 29% ▼ -14.00%
- Reading proficiency
- 46% ▼ -12.00%
- Median HH income
- $39,157
- Composite
- 31.32/100
- National rank
- #6002
- State rank
- #395 of 539 in PA
Livability — Pottsville
- Score
- 75/100
- State rank
- #442
- US rank
- #4025
Category grades
Schools grade is shown separately in the Schools card above.
Census & demographics
- Census place
- Pottsville, PA
- County
- Schuylkill County · 22,371 people
- City population
- 22,371
- Metro
- Pottsville, PA
- Population (ZIP)
- 22,371
- Household income
- $62,484
- Rent vs Own
- Severe rent burden
- 622.0
Population outlook (Schuylkill County) Hauer SSP2
- Today (2025)
- 137,447 people
- By 2030
- 133,121 · -3.1%
- By 2040
- 124,172 · -9.7%
- By 2050
- 115,611 · -15.9%
- By 2075
- 100,796 · -26.7%
- By 2100
- 86,667 · -36.9%
Race, ethnicity, and origin ACS 2023
- Neighborhood character
- Predominantly White (90%)
- Race & ethnicity
- White 90% Hispanic / Latino 5% Two or more races 3% Black 2%
- Common ancestry
- Romanian 9% Iranian 5% Subsaharan African 3%
- Foreign-born
- 1% · Canada
- Languages at home
- 96% English-only · Spanish 2% German/W. Germanic 1% French/Haitian/Cajun 1%
Political lean MEDSL · Schuylkill
- 2024 margin
- Solid R (+42.1) · D 28.5% · R 70.6%
- 2008→2024 swing
- -33.4pp toward R · 2008: -8.7pp · 2024: -42.1pp
- All cycles
- 2024: R+42.1 2020: R+39.9 2016: R+43.4 2012: R+13.4 2008: R+8.7
Not yet ingested
- Civics
- —
Market trends
- HPI YoY
- ▼ -54.14%
- Current HPI
- 200.6516
- Rent YoY
- ▲ 5.70%
- Metro
- Pottsville, PA
- State GDP YoY
- ▲ 1.68%
- F500 in state
- 34
Industry mix (Fortune 500 HQ in PA)
| Industry | F500 HQs | Revenue |
|---|---|---|
| Healthcare | 2 | $309B |
|
||
| Insurance | 2 | $27B |
|
||
| Telecommunications / Media | 1 | $124B |
|
||
| Industrial Distribution | 1 | $22B |
|
||
| Financial Services | 1 | $20B |
|
||
| Chemicals / Materials | 1 | $18B |
|
||
Price history
+700.0% since first listed16 events — show timeline
- 2026-06-06 Listed $60,000 BRIGHT MLS
- 2026-06-04 Coming Soon $60,000 BRIGHT MLS
- 2024-07-13 Listing Removed — BRIGHT MLS
- 2024-07-12 Listed $225,000 BRIGHT MLS
- 2022-06-10 Sold (MLS) $31,963 BRIGHT MLS
- 2022-05-04 Contingent — BRIGHT MLS
- 2022-04-15 Price Changed $34,939 BRIGHT MLS
- 2022-04-07 Price Changed $31,939 BRIGHT MLS
- 2022-03-14 Price Changed $32,963 BRIGHT MLS
- 2022-02-26 Listed $34,900 BRIGHT MLS
- 2022-02-09 Sold (Public Records) $8,500 Public Records
- 2018-09-05 Listing Removed — BRIGHT MLS
- 2018-03-08 Listed $9,900 BRIGHT MLS
- 2010-08-19 Listing Removed — BRIGHT MLS
- 2010-08-19 Listed $15,000 BRIGHT MLS
- 2003-01-16 Sold (Public Records) $7,500 Public Records
Property tax history
+20.1%/yrLatest (2026): $3,045 · +453.9% YoY. Source: county tax records.
Cash-flow waterfall
monthlySold comps — $/sqft
last 12 mo · ≤1 miLoading sold comps…