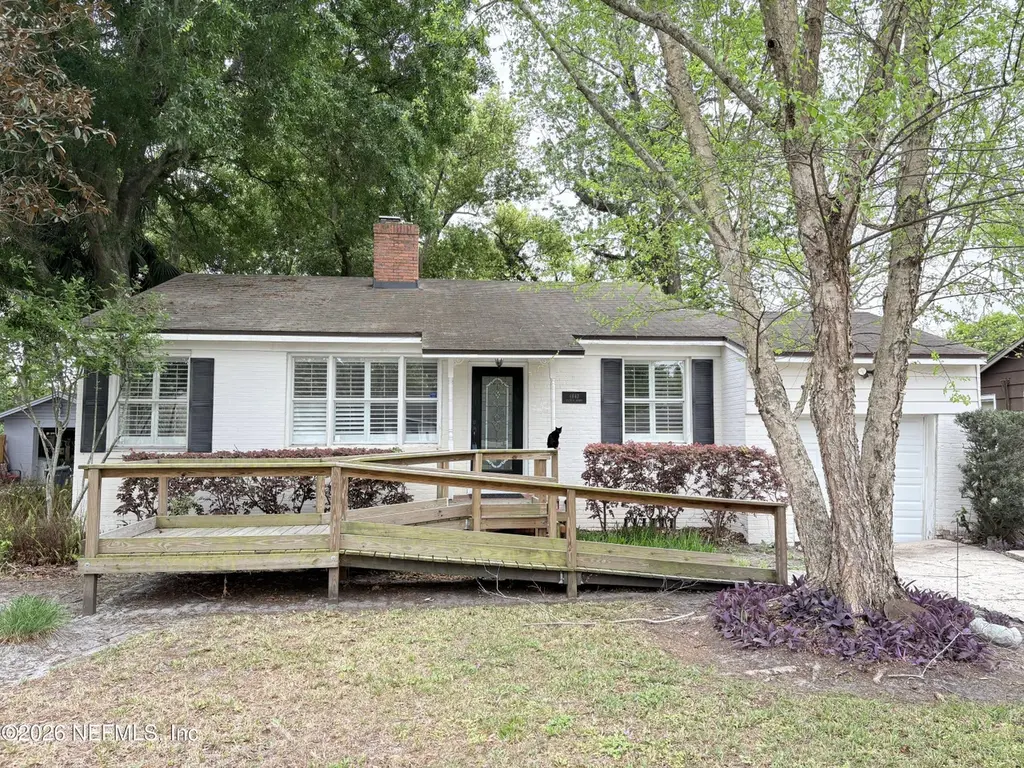
4840 Colonial Ave · Jacksonville, FL
Flood risk 6/10 · Moderate
- FEMA flood zone
- X (unshaded)
- Chance of flooding over 30 yrs
- 0.51%
- Est. flood insurance / yr
- $507 – $1,088
Fire risk 1/10 · Minimal
- Est. fire insurance / yr
- $947 – $1,759
Heat risk 8/10 · Major
- Hot days now (above 107°F)
- 7 days/yr
- Hot days in 30 yrs
- 20 days/yr
Wind risk 9/10 · Severe
- Chance of severe wind over 30 yrs
- 99.0%
Air-quality risk 5/10 · Moderate
- Unhealthy air days now
- 7 days/yr
- Unhealthy air days in 30 yrs
- 7 days/yr
Risk factors via First Street. Map © Google.
Why this score? — see what drove the B- grade
The composite is a weighted blend of 9 inputs, each scored 0–100. Each bar is that input's sub-score; the figure is the points it added to the 100-point composite (weight × sub-score).
- Cash flow +24.6/30.0
- ARV discount +15.0/15.0
- DSCR +7.9/10.0
- 1% rule +5.4/10.0
- Livability +4.2/5.0
- Schools +3.9/10.0
- Rent growth +3.0/5.0
- Condition / age +2.5/5.0
- Appreciation +0.0/10.0
$160,000
🖨 Deal sheet 📄 Offer letter ✓ Due diligence
Listing remarks
Located in the established Lakeshore area of Jacksonville's Westside, this 3-bedroom, 1-bath home offers a strong opportunity for investors, renovators, or buyers looking to add value and make it their own. Set on a spacious, tree-lined lot, the property provides a peaceful setting with room to enhance both indoor and outdoor living. The home features a functional layout with a large living area with fireplace, original hardwood flooring, and a generously sized kitchen complete with granite countertops, custom cabinetry, and stainless steel appliances. A rear deck adds additional potential for outdoor enjoyment and entertaining. While updates are needed, the property offers solid fundamenta
Key facts
- Custom cabinetry
- Large living area
- Granite countertops
Tags
Property features AI
Finance
- HOA & community: Not a senior community
Exterior
- Parking: Garage; Additional parking; 1-car garage
- Utilities: Electricity available; Water available
- Home design: Single family residence; One story; Entry level: 1; North-facing
- Construction: Shingle roof
- Exterior features: Deck; Fenced yard
Interior
- Kitchen: Dishwasher; Electric oven; Electric range; Refrigerator
- Bedrooms: 3 bedrooms
- Flooring: Tile
- Bathrooms: 1 full bathroom
- Heating & cooling: Central heating; Central air conditioning
- Interior features: Wood-burning fireplace; Tile flooring; Unfurnished
- Laundry & utility: In-unit laundry
Neighborhood map
What this means for you Summary
Snapshot
- This is a 3-bed/1.0-bath single-family listed at $160k.
Deal economics
- At list price, monthly cash flow is $331 ($4k/yr) — positive.
- The deal already cash-flows at list — no discount required.
- Meets the 1% rule at list price ($2k rent vs $160k).
- Recommended offer: $150k (6.0% below list) — sets the bar for market timing.
- Cap rate 8.8% vs local median 4.0% in Jacksonville — top-decile yield for the area; either an underpriced asset or a hidden risk that comps aren't pricing in. Stress-test before assuming the spread holds.
Location & tenants
- Location reads 83/100 on livability (#50 in FL, #911 nationally) — a professional / high-income tenant draw. Strengths: amenities A+, commute A+, housing A+.
- Duval (urban): math 46% / reading 45% proficiency, ranked #48 of 73 in FL (top 66%) — families likely to look elsewhere, expect single-tenant / working-renter base with shorter leases.
- Zoned schools: Bayview Elementary School (math 42% / reading 32%, grade F, #1,609 of 2,144 statewide, top 77%, 330 students, 74% FRL); Lake Shore Middle School (math 25% / reading 22%, grade F, #536 of 571 statewide, top 95%, 972 students, 75% FRL); Riverside High School (math 24% / reading 39%, grade F, #424 of 667 statewide, top 64%, 1,567 students, 60% FRL) — zoned schools average 70% FRL vs 49% district-wide (21 pts higher); higher-poverty schools than district average — tighter screening recommended.
- Zoned-school proficiency averages 31% at this address vs 46% district-wide (-15 pts) — the specific schools serving this property underperform the Duval average; the district grade overstates school quality for this exact location.
- Market conditions: Rents rising (+2.1%/yr); 441 active listings in the ZIP; 40 comparable units currently listed for rent nearby; rentals at typical pace (median 14d on market — plan ~3-4 weeks tenant-placement turnaround); 6,503 units permitted in Duval County in 2024 (1,131 in 5+ unit buildings).
- This rent runs 33% of the median local income ($61k/yr) — at the standard rent-burdened threshold; future hikes will face affordability resistance.
Forward outlook
- Local home prices are declining (-3.0%/yr); year-one equity from $1k of loan paydown is wiped out by about $5k of value loss. Plan a longer hold.
- Duval County population projected at +19% by 2050 — long-run rental-demand tailwind backs the buy-and-hold thesis.
Negotiation context
- It's been on market 87 days — a 6% lower offer ($150k) is reasonable based on typical stale-listing flexibility.
- 3 sale attempts; this cycle's ask has dropped $9k (5%) from the opening price — seller is motivated, your offer sets the floor, not the list.
Risks & watch-outs
- Watch-outs: built in 1941 — expect roof / HVAC / electrical / plumbing capex.
- Climate carrying-cost: major flood risk; severe wind risk, 99% chance of damaging wind over 30y; extreme-heat days projected 7→20/yr by 2055 (HVAC capex compounding) — expect insurance premiums to compound above CPI over the hold.
Questions for the listing agent
- It's been on market 87 days. Have you received any prior offers? Is the seller open to a 6% concession, seller financing, or rate buy-down credit?
- Built in 1941 — when were the roof, HVAC, electrical panel, plumbing, and water heater last replaced?
- Why hasn't it sold? Are there any deal-killer items the seller is aware of (foundation, flood, title, zoning, code violations)?
- Is there a deadline driving the sale (1031 exchange, divorce, estate, relocation)? That informs how much negotiation room exists.
- Schools are B-rated — typically a magnet for longer-tenancy family renters. What's the average tenant stay here, and is there a school-zone premium baked into asking?
- What's the average days-on-market for RENTAL listings here right now (not sales)? A rising rental-DOM trend means longer vacancies and softer asking-rent achievability than the comps imply.
- What's the recent tenant-quality profile in this submarket — average credit score on applications, eviction rate, late-payment / NSF rate, and stable-employment percentage? A property-management company in the area should have these aggregated.
- How much new for-sale + rental construction is in the pipeline within 1–3 miles? Heavy new supply typically softens prices + rents 12–24 months out; constrained supply supports both.
Investment metrics
- 1% rule
- 1.04% ✓
- Cap rate
- 8.77%
- Cash-on-cash
- 8.86%
- DSCR
- 1.39
- GRM
- 8.0
CMA / ARV
- ARV (on-the-fly)
- $221,725
- Comps found
- 12
Show comp detail 12 sales within ~0.75 mi
| Address | Dist | Beds/Ba | Sqft | Sold | Price | $/sf | Match |
|---|---|---|---|---|---|---|---|
| 4615 Sunderland Rd | 0.31mi | 3/1.0 | 1,222 (-0%) | 1mo | $219,000 | $179 | 84 |
| 2211 Bayview Rd | 0.24mi | 3/2.0 | 1,269 (+4%) | 1mo | $125,000 | $99 | 78 |
| 4756 Shirley Ave | 0.33mi | 3/2.0 | 1,232 (+1%) | 2mo | $229,900 | $187 | 78 |
| 5321 Fremont St | 0.48mi | 3/1.0 | 1,166 (-5%) | 1mo | $231,000 | $198 | 69 |
| 5044 Colonial Ave | 0.15mi | 3/2.0 | 1,366 (+12%) | 2mo | $250,000 | $183 | 68 |
| 4819 Irvington Ave | 0.41mi | 3/2.0 | 1,144 (-7%) | 1mo | $197,500 | $173 | 65 |
| 4567 Palmer Ave | 0.43mi | 3/1.0 | 1,114 (-9%) | 1mo | $159,000 | $143 | 64 |
| 4609 Cambridge Rd | 0.43mi | 4/2.0 (+1) | 1,270 (+4%) | 1mo | $130,000 | $102 | 64 |
| 4649 Cambridge Rd | 0.38mi | 2/1.0 (-1) | 1,118 (-9%) | 0mo | $235,000 | $210 | 62 |
| 4417 San Juan Ave | 0.70mi | 3/1.0 | 1,288 (+5%) | 3mo | $320,000 | $248 | 56 |
| 5103 Camille Ave | 0.53mi | 3/1.0 | 1,092 (-11%) | 2mo | $114,000 | $104 | 55 |
| 2811 Lake Shore Blvd | 0.70mi | 3/2.0 | 1,363 (+11%) | 4mo | $247,000 | $181 | 42 |
Match score weights: distance 35% · size 25% · config 20% · recency 20%. Top-matched comps best support the ARV.
Projected returns pro-forma
-3.0% appreciation · 2.11% rent growth · sell at horizon
- IRR
- -3.8%
- Equity multiple
- 0.86×
- Total profit
- $-6,376
- Equity at exit
- $23,857
- IRR
- 4.9%
- Equity multiple
- 1.34×
- Total profit
- $15,432
- Equity at exit
- $13,834
Cash invested: $44,800 (down + closing). Projections, not guarantees.
Landlord ↔ Tenant lean methodology
- Overall (STATE)
- 87 Strongly Landlord-Friendly
- State Florida
- 87 Strongly Landlord-Friendly · R+3
- County
- — inherits STATE
- City
- — inherits STATE
ZIP-level market 32210
- Rents YoY
- 2.1%
- Active inventory
- 441
- Price-to-rent
- 8.0×
Monthly cashflow live
- Estimated rent
- $1,664 high interval (Pro) →
- Mortgage (P&I)
- −$839
- Tax from tax record
- −$78 /mo · $938/yr
- Insurance
- −$67
- HOA
- −$0
- Vacancy / Maint / Mgmt
- −$350
- Net cashflow
- $331
Break-even live
UW: 25.0% down · 7.5% · 30yr · 1.5% tax · 5.0% vac · 8.0% maint · 8.0% mgmt
Financing live
Cash to close
- Down payment
- $40,000
- Closing costs
- $4,800
- Reserves months
- —
- Total cash needed
- —
Loan-product check · same deal, 3 products live
Conventional
25% down · 7.5% · 30yr
- Down + closing
- —
- Monthly P&I
- —
- Monthly cashflow
- —
- DSCR
- —
- Eligible?
- —
Personal DTI + credit; lowest rate.
DSCR
20% down · 8.5% · 30yr
- Down + closing
- —
- Monthly P&I
- —
- Monthly cashflow
- —
- DSCR
- —
- Eligible?
- —
No personal income docs; deal must DSCR.
Hard money
10% down · 12.0% · 12mo
- Down + closing
- —
- Monthly P&I
- —
- Monthly cashflow
- —
- DSCR
- —
- Eligible?
- —
Short-term bridge; refi at stabilization.
Rent comps 40 comps
| Address | Beds | Baths | Sqft | Rent | $/sqft | DOM | Units | Dist |
|---|---|---|---|---|---|---|---|---|
| 4614 Birkenhead Rd Jacksonville, FL | 3.0 | 2.0 | 1248 | $1,700 | $1.36 | 14d | 1 | 0.35mi |
| 5215 San Juan Ave Jacksonville, FL | 2.0 | 1.0 | 750 | $1,075 | $1.43 | 7d | 1 | 0.38mi |
| 5140 Janice Cir S Jacksonville, FL | 3.0 | 1.0 | 1215 | $1,335 | $1.10 | 21d | 1 | 0.48mi |
| 3434 Blanding Blvd Jacksonville, FL | 2.0–3.0 | 2.0 | 1101 | $1,800 | $1.63 | 3d | 2 | 0.48mi |
| 3434 Blanding Blvd #201 Jacksonville, FL | 3.0 | 2.0 | 1253 | $1,800 | $1.44 | 17d | 1 | 0.49mi |
| 4776 Cardinal Blvd Jacksonville, FL | 3.0 | 1.0 | 959 | $1,550 | $1.62 | 24d | 1 | 0.53mi |
| 5139 Camille Ave Jacksonville, FL | 3.0 | 2.0 | 1100 | $1,625 | $1.48 | 2d | 1 | 0.57mi |
| 1626 Stimson St Jacksonville, FL | 3.0 | 2.5 | 1368 | $1,641 | $1.20 | 21d | 1 | 0.74mi |
| 4844 Merrimac Ave Jacksonville, FL | 2.0 | 1.0 | 820 | $1,325 | $1.62 | 24d | 1 | 0.76mi |
| 4610 Cedarwood Rd Jacksonville, FL | 3.0 | 1.0 | 1381 | $1,950 | $1.41 | 17d | 1 | 0.77mi |
| 5615 San Juan Ave #208 Jacksonville, FL | 2.0 | 2.0 | 1115 | $1,200 | $1.08 | 24d | 1 | 0.77mi |
| 2039 Niblick Dr Jacksonville, FL | 1.0–2.0 | 1.0–2.0 | 847 | $1,275 | $1.51 | 3d | 10 | 0.79mi |
| 6026 Wilson Blvd Jacksonville, FL | 4.0 | 3.0 | 1380 | $700 | $0.51 | 24d | 1 | 0.84mi |
| 4608 Wheeler Ave Jacksonville, FL | 3.0 | 1.0 | 1025 | $2,000 | $1.95 | 24d | 1 | 0.88mi |
| 5821 San Juan Ave Jacksonville, FL | 1.0–3.0 | 1.0–2.0 | 1056 | $1,330 | $1.26 | 3d | 7 | 0.88mi |
| 6066 Wilson Blvd Jacksonville, FL | 3.0 | 3.0 | 1097 | $1,800 | $1.64 | 24d | 1 | 0.90mi |
| 6119 Wilson Blvd Jacksonville, FL | 4.0 | 2.0 | 1302 | $1,395 | $1.07 | 24d | 1 | 0.90mi |
| 4523 Merrimac Ave Jacksonville, FL | 4.0 | 2.0 | 1425 | $1,544 | $1.08 | 3d | 1 | 0.93mi |
| 1480 Stimson St Jacksonville, FL | 3.0 | 1.0 | 1252 | $1,445 | $1.15 | 14d | 1 | 0.99mi |
| 4301 Confederate Point Rd Jacksonville, FL | 3.0 | 1.0–2.0 | 1042 | $1,606 | $1.54 | 3d | 39 | 0.99mi |
| 1540 Lake Shore Blvd Jacksonville, FL | 3.0 | 2.0 | 1180 | $1,495 | $1.27 | 7d | 1 | 1.06mi |
| 4375 Confederate Point Rd Jacksonville, FL | 1.0–3.0 | 1.0–2.5 | 1125 | $1,536 | $1.37 | 3d | 22 | 1.08mi |
| 3607 Colebrooke Dr Jacksonville, FL | 3.0 | 2.0 | 1360 | $1,590 | $1.17 | 3d | 1 | 1.11mi |
| 5256 Clarendon Rd Jacksonville, FL | 3.0 | 2.0 | 1278 | $2,100 | $1.64 | 24d | 1 | 1.16mi |
| 1554 Geraldine Dr Jacksonville, FL | 3.0 | 2.0 | 1362 | $2,850 | $2.09 | 7d | 1 | 1.16mi |
| 4020 Angol Pl Jacksonville, FL | 3.0 | 1.0 | 1266 | $1,845 | $1.46 | 17d | 1 | 1.17mi |
| 5120 Quan Dr Jacksonville, FL | 3.0 | 1.0 | 1454 | $1,250 | $0.86 | 2d | 1 | 1.18mi |
| 4102 Angol Pl Jacksonville, FL | 3.0 | 2.0 | 1470 | $1,650 | $1.12 | 4d | 1 | 1.19mi |
| 4455 Confederate Point Rd Jacksonville, FL | 1.0–3.0 | 1.0–2.5 | 1045 | $1,599 | $1.53 | 2d | 19 | 1.20mi |
| 1650 Parrish Pl Jacksonville, FL | 3.0 | 1.0 | 1387 | $2,100 | $1.51 | 24d | 1 | 1.21mi |
| 4343 Ortega Farms Cir Unit A Jacksonville, FL | 2.0 | 1.0 | 800 | $1,950 | $2.44 | 24d | 1 | 1.22mi |
| 1374 Murray Dr Jacksonville, FL | 3.0 | 2.0 | 1338 | $1,950 | $1.46 | 12d | 1 | 1.27mi |
| 6511 San Juan Ave Jacksonville, FL | 2.0 | 2.0 | 740 | $1,200 | $1.62 | 4d | 1 | 1.27mi |
| 3668 Jammes Rd Jacksonville, FL | 3.0 | 2.0 | 1227 | $1,540 | $1.26 | 4d | 1 | 1.28mi |
| 5351 Royce Ave Jacksonville, FL | 3.0 | 1.0 | 1040 | $1,600 | $1.54 | 24d | 1 | 1.33mi |
| 1374 Lake Shore Blvd Jacksonville, FL | 4.0 | 2.0 | 1456 | $2,150 | $1.48 | 7d | 2 | 1.34mi |
| 5377 Royce Ave Jacksonville, FL | 3.0 | 1.0 | 1040 | $1,800 | $1.73 | 17d | 1 | 1.35mi |
| 6236 Autlan Dr Jacksonville, FL | 3.0 | 2.0 | 1299 | $1,555 | $1.20 | 4d | 1 | 1.38mi |
| 6595 San Juan Ave Jacksonville, FL | 1.0–2.0 | 1.0 | 846 | $1,250 | $1.48 | 19d | 4 | 1.38mi |
| 3946 Saint Johns Ave Jacksonville, FL | 1.0–2.0 | 1.0–2.0 | 900 | $2,486 | $2.76 | 2d | 18 | 1.39mi |
Listing history 21 events
-
2026-06-18days on market $160,000 Active 87 DOM
-
2026-06-17days on market $160,000 Active 86 DOM
-
2026-06-16days on market $160,000 Active 85 DOM
-
2026-06-15days on market $160,000 Active 84 DOM
-
2026-06-13days on market $160,000 Active 81 DOM
-
2026-06-10pricedays on market $160,000 Active 78 DOM
-
2026-06-08days on market $165,000 Active 77 DOM
-
2026-06-07days on market $165,000 Active 76 DOM
-
2026-06-03days on market $165,000 Active 72 DOM
-
2026-06-02days on market $165,000 Active 71 DOM
-
2026-06-01days on market $165,000 Active 70 DOM
-
2026-05-31days on market $165,000 Active 69 DOM
-
2026-05-12status Active
-
2026-04-30historical Active Under Contract
-
2026-04-13status Active
-
2026-04-13price $165,000
-
2026-04-09historical Active Under Contract
-
2026-03-23$169,000 Active
-
2006-05-05soldstatus $141,500
-
1997-11-06soldstatus $63,000
-
1997-09-22soldstatus $37,900
ⓘ Source: listings_history table (triggers on properties + properties_extension) + one-shot
backfill from property_details.listing_events for pre-trigger history.
Tax reassessment forecast FL · Resets to sale price
- Current annual tax
- $938 · $78/mo
- Projected year-2 tax
- $1,328 · $111/mo
- Expected delta
- +$390/yr (+$33/mo · 41.6%)
ⓘ Screening estimate from a state-policy table — verify with the county assessor before closing.
Climate risk First Street
- Flood 6/10 Major FEMA zone X (unshaded) · 51% chance over 30 yrs
- Wildfire 1/10 Low
- Heat 8/10 Severe 7 d/yr ≥107°F today · 20 d/yr by 30 yrs out
- Wind 9/10 Extreme 99% chance of damaging wind over 30 yrs
- Air quality 5/10 Major 7 unhealthy d/yr today · 7 by 30 yrs out
Nearby sold comps map
Loading sold comps map…
Walkable amenities ~0.75 mi
Loading nearby amenities…
Taxation est. · year 1
- Rental income
- $19,972
- − Mortgage interest
- −$8,962
- − Property taxes
- −$938
- − Insurance
- −$800
- − Repairs & maintenance
- −$1,598
- − Management
- −$1,598
- − Depreciation
- −$4,655
- Taxable income
- $1,422
- Est. tax owed @ 24.0%
- −$341
- After-tax cash flow
- $3,630/yr
For passive investors: Depreciation is non-cash, so a rental often shows a tax loss while cash-flowing — sheltering income. Rental losses are passive: they offset passive income freely, and up to $25,000/yr can offset ordinary (W-2) income if you actively participate and your MAGI is under $100k (phasing out to $0 by $150k); unused losses carry forward. On sale, claimed depreciation is recaptured at up to 25%, and gains may owe capital-gains tax (a 1031 exchange can defer both). Figures are a year-1 estimate at your 24.0% rate — not tax advice; consult a CPA.
Schools (NCES district)
- District
- Duval
- NCES district ID
- 1200480
- Math proficiency
- 46% ▼ -11.00%
- Reading proficiency
- 45% ▼ -4.00%
- Median HH income
- $48,987
- Composite
- 38.97/100
- National rank
- #4076
- State rank
- #48 of 73 in FL
Livability — Jacksonville
- Score
- 83/100
- State rank
- #50
- US rank
- #911
Category grades
Schools grade is shown separately in the Schools card above.
Census & demographics
- Census place
- Jacksonville, FL
- County
- Duval County · 1,015,274 people
- City population
- 979,034
- Metro
- Jacksonville, FL
- Population (ZIP)
- 65,729
- Household income
- $61,050
- Rent vs Own
- Severe rent burden
- 3605.0
Population outlook (Duval County) Hauer SSP2
- Today (2025)
- 1,013,010 people
- By 2030
- 1,059,228 · +4.6%
- By 2040
- 1,141,439 · +12.7%
- By 2050
- 1,205,258 · +19.0%
- By 2075
- 1,324,282 · +30.7%
- By 2100
- 1,319,620 · +30.3%
Race, ethnicity, and origin ACS 2023
- Neighborhood character
- Diverse neighborhood (Simpson 0.65)
- Race & ethnicity
- White 43% Black 38% Hispanic / Latino 10% Two or more races 7% Asian 3%
- Hispanic origin (detail)
- Mexican 3% Puerto Rican 3%
- Common ancestry
- Slovak 2% Hispanic 2% Italian 1%
- Foreign-born
- 10% · Canada, Vietnam, China
- Languages at home
- 86% English-only · Spanish 7% French/Haitian/Cajun 2% Tagalog/Filipino 1%
Political lean MEDSL · Duval
- 2024 margin
- Toss-up / Even · D 48.7% · R 50.1% · Other 1.2%
- 2008→2024 swing
- +0.4pp no change · 2008: -1.9pp · 2024: -1.5pp
- All cycles
- 2024: R+1.5 2020: D+3.8 2016: R+1.5 2012: R+3.6 2008: R+1.9
Not yet ingested
- Civics
- —
Market trends
- HPI YoY
- ▼ -314.81%
- Current HPI
- 281.2688
- Rent YoY
- ▲ 2.11%
- Metro
- Jacksonville, FL
- State GDP YoY
- ▲ 3.28%
- F500 in state
- 36
Industry mix (Fortune 500 HQ in FL)
| Industry | F500 HQs | Revenue |
|---|---|---|
| Industrial Technology | 2 | $29B |
|
||
| Insurance | 2 | $17B |
|
||
| Retail | 1 | $60B |
|
||
| Technology Distribution | 1 | $58B |
|
||
| Homebuilding | 1 | $35B |
|
||
| Technology Manufacturing | 1 | $35B |
|
||
Price history
+335.4% since first listed9 events — show timeline
- 2026-05-12 Relisted — realMLS
- 2026-04-30 Contingent — realMLS
- 2026-04-13 Relisted — realMLS
- 2026-04-13 Price Changed $165,000 realMLS
- 2026-04-09 Contingent — realMLS
- 2026-03-23 Listed $169,000 realMLS
- 2006-05-05 Sold (Public Records) $141,500 Public Records
- 1997-11-06 Sold (Public Records) $63,000 Public Records
- 1997-09-22 Sold (Public Records) $37,900 Public Records
Property tax history
+2.5%/yrLatest (2025): $938 · +23.9% YoY. Source: county tax records.
Cash-flow waterfall
monthlySold comps — $/sqft
last 12 mo · ≤1 miLoading sold comps…