50 Maizefield Dr · Highgate, VT
Flood risk 1/10 · Minimal
- FEMA flood zone
- X
- Chance of flooding over 30 yrs
- 0.0%
- Est. flood insurance / yr
- $473 – $860
Fire risk 1/10 · Minimal
- Est. fire insurance / yr
- $480 – $892
Heat risk 2/10 · Minimal
- Hot days now (above 91°F)
- 7 days/yr
- Hot days in 30 yrs
- 15 days/yr
Wind risk 1/10 · Minimal
- Chance of severe wind over 30 yrs
- 1.0%
Air-quality risk 2/10 · Minimal
- Unhealthy air days now
- 1 days/yr
- Unhealthy air days in 30 yrs
- 2 days/yr
Risk factors via First Street. Map © Google.
Why this score? — see what drove the C+ grade
The composite is a weighted blend of 9 inputs, each scored 0–100. Each bar is that input's sub-score; the figure is the points it added to the 100-point composite (weight × sub-score).
- Cash flow +17.6/30.0
- ARV discount +15.0/15.0
- Appreciation +7.2/10.0
- DSCR +5.5/10.0
- Schools +5.0/10.0
- 1% rule +4.8/10.0
- Rent growth +2.5/5.0
- Livability +2.5/5.0
- Condition / age +2.5/5.0
$173,800
🖨 Deal sheet 📄 Offer letter ✓ Due diligence
Listing remarks
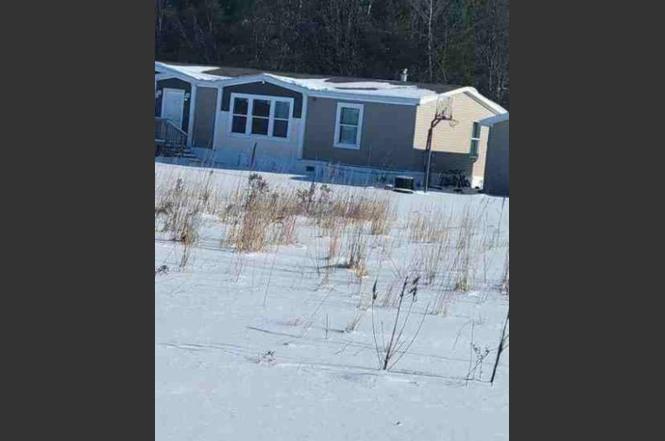
Great Opportunity to own this manufactured home built in 2019 featuring 3 bedrooms and 2 bathrooms. * * * SPECIAL NOTES: (1) This is a CASH ONLY transaction. (2) Seller to pay Taxes, HOA, and Municipal/Utility Liens. (3) Please read the Auction disclaimers carefully before placing a bid or submitting an offer. * * *
Key facts
- 1.01 acre lot
- Garage
- Built 2019
Property features AI
Finance
- Financial info: Property is foreclosed / bank-owned (REO); Auction scheduled (reserve price)
Exterior
- Parking: One-car garage
- Utilities: Drilled well; On-site septic; On-site electric; Fiber optic internet available; Cable available
- Home design: Manufactured/Mobile home; Single-story (2019 construction)
- Construction: Vinyl exterior; Asphalt shingle roof; Built in 2019
- Exterior features: Field/pasture lot; Gravel driveway
Interior
- Bathrooms: Two full bathrooms
- Heating & cooling: Forced air heating
- Interior features: Six total rooms
Neighborhood map
What this means for you Summary
Snapshot
- This is a 3-bed/2.0-bath manufactured listed at $174k.
Deal economics
- At list price, monthly cash flow is $136 ($2k/yr) — positive.
- The deal already cash-flows at list — no discount required.
- To meet the 1% rule (rent ≥ 1% of price), the offer needs to be $170k (2.0% below list).
- Recommended offer: $153k (12.0% below list) — sets the bar for market timing.
Location & tenants
- Location reads: area grade C — affects rentability + tenant quality, not the cash-flow math above.
- Market conditions: 25 active listings in the ZIP; 200 units permitted in Franklin County in 2024 (25 in 5+ unit buildings).
Forward outlook
- In year one you build about $9k of equity ($1k loan paydown + $8k appreciation (4.5% local appreciation)).
- Franklin County population projected to shrink 3% by 2050 — rents likely to lag national; underwrite the cash flow, not the appreciation.
- At projected returns (4.5% appreciation + 3.0% rent growth), your $49k cash investment doubles in ~5 years — after that, you're playing with house money.
- By year 4, paydown + projected appreciation supports a ~$30k cash-out refi (75% LTV) — recoverable capital for the next deal without selling this one.
Negotiation context
- It's been on market 132 days — a 12% lower offer ($153k) is reasonable based on typical stale-listing flexibility.
Questions for the listing agent
- It's been on market 132 days. Have you received any prior offers? Is the seller open to a 12% concession, seller financing, or rate buy-down credit?
- Why hasn't it sold? Are there any deal-killer items the seller is aware of (foundation, flood, title, zoning, code violations)?
- Is there a deadline driving the sale (1031 exchange, divorce, estate, relocation)? That informs how much negotiation room exists.
- What's the average days-on-market for RENTAL listings here right now (not sales)? A rising rental-DOM trend means longer vacancies and softer asking-rent achievability than the comps imply.
- What's the recent tenant-quality profile in this submarket — average credit score on applications, eviction rate, late-payment / NSF rate, and stable-employment percentage? A property-management company in the area should have these aggregated.
- How much new for-sale + rental construction is in the pipeline within 1–3 miles? Heavy new supply typically softens prices + rents 12–24 months out; constrained supply supports both.
Investment metrics
- 1% rule
- 0.98% ✗
- Cap rate
- 7.23%
- Cash-on-cash
- 3.36%
- DSCR
- 1.15
- GRM
- 8.5
CMA / ARV
- ARV (on-the-fly)
- $294,880
- Comps found
- 2
Show comp detail 2 sales within ~0.75 mi
| Address | Dist | Beds/Ba | Sqft | Sold | Price | $/sf | Match |
|---|---|---|---|---|---|---|---|
| 261 Deso Dr | 0.40mi | 3/2.0 | 1,620 (+7%) | 24mo | $305,000 | $188 | 51 |
| 78 Lynn Lou Dr #4 | 0.64mi | 3/2.0 | 1,493 (-2%) | 24mo | $290,000 | $194 | 47 |
Match score weights: distance 35% · size 25% · config 20% · recency 20%. Top-matched comps best support the ARV.
Projected returns pro-forma
4.46% appreciation · 3.0% rent growth · sell at horizon
- IRR
- 14.4%
- Equity multiple
- 1.89×
- Total profit
- $43,445
- Equity at exit
- $92,822
- IRR
- 15.3%
- Equity multiple
- 3.60×
- Total profit
- $126,600
- Equity at exit
- $155,696
Cash invested: $48,664 (down + closing). Projections, not guarantees.
Landlord ↔ Tenant lean methodology
- Overall (STATE)
- 41 Moderately Tenant-Leaning
- State Vermont
- 41 Moderately Tenant-Leaning · D+15
- County
- — inherits STATE
- City
- — inherits STATE
ZIP-level market 05459
- Home prices YoY
- 1.2%
- Active inventory
- 25
- Price-to-rent
- 8.5×
Monthly cashflow live
- Estimated rent
- $1,703 medium interval (Pro) →
- Mortgage (P&I)
- −$911
- Tax from tax record
- −$225 /mo · $2,698/yr
- Insurance
- −$72
- HOA
- −$0
- Vacancy / Maint / Mgmt
- −$358
- Net cashflow
- $136
Break-even live
UW: 25.0% down · 7.5% · 30yr · 1.5% tax · 5.0% vac · 8.0% maint · 8.0% mgmt
Financing live
Cash to close
- Down payment
- $43,450
- Closing costs
- $5,214
- Reserves months
- —
- Total cash needed
- —
Loan-product check · same deal, 3 products live
Conventional
25% down · 7.5% · 30yr
- Down + closing
- —
- Monthly P&I
- —
- Monthly cashflow
- —
- DSCR
- —
- Eligible?
- —
Personal DTI + credit; lowest rate.
DSCR
20% down · 8.5% · 30yr
- Down + closing
- —
- Monthly P&I
- —
- Monthly cashflow
- —
- DSCR
- —
- Eligible?
- —
No personal income docs; deal must DSCR.
Hard money
10% down · 12.0% · 12mo
- Down + closing
- —
- Monthly P&I
- —
- Monthly cashflow
- —
- DSCR
- —
- Eligible?
- —
Short-term bridge; refi at stabilization.
Listing history 16 events
-
2026-06-18days on market $173,800 Active 132 DOM
-
2026-06-17days on market $173,800 Active 131 DOM
-
2026-06-16days on market $173,800 Active 130 DOM
-
2026-06-15days on market $173,800 Active 129 DOM
-
2026-06-15days on market $173,800 Active 128 DOM
-
2026-06-13days on market $173,800 Active 127 DOM
-
2026-06-12days on market $173,800 Active 126 DOM
-
2026-06-09days on market $173,800 Active 123 DOM
-
2026-06-08days on market $173,800 Active 122 DOM
-
2026-06-08days on market $173,800 Active 121 DOM
-
2026-06-07days on market $173,800 Active 120 DOM
-
2026-06-03days on market $173,800 Active 117 DOM
-
2026-06-02days on market $173,800 Active 116 DOM
-
2026-06-01days on market $173,800 Active 115 DOM
-
2026-05-31days on market $173,800 Active 114 DOM
-
2026-02-05$173,800 Active
ⓘ Source: listings_history table (triggers on properties + properties_extension) + one-shot
backfill from property_details.listing_events for pre-trigger history.
Tax reassessment forecast VT · Partial reset (capped growth)
- Current annual tax
- $2,698 · $225/mo
- Projected year-2 tax
- $3,000 · $250/mo
- Expected delta
- +$302/yr (+$25/mo · 11.2%)
ⓘ Screening estimate from a state-policy table — verify with the county assessor before closing.
Climate risk First Street
- Flood 1/10 Low FEMA zone X · 0% chance over 30 yrs
- Wildfire 1/10 Low
- Heat 2/10 Low 7 d/yr ≥91°F today · 15 d/yr by 30 yrs out
- Wind 1/10 Low 100% chance of damaging wind over 30 yrs
- Air quality 2/10 Low 1 unhealthy d/yr today · 2 by 30 yrs out
Nearby sold comps map
Loading sold comps map…
Walkable amenities ~0.75 mi
Loading nearby amenities…
Taxation est. · year 1
- Rental income
- $20,431
- − Mortgage interest
- −$9,736
- − Property taxes
- −$2,698
- − Insurance
- −$869
- − Repairs & maintenance
- −$1,634
- − Management
- −$1,634
- − Depreciation
- −$5,056
- Taxable loss
- −$1,197
- Est. tax savings @ 24.0%
- +$287
- After-tax cash flow
- $1,923/yr
For passive investors: Depreciation is non-cash, so a rental often shows a tax loss while cash-flowing — sheltering income. Rental losses are passive: they offset passive income freely, and up to $25,000/yr can offset ordinary (W-2) income if you actively participate and your MAGI is under $100k (phasing out to $0 by $150k); unused losses carry forward. On sale, claimed depreciation is recaptured at up to 25%, and gains may owe capital-gains tax (a 1031 exchange can defer both). Figures are a year-1 estimate at your 24.0% rate — not tax advice; consult a CPA.
Schools (NCES district)
No district data.
Livability — Highgate
No livability data for this city. (Only ~50 U.S. cities are tracked.)
Census & demographics
- Census place
- Highgate Center, VT
- Population (ZIP)
- 2,003
Population outlook (Franklin County) Hauer SSP2
- Today (2025)
- 50,374 people
- By 2030
- 50,718 · +0.7%
- By 2040
- 50,557 · +0.4%
- By 2050
- 48,832 · -3.1%
- By 2075
- 43,526 · -13.6%
- By 2100
- 33,970 · -32.6%
Race, ethnicity, and origin ACS 2023
- Neighborhood character
- Predominantly White (82%)
- Race & ethnicity
- White 82% Two or more races 18% Hispanic / Latino 3%
- Common ancestry
- Lithuanian 16% Slovak 7% Italian 5%
- Foreign-born
- 2% · Canada
- Languages at home
- 97% English-only · French/Haitian/Cajun 3%
Political lean MEDSL · Franklin
- 2024 margin
- Toss-up / Even · D 50.0% · R 47.0% · Other 3.0%
- 2008→2024 swing
- -21.8pp toward R · 2008: 24.8pp · 2024: 3.0pp
- All cycles
- 2024: D+3.0 2020: D+9.0 2016: D+3.1 2012: D+23.6 2008: D+24.8
Not yet ingested
- Civics
- —
Market trends
- HPI YoY
- ▲ 4.46%
- Current HPI
- 359.8367
- Rent YoY
- —
- Metro
- —
- State GDP YoY
- —
- F500 in state
- 0
Price history
1 event — show timeline
- 2026-02-05 Listed $173,800 PrimeMLS
Property tax history
-3.4%/yrLatest (2024): $2,698 · +4.4% YoY. Source: county tax records.
Cash-flow waterfall
monthlySold comps — $/sqft
last 12 mo · ≤1 miLoading sold comps…