 Multi-family
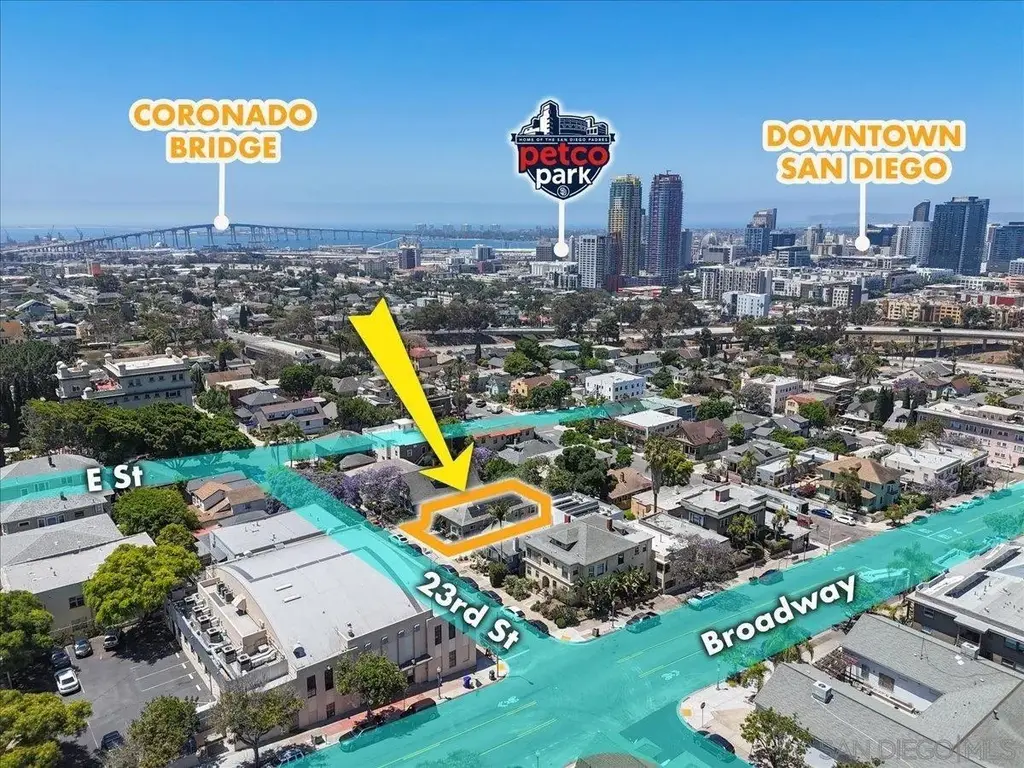
942 23rd St · San Diego, CA
Flood risk 1/10 · Minimal
- FEMA flood zone
- X (unshaded)
- Chance of flooding over 30 yrs
- 0.0%
- Est. flood insurance / yr
- $507 – $1,088
Fire risk 1/10 · Minimal
- Est. fire insurance / yr
- $659 – $1,223
Heat risk 4/10 · Minor
- Hot days now (above 84°F)
- 7 days/yr
- Hot days in 30 yrs
- 20 days/yr
Wind risk 1/10 · Minimal
- Chance of severe wind over 30 yrs
- —
Air-quality risk 3/10 · Minor
- Unhealthy air days now
- 2 days/yr
- Unhealthy air days in 30 yrs
- 2 days/yr
Risk factors via First Street. Map © Google.
Why this score? — see what drove the F grade
The composite is a weighted blend of 9 inputs, each scored 0–100. Each bar is that input's sub-score; the figure is the points it added to the 100-point composite (weight × sub-score).
- Cash flow +14.0/30.0
- DSCR +4.2/10.0
- Livability +3.8/5.0
- 1% rule +3.2/10.0
- Rent growth +2.8/5.0
- Condition / age +2.5/5.0
- Schools +2.2/10.0
- ARV discount +0.0/15.0
- Appreciation +0.0/10.0
$1,900,000
🖨 Deal sheet (PDF) 📄 Offer letter ✓ Due diligence
Multi-family units
County records classify this as Multi-Family (5+ Unit). Listing-text estimate: 1 unit. estimate disagrees with records
5+ unit building — per-unit beds/baths from public records are typically unavailable; the breakdown below (if shown) is an estimate from the listing text.
Listing remarks
23rd St is a prime investment opportunity offering a turnkey asset with immediate cash flow. This multifamily property, comprises five legal and one nonconforming unit with a mix of four 1-bedroom/1-bathroom units, one studio, and one 1-bedroom/2-bathroom unit. The property hosts a fully modernized living experience for residents. Six total units. The most compelling aspect of this offering is its comprehensive 2021 renovation and proven performance as a furnished rental with strong in-place income. The property features modernized kitchens, smart locks, mini-split HVAC systems, and fully paid solar panels, along with an expansive outdoor entertaining area complete with a BBQ, outdoor kitch
Key facts
- Paid solar panels
- Smart locks
- Modern kitchens
Tags
Property features AI
Exterior
- Utilities: Cable available
- Home design: Residential income property; Com-Res income subtype
- Construction: Composition roof; Solar panels
- Exterior features: Deck; Wood fencing; Landscaped lot
Interior
- Flooring: Vinyl
- Heating & cooling: Wall/window air conditioning units; Has cooling
- Interior features: Vinyl flooring
Neighborhood map
What this means for you Summary
Snapshot
- This is a 5-bed/5.0-bath multifamily listed at $1.90M.
Deal economics
- At list price, monthly cash flow is $230 ($3k/yr) — positive.
- The deal already cash-flows at list — no discount required.
- To meet the 1% rule (rent ≥ 1% of price), the offer needs to be $1.56M (17.7% below list).
- Recommended offer: $1.56M (17.7% below list) — sets the bar for 1% rule.
- Cap rate 6.4% vs local median 2.0% in San Diego — top-decile yield for the area; either an underpriced asset or a hidden risk that comps aren't pricing in. Stress-test before assuming the spread holds.
Location & tenants
- Location reads 75/100 on livability (#123 in CA, #4,206 nationally) — a middle-class / working-renter tenant base. Strengths: amenities A+, commute A+, employment A+; Watch: health & safety C-, crime D+, cost of living F.
- San Diego Unified (urban): math 19% / reading 29% proficiency, ranked #393 of 517 in CA (top 76%) — low school quality limits family demand, transient renter base, plan for 1-2y turnover.
- Zoned schools: Sherman Elementary (539 students, 86% FRL); Roosevelt International Middle (math 24% / reading 24%, grade F, #277 of 498 statewide, top 73%, 761 students, 59% FRL); San Diego High (2,105 students, 62% FRL) — zoned schools average 69% FRL vs 52% district-wide (17 pts higher); higher-poverty schools than district average — tighter screening recommended.
- Market conditions: Rents rising (+1.0%/yr); 90 active listings in the ZIP; 2 comparable units currently listed for rent nearby; solid renter incomes; 11,759 units permitted in San Diego County in 2024 (7,244 in 5+ unit buildings).
- At $15,644/mo this rent would consume 243% of the median local household income ($77k/yr) (locally 2980% of renters already pay >50% of income on rent) — very limited rent-growth headroom before tenants either downsize or default.
Forward outlook
- Local home prices are declining (-3.0%/yr); year-one equity from $13k of loan paydown is wiped out by about $57k of value loss. Plan a longer hold.
- San Diego County population projected at +20% by 2050 — long-run rental-demand tailwind backs the buy-and-hold thesis.
Negotiation context
- It's been on market 39 days — a 3% lower offer ($1.84M) is reasonable based on typical stale-listing flexibility.
- 6 sale attempts since 10y ago with the ask held roughly flat each time — persistent listings suggest the price (not the market) is what's stuck; bring a comps-based counter.
- Current owner paid $1.15M; list at $1.90M implies a 65% gain — meaningful room to come down on a strong offer.
Questions for the listing agent
- It's been on market 39 days. Have you received any prior offers? Is the seller open to a 18% concession, seller financing, or rate buy-down credit?
- Is there a deadline driving the sale (1031 exchange, divorce, estate, relocation)? That informs how much negotiation room exists.
- Schools are B-rated — typically a magnet for longer-tenancy family renters. What's the average tenant stay here, and is there a school-zone premium baked into asking?
- Crime grade is D in this area — have there been break-ins, vandalism, or insurance claims at this property in the last 3 years? What carrier currently insures it and at what premium?
- The area grade is low — what's the realistic commute time and amenity access for the typical tenant pool here? Any planned neighborhood developments (good or bad) we should know about?
- What's the average days-on-market for RENTAL listings here right now (not sales)? A rising rental-DOM trend means longer vacancies and softer asking-rent achievability than the comps imply.
- What's the recent tenant-quality profile in this submarket — average credit score on applications, eviction rate, late-payment / NSF rate, and stable-employment percentage? A property-management company in the area should have these aggregated.
- How much new apartment / multifamily construction is in the pipeline within 1–3 miles? Heavy new supply (>2% of stock underway) typically softens rents 12–24 months out; light construction supports rent growth.
Investment metrics
- 1% rule
- 0.82% ✗
- Cap rate
- 6.44%
- Cash-on-cash
- 0.52%
- DSCR
- 1.02
- GRM
- 10.1
CMA / ARV
- ARV (on-the-fly)
- $1,317,555
- Comps found
- 3
Show comp detail 3 sales within ~0.75 mi
| Address | Dist | Beds/Ba | Sqft | Sold | Price | $/sf | Match |
|---|---|---|---|---|---|---|---|
| 2129 B St | 0.17mi | 4/4.0 (-1) | 2,176 (-0%) | 24mo | $1,512,500 | $695 | 62 |
| 2544-46 C St | 0.27mi | 5/2.0 | 2,280 (+4%) | 24mo | $1,375,000 | $603 | 48 |
| 2775-77 K St | 0.72mi | 6/3.0 (+1) | 2,089 (-4%) | 19mo | $1,050,000 | $503 | 30 |
Match score weights: distance 35% · size 25% · config 20% · recency 20%. Top-matched comps best support the ARV.
Projected returns pro-forma
-3.0% appreciation · 1.0% rent growth · sell at horizon
- IRR
- -17.6%
- Equity multiple
- 0.39×
- Total profit
- $-324,453
- Equity at exit
- $283,296
- IRR
- -13.7%
- Equity multiple
- 0.27×
- Total profit
- $-386,848
- Equity at exit
- $164,277
Cash invested: $532,000 (down + closing). Projections, not guarantees.
Landlord ↔ Tenant lean methodology
- Overall (STATE)
- 18 Strongly Tenant-Friendly
- State California
- 18 Strongly Tenant-Friendly · D+13
- County
- — inherits STATE
- City
- — inherits STATE
ZIP-level market 92102
- Rents YoY
- 1.0%
- Active inventory
- 90
- Price-to-rent
- 60.7×
Monthly cashflow live
- Estimated rent
- $15,644 medium interval (Pro) →
- Mortgage (P&I)
- −$9,964
- Tax from tax record
- −$1,373 /mo · $16,474/yr
- Insurance
- −$792
- HOA
- −$0
- Vacancy / Maint / Mgmt
- −$3,285
- Net cashflow
- $230
Break-even live
Sensitivity live
| Price | -10% $1,306 | -5% $768 | +0% $230 | +5% $-307 | +10% $-845 |
|---|---|---|---|---|---|
| Rent | -10% $-1,005 | -5% $-388 | +0% $230 | +5% $848 | +10% $1,466 |
| Rate | -1.0pp $1,187 | -0.5pp $714 | base $230 | +0.5pp $-262 | +1.0pp $-763 |
6-unit breakdown (identical units grouped — click to expand)
| Units | Beds | Baths | Est. rent |
|---|---|---|---|
| 5× units | 1 | 1 | $13,035 |
| #1 | 1 | 1 | $2,607 |
| #2 | 1 | 1 | $2,607 |
| #3 | 1 | 1 | $2,607 |
| #4 | 1 | 1 | $2,607 |
| #6 | 1 | 1 | $2,607 |
| 1× unit | 1 | 2 | $2,607 |
| Total (6 units) | $15,644 | ||
UW: 25.0% down · 7.5% · 30yr · 1.5% tax · 5.0% vac · 8.0% maint · 8.0% mgmt
Financing live
Cash to close
- Down payment
- $475,000
- Closing costs
- $57,000
- Reserves months
- —
- Total cash needed
- —
Loan-product check · same deal, 3 products live
Conventional
25% down · 7.5% · 30yr
- Down + closing
- —
- Monthly P&I
- —
- Monthly cashflow
- —
- DSCR
- —
- Eligible?
- —
Personal DTI + credit; lowest rate.
DSCR
20% down · 8.5% · 30yr
- Down + closing
- —
- Monthly P&I
- —
- Monthly cashflow
- —
- DSCR
- —
- Eligible?
- —
No personal income docs; deal must DSCR.
Hard money
10% down · 12.0% · 12mo
- Down + closing
- —
- Monthly P&I
- —
- Monthly cashflow
- —
- DSCR
- —
- Eligible?
- —
Short-term bridge; refi at stabilization.
Rent comps 2 comps
| Address | Beds | Baths | Sqft | Rent | $/sqft | DOM | Units | Dist |
|---|---|---|---|---|---|---|---|---|
| 1208 24th St San Diego, CA | 4.0 | 2.0 | 2400 | $7,000 | $2.92 | 26d | 1 | 0.21mi |
| 3209 L St San Diego, CA | 4.0 | 3.0 | 1456 | $3,995 | $2.74 | 26d | 2 | 1.18mi |
Listing history 29 events
-
2026-06-21days on market $1,900,000 Active 39 DOM
-
2026-06-18days on market $1,900,000 Active 36 DOM
-
2026-06-17pricedays on market $1,900,000 Active 35 DOM
-
2026-06-16days on market $1,950,000 Active 34 DOM
-
2026-06-15days on market $1,950,000 Active 33 DOM
-
2026-06-13days on market $1,950,000 Active 31 DOM
-
2026-06-09days on market $1,950,000 Active 27 DOM
-
2026-06-08days on market $1,950,000 Active 26 DOM
-
2026-06-07days on market $1,950,000 Active 25 DOM
-
2026-06-04days on market $1,950,000 Active 22 DOM
-
2026-06-03days on market $1,950,000 Active 21 DOM
-
2026-06-02days on market $1,950,000 Active 20 DOM
-
2026-06-01days on market $1,950,000 Active 19 DOM
-
2026-05-31days on market $1,950,000 Active 18 DOM
-
2026-05-04$1,995,000 Active
-
2025-11-15historical
-
2025-09-09price $2,400,000
-
2025-08-22price $2,450,000
-
2025-06-15$2,550,000 Active
-
2025-02-10historical
-
2024-09-06$2,995,950
-
2024-09-06historical
-
2024-07-10$3,179,950
-
2024-07-10historical
-
2024-02-22$3,499,950
-
2018-01-30soldstatus $1,150,000
-
2017-01-18historical
-
2016-12-21$1,350,000 Active
-
1998-10-19soldstatus $155,000
ⓘ Source: listings_history table (triggers on properties + properties_extension) + one-shot
backfill from property_details.listing_events for pre-trigger history.
Tax reassessment forecast CA · Resets to sale price
- Current annual tax
- $16,474 · $1,373/mo
- Projected year-2 tax
- $16,474 · $1,373/mo
- Expected delta
- $0/yr ($0/mo · 0.0%)
ⓘ Screening estimate from a state-policy table — verify with the county assessor before closing.
Climate risk First Street
- Flood 1/10 Low FEMA zone X (unshaded) · 0% chance over 30 yrs
- Wildfire 1/10 Low
- Heat 4/10 Moderate 7 d/yr ≥84°F today · 20 d/yr by 30 yrs out
- Wind 1/10 Low
- Air quality 3/10 Moderate 2 unhealthy d/yr today · 2 by 30 yrs out
Nearby sold comps map
Loading sold comps map…
Walkable amenities ~0.75 mi
Loading nearby amenities…
Taxation est. · year 1
- Rental income
- $187,728
- − Mortgage interest
- −$106,430
- − Property taxes
- −$16,474
- − Insurance
- −$9,500
- − Repairs & maintenance
- −$15,018
- − Management
- −$15,018
- − Depreciation
- −$55,273
- Taxable loss
- −$29,985
- Est. tax savings @ 24.0%
- +$7,196
- After-tax cash flow
- $9,961/yr
For passive investors: Depreciation is non-cash, so a rental often shows a tax loss while cash-flowing — sheltering income. Rental losses are passive: they offset passive income freely, and up to $25,000/yr can offset ordinary (W-2) income if you actively participate and your MAGI is under $100k (phasing out to $0 by $150k); unused losses carry forward. On sale, claimed depreciation is recaptured at up to 25%, and gains may owe capital-gains tax (a 1031 exchange can defer both). Figures are a year-1 estimate at your 24.0% rate — not tax advice; consult a CPA.
Schools (NCES district)
- District
- San Diego Unified
- NCES district ID
- 0634320
- Math proficiency
- 19% ▼ -29.00%
- Reading proficiency
- 29% ▼ -28.00%
- Median HH income
- $61,673
- Composite
- 22.31/100
- National rank
- #8135
- State rank
- #393 of 517 in CA
Livability — San Diego
- Score
- 75/100
- State rank
- #123
- US rank
- #4206
Category grades
Schools grade is shown separately in the Schools card above.
Census & demographics
- Census place
- San Diego, CA
- County
- San Diego County · 3,178,799 people
- City population
- 1,397,612
- Metro
- San Diego-Chula Vista-Carlsbad, CA
- Population (ZIP)
- 38,901
- Household income
- $77,248
- Rent vs Own
- Severe rent burden
- 2980.0
Population outlook (San Diego County) Hauer SSP2
- Today (2025)
- 3,678,185 people
- By 2030
- 3,856,546 · +4.8%
- By 2040
- 4,171,407 · +13.4%
- By 2050
- 4,421,607 · +20.2%
- By 2075
- 4,831,599 · +31.4%
- By 2100
- 4,832,502 · +31.4%
Race, ethnicity, and origin ACS 2023
- Neighborhood character
- Diverse neighborhood (Simpson 0.61)
- Race & ethnicity
- Hispanic / Latino 56% White 26% Two or more races 17% Black 9% Asian 6% Native American 2%
- Hispanic origin (detail)
- Mexican 53%
- Common ancestry
- Romanian 2% Lithuanian 1% Italian 1%
- Foreign-born
- 25% · Canada, Vietnam, China
- Languages at home
- 49% English-only · Spanish 45% Other Asian/Pacific 2% Vietnamese 2%
Political lean MEDSL · San Diego
- 2024 margin
- D (+16.8) · D 56.9% · R 40.1% · Other 2.9%
- 2008→2024 swing
- +6.6pp toward D · 2008: 10.2pp · 2024: 16.8pp
- All cycles
- 2024: D+16.8 2020: D+22.8 2016: D+17.8 2012: D+5.1 2008: D+10.2
Not yet ingested
- Civics
- —
Market trends
- HPI YoY
- ▼ -577.24%
- Current HPI
- 402.4107
- Rent YoY
- ▲ 1.00%
- Metro
- San Diego-Chula Vista-Carlsbad, CA
- State GDP YoY
- ▲ 3.21%
- F500 in state
- 116
Industry mix (Fortune 500 HQ in CA)
| Industry | F500 HQs | Revenue |
|---|---|---|
| Technology | 27 | $1,492B |
|
||
| Financial Services | 3 | $174B |
|
||
| Retail | 3 | $44B |
|
||
| Insurance | 3 | $26B |
|
||
| Media / Entertainment | 2 | $115B |
|
||
| Pharmaceuticals / Biotech | 2 | $62B |
|
||
Price history
+1187.1% since first listed15 events — show timeline
- 2026-05-04 Listed $1,995,000 SDMLS
- 2025-11-15 Listing Removed — SDMLS
- 2025-09-09 Price Changed $2,400,000 SDMLS
- 2025-08-22 Price Changed $2,450,000 SDMLS
- 2025-06-15 Listed $2,550,000 SDMLS
- 2025-02-10 Listing Removed — SDMLS
- 2024-09-06 Listing Removed — SDMLS
- 2024-09-06 Listed $2,995,950 SDMLS
- 2024-07-10 Listing Removed — SDMLS
- 2024-07-10 Listed $3,179,950 SDMLS
- 2024-02-22 Listed $3,499,950 SDMLS
- 2018-01-30 Sold (Public Records) $1,150,000 Public Records
- 2017-01-18 Listing Removed — SDMLS
- 2016-12-21 Listed $1,350,000 SDMLS
- 1998-10-19 Sold (Public Records) $155,000 Public Records
Property tax history
+12.4%/yrLatest (2025): $16,474 · +3.9% YoY. Source: county tax records.
Cash-flow waterfall
monthlySold comps — $/sqft
last 12 mo · ≤1 miLoading sold comps…