37 Brockman Hill Rd · Travelers Rest, SC
Flood risk 1/10 · Minimal
- FEMA flood zone
- X (unshaded)
- Chance of flooding over 30 yrs
- 0.0%
- Est. flood insurance / yr
- $507 – $1,088
Fire risk 4/10 · Minor
- Est. fire insurance / yr
- $783 – $1,453
Heat risk 5/10 · Moderate
- Hot days now (above 103°F)
- 7 days/yr
- Hot days in 30 yrs
- 16 days/yr
Wind risk 2/10 · Minimal
- Chance of severe wind over 30 yrs
- —
Air-quality risk 4/10 · Minor
- Unhealthy air days now
- 3 days/yr
- Unhealthy air days in 30 yrs
- 4 days/yr
Risk factors via First Street. Map © Google.
Why this score? — see what drove the D+ grade
The composite is a weighted blend of 9 inputs, each scored 0–100. Each bar is that input's sub-score; the figure is the points it added to the 100-point composite (weight × sub-score).
- Cash flow +16.2/30.0
- ARV discount +7.5/15.0
- DSCR +5.0/10.0
- Schools +4.2/10.0
- 1% rule +3.7/10.0
- Livability +3.7/5.0
- Rent growth +2.8/5.0
- Condition / age +2.5/5.0
- Appreciation +0.0/10.0
$199,900
🖨 Deal sheet 📄 Offer letter ✓ Due diligence
Listing remarks
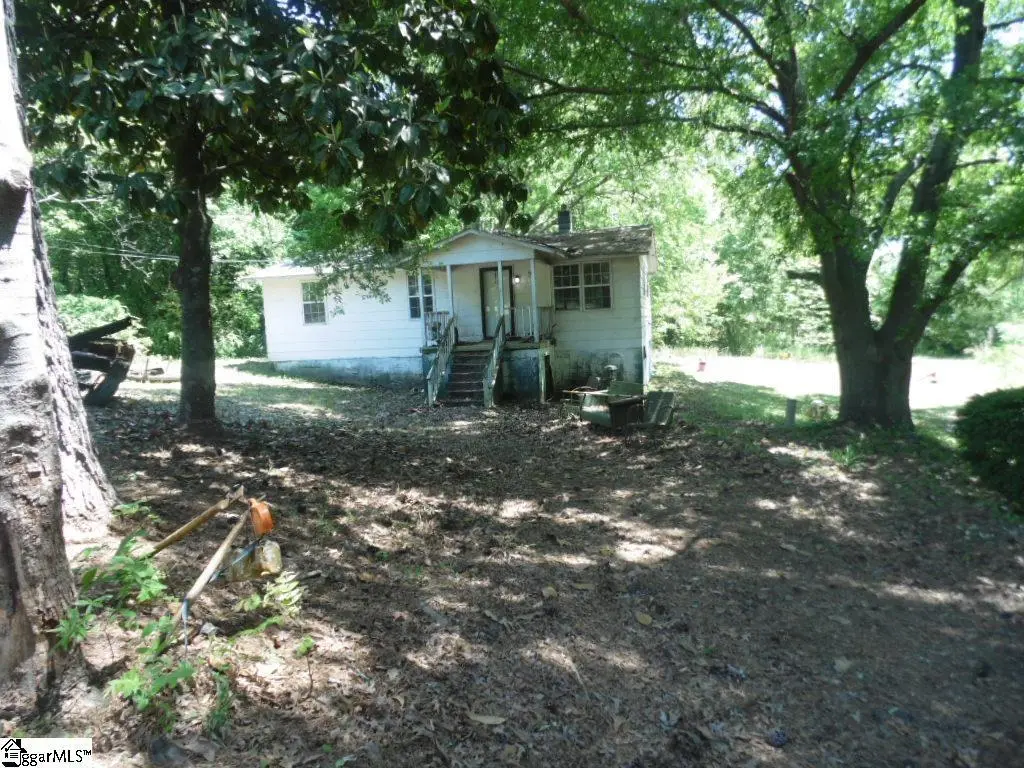
Opportunity awaits with this fixer-upper ideally located between Greenville and Travelers Rest—two of the Upstate’s most sought-after and rapidly growing areas. Just minutes from the popular Swamp Rabbit Trail, enjoy easy access to walking, biking, dining, and local attractions. This 3-bedroom, 1-bath bungalow, built around 1972, offers approximately 936 square feet of potential. Featuring a living room and eat-in kitchen, the home sits on a wooded lot that provides privacy and a peaceful setting. This property is ready for a complete renovation, making it a perfect opportunity for investors, flippers, or buyers looking to create their own vision from the ground up. With its pri
Key facts
- Wooded lot
- Complete renovation
- Prime location
Tags
Property features AI
Finance
- Other: Lead-based paint disclosure required; Residential property disclosure required
- HOA & community: No HOA fees or community amenities listed
Exterior
- Parking: Driveway parking (unpaved)
- Utilities: Public water; Septic sewer; No garbage pickup listed
- Home design: Single-story home; Built around 1972; Crawl space foundation; Wood exterior finish; Composition shingle roof
- Construction: Approximate age 50+ years
- Exterior features: Front porch; Some trees / wooded setting
Interior
- Kitchen: Kitchen roughly 19 x 12
- Bedrooms: Primary bedroom with full bath; Master bedroom ~12 x 12; Second bedroom ~12 x 12; Third bedroom ~12 x 12
- Flooring: Hardwood/pine floor under carpet
- Bathrooms: Two full bathrooms; One half bathroom; One full bathroom on main level
- Heating & cooling: No heating system; No cooling system; Water heater: other (see remarks)
- Interior features: Cable available; Countertops: other; No fireplace
- Laundry & utility: Laundry on 1st floor in closet-style area; No appliances listed
Neighborhood map
What this means for you Summary
Snapshot
- This is a 3-bed/1.0-bath single-family listed at $200k.
Deal economics
- At list price, monthly cash flow is $107 ($1k/yr) — positive.
- The deal already cash-flows at list — no discount required.
- To meet the 1% rule (rent ≥ 1% of price), the offer needs to be $174k (13.1% below list).
- Recommended offer: $174k (13.1% below list) — sets the bar for 1% rule.
- Cap rate 6.9% vs local median 2.4% in Travelers Rest — top-decile yield for the area; either an underpriced asset or a hidden risk that comps aren't pricing in. Stress-test before assuming the spread holds.
Location & tenants
- Location reads 73/100 on livability (#41 in SC) — a middle-class / working-renter tenant base. Strengths: health & safety A+, cost of living A, amenities B+; Watch: commute F, employment F.
- Greenville 01 (suburban): math 44% / reading 54% proficiency, ranked #10 of 80 in SC (top 12%) — families likely to look elsewhere, expect single-tenant / working-renter base with shorter leases.
- Zoned schools: Duncan Chapel Elementary (math 33% / reading 27%, grade F, #394 of 597 statewide, top 66%, 591 students, 100% FRL) — zoned schools average 100% FRL vs 42% district-wide (58 pts higher); higher-poverty schools than district average — tighter screening recommended.
- Zoned-school proficiency averages 30% at this address vs 49% district-wide (-19 pts) — the specific schools serving this property underperform the Greenville 01 average; the district grade overstates school quality for this exact location.
- Market conditions: Rents rising (+1.2%/yr); 170 active listings in the ZIP; 4 comparable units currently listed for rent nearby; rentals leasing fast (median 3d on market — plan ~1-2 weeks tenant-placement turnaround); 5,595 units permitted in Greenville County in 2024 (566 in 5+ unit buildings).
- This rent runs 38% of the median local income ($55k/yr) — at the standard rent-burdened threshold; future hikes will face affordability resistance.
Forward outlook
- Local home prices are declining (-3.0%/yr); year-one equity from $1k of loan paydown is wiped out by about $6k of value loss. Plan a longer hold.
- Greenville County population projected at +34% by 2050 — long-run rental-demand tailwind backs the buy-and-hold thesis.
Negotiation context
- It's been on market 57 days — a 3% lower offer ($194k) is reasonable based on typical stale-listing flexibility.
Risks & watch-outs
- Climate carrying-cost: extreme-heat days projected 7→16/yr by 2055 (HVAC capex compounding) — expect insurance premiums to compound above CPI over the hold.
Questions for the listing agent
- It's been on market 57 days. Have you received any prior offers? Is the seller open to a 13% concession, seller financing, or rate buy-down credit?
- Built in 1972 — when were the roof, HVAC, electrical panel, plumbing, and water heater last replaced?
- Is there a deadline driving the sale (1031 exchange, divorce, estate, relocation)? That informs how much negotiation room exists.
- The area grade is low — what's the realistic commute time and amenity access for the typical tenant pool here? Any planned neighborhood developments (good or bad) we should know about?
- What's the average days-on-market for RENTAL listings here right now (not sales)? A rising rental-DOM trend means longer vacancies and softer asking-rent achievability than the comps imply.
- What's the recent tenant-quality profile in this submarket — average credit score on applications, eviction rate, late-payment / NSF rate, and stable-employment percentage? A property-management company in the area should have these aggregated.
- How much new for-sale + rental construction is in the pipeline within 1–3 miles? Heavy new supply typically softens prices + rents 12–24 months out; constrained supply supports both.
Investment metrics
- 1% rule
- 0.87% ✗
- Cap rate
- 6.93%
- Cash-on-cash
- 2.29%
- DSCR
- 1.10
- GRM
- 9.6
CMA / ARV
No comps found within radius.
Projected returns pro-forma
-3.0% appreciation · 1.22% rent growth · sell at horizon
- IRR
- -14.6%
- Equity multiple
- 0.49×
- Total profit
- $-28,690
- Equity at exit
- $29,806
- IRR
- -8.9%
- Equity multiple
- 0.49×
- Total profit
- $-28,509
- Equity at exit
- $17,284
Cash invested: $55,972 (down + closing). Projections, not guarantees.
Landlord ↔ Tenant lean methodology
- Overall (STATE)
- 90 Strongly Landlord-Friendly
- State South Carolina
- 90 Strongly Landlord-Friendly · R+6
- County
- — inherits STATE
- City
- — inherits STATE
ZIP-level market 29617
- Rents YoY
- 1.2%
- Active inventory
- 170
- Price-to-rent
- 9.6×
Monthly cashflow live
- Estimated rent
- $1,738 medium interval (Pro) →
- Mortgage (P&I)
- −$1,048
- Tax from tax record
- −$134 /mo · $1,612/yr
- Insurance
- −$83
- HOA
- −$0
- Vacancy / Maint / Mgmt
- −$365
- Net cashflow
- $107
Break-even live
UW: 25.0% down · 7.5% · 30yr · 1.5% tax · 5.0% vac · 8.0% maint · 8.0% mgmt
Financing live
Cash to close
- Down payment
- $49,975
- Closing costs
- $5,997
- Reserves months
- —
- Total cash needed
- —
Loan-product check · same deal, 3 products live
Conventional
25% down · 7.5% · 30yr
- Down + closing
- —
- Monthly P&I
- —
- Monthly cashflow
- —
- DSCR
- —
- Eligible?
- —
Personal DTI + credit; lowest rate.
DSCR
20% down · 8.5% · 30yr
- Down + closing
- —
- Monthly P&I
- —
- Monthly cashflow
- —
- DSCR
- —
- Eligible?
- —
No personal income docs; deal must DSCR.
Hard money
10% down · 12.0% · 12mo
- Down + closing
- —
- Monthly P&I
- —
- Monthly cashflow
- —
- DSCR
- —
- Eligible?
- —
Short-term bridge; refi at stabilization.
Rent comps 4 comps
| Address | Beds | Baths | Sqft | Rent | $/sqft | DOM | Units | Dist |
|---|---|---|---|---|---|---|---|---|
| 303 Southcreek Dr Travelers Rest, SC | 2.0 | 1.0 | 850 | $1,950 | $2.29 | 23d | 1 | 1.22mi |
| 405 Old Buncombe Rd Travelers Rest, SC | 2.0 | 1.0 | 875 | $1,150 | $1.31 | 3d | 5 | 1.32mi |
| 405 Old Buncombe Rd Unit 32 Travelers Rest, SC | 2.0 | 1.0 | 800 | $1,150 | $1.44 | 3d | 1 | 1.32mi |
| 125 Pinestone Dr Travelers Rest, SC | 1.0–3.0 | 1.0–2.0 | 1243 | $2,400 | $1.93 | 3d | 39 | 1.46mi |
Listing history 15 events
-
2026-06-18days on market $199,900 Active 57 DOM
-
2026-06-17days on market $199,900 Active 56 DOM
-
2026-06-16days on market $199,900 Active 55 DOM
-
2026-06-15days on market $199,900 Active 54 DOM
-
2026-06-13days on market $199,900 Active 52 DOM
-
2026-06-13days on market $199,900 Active 51 DOM
-
2026-06-10days on market $199,900 Active 49 DOM
-
2026-06-09days on market $199,900 Active 48 DOM
-
2026-06-08days on market $199,900 Active 47 DOM
-
2026-06-07days on market $199,900 Active 46 DOM
-
2026-06-03days on market $199,900 Active 42 DOM
-
2026-06-03days on market $199,900 Active 41 DOM
-
2026-06-01days on market $199,900 Active 40 DOM
-
2026-05-31days on market $199,900 Active 39 DOM
-
2026-04-22$199,900 Active
ⓘ Source: listings_history table (triggers on properties + properties_extension) + one-shot
backfill from property_details.listing_events for pre-trigger history.
Tax reassessment forecast SC · Resets to sale price
- Current annual tax
- $1,612 · $134/mo
- Projected year-2 tax
- $1,612 · $134/mo
- Expected delta
- $0/yr ($0/mo · 0.0%)
ⓘ Screening estimate from a state-policy table — verify with the county assessor before closing.
Climate risk First Street
- Flood 1/10 Low FEMA zone X (unshaded) · 0% chance over 30 yrs
- Wildfire 4/10 Moderate
- Heat 5/10 Major 7 d/yr ≥103°F today · 16 d/yr by 30 yrs out
- Wind 2/10 Low
- Air quality 4/10 Moderate 3 unhealthy d/yr today · 4 by 30 yrs out
Nearby sold comps map
Loading sold comps map…
Walkable amenities ~0.75 mi
Loading nearby amenities…
Taxation est. · year 1
- Rental income
- $20,853
- − Mortgage interest
- −$11,198
- − Property taxes
- −$1,612
- − Insurance
- −$1,000
- − Repairs & maintenance
- −$1,668
- − Management
- −$1,668
- − Depreciation
- −$5,815
- Taxable loss
- −$2,108
- Est. tax savings @ 24.0%
- +$506
- After-tax cash flow
- $1,788/yr
For passive investors: Depreciation is non-cash, so a rental often shows a tax loss while cash-flowing — sheltering income. Rental losses are passive: they offset passive income freely, and up to $25,000/yr can offset ordinary (W-2) income if you actively participate and your MAGI is under $100k (phasing out to $0 by $150k); unused losses carry forward. On sale, claimed depreciation is recaptured at up to 25%, and gains may owe capital-gains tax (a 1031 exchange can defer both). Figures are a year-1 estimate at your 24.0% rate — not tax advice; consult a CPA.
Schools (NCES district)
- District
- Greenville 01
- NCES district ID
- 4502310
- Math proficiency
- 44% ▼ -10.00%
- Reading proficiency
- 54% ▼ -2.00%
- Median HH income
- $49,596
- Composite
- 41.88/100
- National rank
- #3370
- State rank
- #10 of 80 in SC
Livability — Travelers Rest
- Score
- 73/100
- State rank
- #41
- US rank
- #5283
Category grades
Schools grade is shown separately in the Schools card above.
Census & demographics
- County
- Greenville County · 573,815 people
- City population
- 26,358
- Metro
- Greenville-Anderson, SC
- Population (ZIP)
- 26,582
- Household income
- $55,403
- Rent vs Own
- Severe rent burden
- 1209.0
Population outlook (Greenville County) Hauer SSP2
- Today (2025)
- 574,580 people
- By 2030
- 615,615 · +7.1%
- By 2040
- 695,373 · +21.0%
- By 2050
- 769,367 · +33.9%
- By 2075
- 933,296 · +62.4%
- By 2100
- 1,029,196 · +79.1%
Race, ethnicity, and origin ACS 2023
- Neighborhood character
- Diverse neighborhood (Simpson 0.60)
- Race & ethnicity
- White 56% Hispanic / Latino 28% Black 13% Two or more races 10% Native American 2% Asian 1%
- Hispanic origin (detail)
- Mexican 10% Puerto Rican 2%
- Common ancestry
- Slovak 3% Serbian 2% Lithuanian 2%
- Foreign-born
- 17% · Canada, Jamaica, Guatemala
- Languages at home
- 74% English-only · Spanish 23% Other Indo-European 1%
Political lean MEDSL · Greenville
- 2024 margin
- Strong R (+22.2) · D 38.0% · R 60.2% · Other 1.8%
- 2008→2024 swing
- +1.7pp toward D · 2008: -23.9pp · 2024: -22.2pp
- All cycles
- 2024: R+22.2 2020: R+18.2 2016: R+24.7 2012: R+27.8 2008: R+23.9
Not yet ingested
- Civics
- —
Market trends
- HPI YoY
- ▼ -194.04%
- Current HPI
- 238.8343
- Rent YoY
- ▲ 1.22%
- Metro
- Greenville-Anderson, SC
- State GDP YoY
- ▲ 4.51%
- F500 in state
- 2
Industry mix (Fortune 500 HQ in SC)
| Industry | F500 HQs | Revenue |
|---|---|---|
| Packaging | 1 | $7B |
|
||
Price history
1 event — show timeline
- 2026-04-22 Listed $199,900 Greater Greenville MLS
Property tax history
+25.0%/yrLatest (2025): $1,612 · +3.5% YoY. Source: county tax records.
Cash-flow waterfall
monthlySold comps — $/sqft
last 12 mo · ≤1 miLoading sold comps…