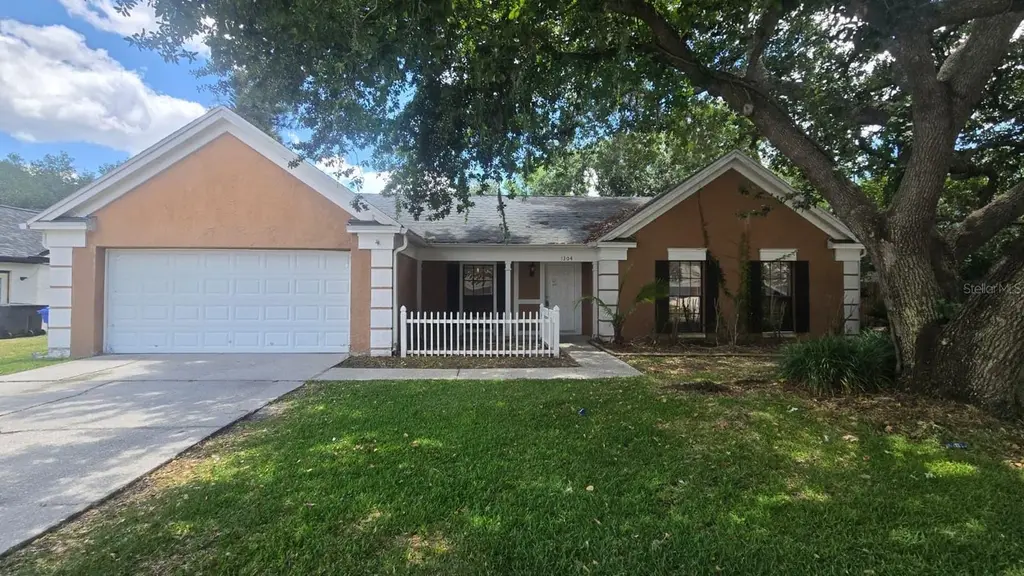
1304 Peachfield Dr · Bloomingdale, FL
Flood risk 1/10 · Minimal
- FEMA flood zone
- X
- Chance of flooding over 30 yrs
- 0.0%
- Est. flood insurance / yr
- $507 – $1,088
Fire risk 2/10 · Minimal
- Est. fire insurance / yr
- $947 – $1,759
Heat risk 10/10 · Severe
- Hot days now (above 109°F)
- 7 days/yr
- Hot days in 30 yrs
- 26 days/yr
Wind risk 9/10 · Severe
- Chance of severe wind over 30 yrs
- 99.0%
Air-quality risk 4/10 · Minor
- Unhealthy air days now
- 4 days/yr
- Unhealthy air days in 30 yrs
- 5 days/yr
Risk factors via First Street. Map © Google.
Why this score? — see what drove the C- grade
The composite is a weighted blend of 9 inputs, each scored 0–100. Each bar is that input's sub-score; the figure is the points it added to the 100-point composite (weight × sub-score).
- Cash flow +20.1/30.0
- ARV discount +7.5/15.0
- 1% rule +6.6/10.0
- DSCR +6.4/10.0
- Schools +4.2/10.0
- Livability +3.6/5.0
- Rent growth +3.5/5.0
- Condition / age +2.5/5.0
- Appreciation +0.0/10.0
$245,000
🖨 Deal sheet (PDF) 📄 Offer letter ✓ Due diligence
Listing remarks MLS
This home is located in one of Hillsborough County's most sought after communities: Bloomingdale. This community has tennis courts, golfing, playground, parks and walking trails. It is the home of Alafia Grade School and Bloomingdale High School respectively. Hillsborough County has this as 3 BR. It is 4 BR.
Key facts
- 7,700 sq ft lot
- 2 garage spots
- Pool
Property features AI
Finance
- Other: Property type: Residential, single family; Zoning: PD; Total living area reported as 1972 (source: Public Records); Building area total reported as 2693 (source: Public Records)
- Financial info: Lease restrictions apply
- HOA & community: HOA: Bloomingdale Cypress Reserve; HOA required, annual fee $130 (about $10.83/month); Pets allowed
Exterior
- Parking: Attached garage with 2 garage spaces
- Utilities: Public water; Public sewer; Other utilities
- Home design: Single family residence (residential); Fixer condition; One story; Faces west; Entry level: One
- Construction: Stucco construction; Shingle roof; Other roof material; Slab foundation; Lot approximately 0.18 acres (77 x 100, ~715 m²)
- Exterior features: Other exterior features; In-ground private pool
Interior
- Kitchen: No appliances specified; Other kitchen features reported
- Bedrooms: 4 bedrooms
- Flooring: Other flooring
- Bathrooms: 2 full bathrooms; 1 half bathroom
- Heating & cooling: Heating: Other; Cooling: Other
- Interior features: No notable built-in interior features listed; Other interior features reported
- Laundry & utility: Laundry listed as: Other
Neighborhood map
What this means for you Summary
Snapshot
- This is a 4-bed/3.0-bath single-family listed at $245k.
Deal economics
- At list price, monthly cash flow is $304 ($4k/yr) — positive.
- The deal already cash-flows at list — no discount required.
- Meets the 1% rule at list price ($3k rent vs $245k).
Location & tenants
- Location reads 71/100 on livability (#383 in FL) — a middle-class / working-renter tenant base. Strengths: employment A+, housing A+, crime A; Watch: amenities F, health & safety F.
- Hillsborough (suburban): math 47% / reading 50% proficiency, ranked #41 of 73 in FL (top 56%) — families likely to look elsewhere, expect single-tenant / working-renter base with shorter leases.
- Zoned schools: Alafia Elementary School (math 71% / reading 69%, grade A-, #345 of 2,144 statewide, top 17%, 648 students, 39% FRL); Burns Middle School (math 59% / reading 60%, grade B, #140 of 571 statewide, top 25%, 1,202 students, 48% FRL); Bloomingdale High School (math 41% / reading 54%, grade D, #204 of 667 statewide, top 31%, 2,304 students, 45% FRL).
- Market conditions: Rents rising fast (+4.1%/yr); 210 active listings in the ZIP; 27 comparable units currently listed for rent nearby; rentals at typical pace (median 18d on market — plan ~3-4 weeks tenant-placement turnaround); high-income renter base; 9,053 units permitted in Hillsborough County in 2024 (4,555 in 5+ unit buildings).
Forward outlook
- Local home prices are declining (-3.0%/yr); year-one equity from $2k of loan paydown is wiped out by about $7k of value loss. Plan a longer hold.
- Hillsborough County population projected at +37% by 2050 — long-run rental-demand tailwind backs the buy-and-hold thesis.
Negotiation context
- Only 3 days on market — expect competitive offers; lowballing is unlikely to land.
- 2 sale attempts since 13y ago with the ask held roughly flat each time — persistent listings suggest the price (not the market) is what's stuck; bring a comps-based counter.
Risks & watch-outs
- Watch-outs: property tax is 2.6% of price.
- Climate carrying-cost: severe wind risk, 99% chance of damaging wind over 30y; extreme-heat days projected 7→26/yr by 2055 (HVAC capex compounding) — expect insurance premiums to compound above CPI over the hold.
Questions for the listing agent
- Property tax is high relative to price — has the assessment been appealed recently, and will the sale trigger a re-assessment?
- What does the HOA fee cover, when was the last increase, and are there any pending special assessments or reserve-fund shortfalls?
- Is there a deadline driving the sale (1031 exchange, divorce, estate, relocation)? That informs how much negotiation room exists.
- Schools are D-rated, which usually means shorter tenancies and higher turnover. Who's the typical renter profile here, and what's been the actual vacancy rate?
- What's the average days-on-market for RENTAL listings here right now (not sales)? A rising rental-DOM trend means longer vacancies and softer asking-rent achievability than the comps imply.
- What's the recent tenant-quality profile in this submarket — average credit score on applications, eviction rate, late-payment / NSF rate, and stable-employment percentage? A property-management company in the area should have these aggregated.
- How much new for-sale + rental construction is in the pipeline within 1–3 miles? Heavy new supply typically softens prices + rents 12–24 months out; constrained supply supports both.
Investment metrics
- 1% rule
- 1.16% ✓
- Cap rate
- 7.78%
- Cash-on-cash
- 5.31%
- DSCR
- 1.24
- GRM
- 7.2
CMA / ARV
No comps found within radius.
Projected returns pro-forma
-3.0% appreciation · 4.06% rent growth · sell at horizon
- IRR
- -6.7%
- Equity multiple
- 0.75×
- Total profit
- $-17,114
- Equity at exit
- $36,530
- IRR
- 4.4%
- Equity multiple
- 1.34×
- Total profit
- $23,570
- Equity at exit
- $21,183
Cash invested: $68,600 (down + closing). Projections, not guarantees.
Landlord ↔ Tenant lean methodology
- Overall (STATE)
- 87 Strongly Landlord-Friendly
- State Florida
- 87 Strongly Landlord-Friendly · R+3
- County
- — inherits STATE
- City
- — inherits STATE
ZIP-level market 33596
- Home prices YoY
- -17.8%
- Rents YoY
- 4.1%
- Active inventory
- 210
- Price-to-rent
- 7.2×
Monthly cashflow live
- Estimated rent
- $2,831 high interval (Pro) →
- Mortgage (P&I)
- −$1,285
- Tax from tax record
- −$536 /mo · $6,427/yr
- Insurance
- −$102
- HOA
- −$10
- Vacancy / Maint / Mgmt
- −$594
- Net cashflow
- $304
Break-even live
Sensitivity live
| Price | -10% $442 | -5% $373 | +0% $304 | +5% $234 | +10% $165 |
|---|---|---|---|---|---|
| Rent | -10% $80 | -5% $192 | +0% $304 | +5% $416 | +10% $527 |
| Rate | -1.0pp $427 | -0.5pp $366 | base $304 | +0.5pp $240 | +1.0pp $176 |
UW: 25.0% down · 7.5% · 30yr · 1.5% tax · 5.0% vac · 8.0% maint · 8.0% mgmt
Financing live
Cash to close
- Down payment
- $61,250
- Closing costs
- $7,350
- Reserves months
- —
- Total cash needed
- —
Loan-product check · same deal, 3 products live
Conventional
25% down · 7.5% · 30yr
- Down + closing
- —
- Monthly P&I
- —
- Monthly cashflow
- —
- DSCR
- —
- Eligible?
- —
Personal DTI + credit; lowest rate.
DSCR
20% down · 8.5% · 30yr
- Down + closing
- —
- Monthly P&I
- —
- Monthly cashflow
- —
- DSCR
- —
- Eligible?
- —
No personal income docs; deal must DSCR.
Hard money
10% down · 12.0% · 12mo
- Down + closing
- —
- Monthly P&I
- —
- Monthly cashflow
- —
- DSCR
- —
- Eligible?
- —
Short-term bridge; refi at stabilization.
Rent comps 27 comps
| Address | Beds | Baths | Sqft | Rent | $/sqft | DOM | Units | Dist |
|---|---|---|---|---|---|---|---|---|
| 1431 Peachfield Dr Valrico, FL | 4.0 | 2.5 | 2163 | $2,750 | $1.27 | 19d | 1 | 0.35mi |
| 4009 Orangefield Pl Valrico, FL | 4.0 | 2.0 | 1822 | $2,650 | $1.45 | 18d | 1 | 0.51mi |
| 724 Fortuna Dr Brandon, FL | 4.0 | 2.0 | 1784 | $2,450 | $1.37 | 25d | 1 | 0.62mi |
| 3219 Pleasant Willow Ct Brandon, FL | 3.0 | 2.5 | 1707 | $2,195 | $1.29 | 19d | 1 | 0.62mi |
| 3217 Pleasant Willow Ct Brandon, FL | 3.0 | 3.0 | 1785 | $2,700 | $1.51 | 26d | 1 | 0.62mi |
| 3490 Timber Crossing Ave Brandon, FL | 4.0 | 3.0 | 2594 | $3,050 | $1.18 | 21d | 1 | 0.63mi |
| 3141 Pleasant Willow Ct Brandon, FL | 3.0 | 2.5 | 1683 | $2,195 | $1.30 | 0d | 1 | 0.64mi |
| 3247 Feather Haven Pl Brandon, FL | 3.0 | 3.0 | 1680 | $2,300 | $1.37 | 26d | 1 | 0.67mi |
| 3270 Timber Crossing Ave Brandon, FL | 3.0 | 2.5 | 1674 | $2,500 | $1.49 | 26d | 1 | 0.74mi |
| 3235 Timber Crossing Ave Brandon, FL | 3.0 | 2.5 | 1667 | $2,500 | $1.50 | 16d | 1 | 0.75mi |
| 734 Sandy Creek Dr Brandon, FL | 4.0 | 2.0 | 1916 | $2,395 | $1.25 | 26d | 1 | 0.75mi |
| 4140 Spring Way Cir Valrico, FL | 4.0 | 2.0 | 2348 | $2,731 | $1.16 | 1d | 1 | 0.75mi |
| 4207 Elba Pl Valrico, FL | 3.0 | 2.0 | 1831 | $2,400 | $1.31 | 23d | 1 | 0.88mi |
| 4532 Preston Woods Dr Valrico, FL | 4.0 | 2.0 | 1788 | $2,295 | $1.28 | 26d | 1 | 0.92mi |
| 544 Emberwood Dr Brandon, FL | 4.0 | 2.0 | 2112 | $3,000 | $1.42 | 26d | 1 | 0.93mi |
| 1228 Lornewood Dr Valrico, FL | 4.0 | 2.0 | 2159 | $2,075 | $0.96 | 6d | 1 | 0.98mi |
| 3720 Hollow Wood Dr Valrico, FL | 4.0 | 2.0 | 2180 | $2,610 | $1.20 | 5d | 1 | 1.00mi |
| 1118 Hardwood Dr Valrico, FL | 3.0 | 2.0 | 1368 | $2,195 | $1.60 | 6d | 1 | 1.06mi |
| 1123 Bloom Hill Ave Valrico, FL | 4.0 | 2.0 | 1611 | $2,375 | $1.47 | 0d | 1 | 1.14mi |
| 3632 Cold Creek Dr Valrico, FL | 4.0 | 2.0 | 2379 | $2,750 | $1.16 | 6d | 1 | 1.16mi |
| 3039 Annadale Cir Brandon, FL | 4.0 | 2.0 | 1549 | $2,320 | $1.50 | 4d | 1 | 1.18mi |
| 1208 Tiger Wood Ct Valrico, FL | 3.0 | 2.0 | 1607 | $2,600 | $1.62 | 3d | 1 | 1.20mi |
| 2517 Clareside Dr Valrico, FL | 4.0 | 2.0 | 1881 | $2,769 | $1.47 | 4d | 1 | 1.25mi |
| 557 Rapid Falls Dr Brandon, FL | 3.0 | 2.0 | 1348 | $2,300 | $1.71 | 19d | 1 | 1.25mi |
| 2304 Golf Manor Blvd Valrico, FL | 4.0 | 3.0 | 2224 | $3,570 | $1.61 | 0d | 1 | 1.32mi |
| 2810 Manor Hill Dr Brandon, FL | 4.0 | 2.0 | 1649 | $2,279 | $1.38 | 3d | 1 | 1.36mi |
| 2709 Manor Hill Dr Brandon, FL | 3.0 | 2.0 | 1358 | $2,350 | $1.73 | 21d | 1 | 1.45mi |
HOA detail
- Monthly dues
- $10 · $120/yr
Listing history 7 events
-
2026-05-15$245,000 Active 403-char remark
-
2013-08-13soldstatus $165,000
-
2013-08-08soldstatus $165,000 309-char remark
Show marketing remark (309 chars)
This home is located in one of Hillsborough County's most sought after communities: Bloomingdale. This community has tennis courts, golfing, playground, parks and walking trails. It is the home of Alafia Grade School and Bloomingdale High School respectively. Hillsborough County has this as 3 BR. It is 4 BR.
-
2013-06-17$173,900 309-char remark
Show marketing remark (309 chars)
This home is located in one of Hillsborough County's most sought after communities: Bloomingdale. This community has tennis courts, golfing, playground, parks and walking trails. It is the home of Alafia Grade School and Bloomingdale High School respectively. Hillsborough County has this as 3 BR. It is 4 BR.
-
1994-09-02soldstatus $112,000
-
1992-05-01soldstatus $107,500
-
1988-06-01soldstatus $113,000
ⓘ Source: listings_history table (triggers on properties + properties_extension) + one-shot
backfill from property_details.listing_events for pre-trigger history.
Tax reassessment forecast FL · Resets to sale price
- Current annual tax
- $6,427 · $536/mo
- Projected year-2 tax
- $6,427 · $536/mo
- Expected delta
- $0/yr ($0/mo · 0.0%)
ⓘ Screening estimate from a state-policy table — verify with the county assessor before closing.
Climate risk First Street
- Flood 1/10 Low FEMA zone X · 0% chance over 30 yrs
- Wildfire 2/10 Low
- Heat 10/10 Extreme 7 d/yr ≥109°F today · 26 d/yr by 30 yrs out
- Wind 9/10 Extreme 99% chance of damaging wind over 30 yrs
- Air quality 4/10 Moderate 4 unhealthy d/yr today · 5 by 30 yrs out
Nearby sold comps map
Loading sold comps map…
Walkable amenities ~0.75 mi
Loading nearby amenities…
Taxation est. · year 1
- Rental income
- $33,968
- − Mortgage interest
- −$13,724
- − Property taxes
- −$6,427
- − Insurance
- −$1,225
- − Repairs & maintenance
- −$2,717
- − Management
- −$2,717
- − HOA
- −$120
- − Depreciation
- −$7,127
- Taxable loss
- −$90
- Est. tax savings @ 24.0%
- +$22
- After-tax cash flow
- $3,667/yr
For passive investors: Depreciation is non-cash, so a rental often shows a tax loss while cash-flowing — sheltering income. Rental losses are passive: they offset passive income freely, and up to $25,000/yr can offset ordinary (W-2) income if you actively participate and your MAGI is under $100k (phasing out to $0 by $150k); unused losses carry forward. On sale, claimed depreciation is recaptured at up to 25%, and gains may owe capital-gains tax (a 1031 exchange can defer both). Figures are a year-1 estimate at your 24.0% rate — not tax advice; consult a CPA.
Schools (NCES district)
- District
- Hillsborough
- NCES district ID
- 1200870
- Math proficiency
- 47% ▼ -8.00%
- Reading proficiency
- 50% ▼ -4.00%
- Median HH income
- $50,622
- Composite
- 41.6/100
- National rank
- #3435
- State rank
- #41 of 73 in FL
Livability — Bloomingdale
- Score
- 71/100
- State rank
- #383
- US rank
- #6757
Category grades
Schools grade is shown separately in the Schools card above.
Census & demographics
- Census place
- Bloomingdale, FL
- County
- Hillsborough County · 1,540,968 people
- Metro
- Tampa-St. Petersburg-Clearwater, FL
- Population (ZIP)
- 27,757
- Household income
- $116,465
- Rent vs Own
- Severe rent burden
- 437.0
Population outlook (Hillsborough County) Hauer SSP2
- Today (2025)
- 1,607,022 people
- By 2030
- 1,733,968 · +7.9%
- By 2040
- 1,979,565 · +23.2%
- By 2050
- 2,203,427 · +37.1%
- By 2075
- 2,667,893 · +66.0%
- By 2100
- 2,891,558 · +79.9%
Race, ethnicity, and origin ACS 2023
- Neighborhood character
- Predominantly White (67%)
- Race & ethnicity
- White 67% Hispanic / Latino 18% Two or more races 13% Black 8% Asian 2%
- Hispanic origin (detail)
- Mexican 1% Puerto Rican 11% Cuban 3%
- Common ancestry
- Romanian 3% Lithuanian 2% Italian 2%
- Foreign-born
- 9% · Canada, Jamaica
- Languages at home
- 86% English-only · Spanish 9% Other Indo-European 2% French/Haitian/Cajun 2%
Political lean MEDSL · Hillsborough
- 2024 margin
- Toss-up / Even · D 47.8% · R 50.9% · Other 1.3%
- 2008→2024 swing
- -10.2pp toward R · 2008: 7.1pp · 2024: -3.1pp
- All cycles
- 2024: R+3.1 2020: D+6.9 2016: D+6.8 2012: D+6.7 2008: D+7.1
Not yet ingested
- Civics
- —
Market trends
- HPI YoY
- ▼ -65.33%
- Current HPI
- 301.312
- Rent YoY
- ▲ 4.06%
- Metro
- Tampa-St. Petersburg-Clearwater, FL
- State GDP YoY
- ▲ 3.28%
- F500 in state
- 36
Industry mix (Fortune 500 HQ in FL)
| Industry | F500 HQs | Revenue |
|---|---|---|
| Industrial Technology | 2 | $29B |
|
||
| Insurance | 2 | $17B |
|
||
| Retail | 1 | $60B |
|
||
| Technology Distribution | 1 | $58B |
|
||
| Homebuilding | 1 | $35B |
|
||
| Technology Manufacturing | 1 | $35B |
|
||
Price history
+174.3% since first listed9 events — show timeline
- 2026-06-05 Sold (MLS) $310,000 Stellar MLS as Distributed by MLS Grid
- 2026-05-19 Pending — Stellar MLS as Distributed by MLS Grid
- 2026-05-15 Listed $245,000 Stellar MLS as Distributed by MLS Grid
- 2013-08-13 Sold (Public Records) $165,000 Public Records
- 2013-08-08 Sold (MLS) $165,000 Stellar MLS as Distributed by MLS Grid
- 2013-06-17 Listed $173,900 Stellar MLS as Distributed by MLS Grid
- 1994-09-02 Sold (Public Records) $112,000 Public Records
- 1992-05-01 Sold (Public Records) $107,500 Public Records
- 1988-06-01 Sold (Public Records) $113,000 Public Records
Property tax history
+9.9%/yrLatest (2025): $6,427 · +11.7% YoY. Source: county tax records.
Cash-flow waterfall
monthlySold comps — $/sqft
last 12 mo · ≤1 miLoading sold comps…