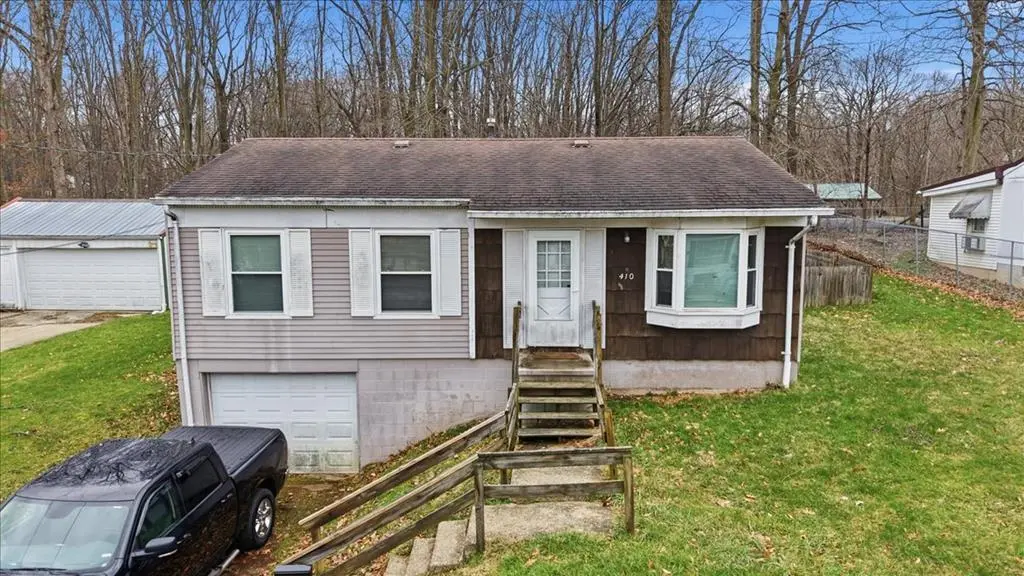
410 Birdcage Walk · Mansfield, OH
Flood risk 1/10 · Minimal
- FEMA flood zone
- X (unshaded)
- Chance of flooding over 30 yrs
- 0.0%
- Est. flood insurance / yr
- $473 – $860
Fire risk 1/10 · Minimal
- Est. fire insurance / yr
- $713 – $1,323
Heat risk 3/10 · Minor
- Hot days now (above 96°F)
- 7 days/yr
- Hot days in 30 yrs
- 17 days/yr
Wind risk 2/10 · Minimal
- Chance of severe wind over 30 yrs
- 0.0%
Air-quality risk 2/10 · Minimal
- Unhealthy air days now
- 1 days/yr
- Unhealthy air days in 30 yrs
- 1 days/yr
Risk factors via First Street. Map © Google.
Why this score? — see what drove the C- grade
The composite is a weighted blend of 9 inputs, each scored 0–100. Each bar is that input's sub-score; the figure is the points it added to the 100-point composite (weight × sub-score).
- Cash flow +20.2/30.0
- Appreciation +9.2/10.0
- DSCR +6.4/10.0
- 1% rule +4.2/10.0
- Livability +3.8/5.0
- Rent growth +2.5/5.0
- Condition / age +2.5/5.0
- Schools +2.3/10.0
- ARV discount +0.0/15.0
$109,900
🖨 Deal sheet (PDF) 📄 Offer letter ✓ Due diligence
Listing remarks
Welcome to 410 Birdcage Walk, a 3-bed, 1-bath raised ranch offering 992 sq ft in Mansfield City Schools. This home features vinyl plank flooring throughout the living room, kitchen & hallway and a bright, functional layout. The kitchen includes fridge & stove, and the main level offers a comfortable living space. Enjoy additional living space with a screened-in sunroom off the back, overlooking the fenced-in backyard. The lower level provides great potential for a rec room and includes a sump pump & water heater (2025) for added peace of mind. Additional highlights include vinyl windows throughout, a 1-car attached garage, and a concrete driveway. A great opportunity with
Key facts
- Vinyl windows
- Screened-in sunroom
- Fenced-in backyard
Tags
Neighborhood map
What this means for you Summary
Snapshot
- This is a 3-bed/1.0-bath single-family listed at $110k.
Deal economics
- At list price, monthly cash flow is $139 ($2k/yr) — positive.
- The deal already cash-flows at list — no discount required.
- To meet the 1% rule (rent ≥ 1% of price), the offer needs to be $101k (7.9% below list).
- Recommended offer: $101k (7.9% below list) — sets the bar for 1% rule.
- Cap rate 7.8% vs local median 4.2% in Mansfield — top-decile yield for the area; either an underpriced asset or a hidden risk that comps aren't pricing in. Stress-test before assuming the spread holds.
Location & tenants
- Location reads 76/100 on livability (#224 in OH, #3,525 nationally) — a middle-class / working-renter tenant base. Strengths: commute A+, cost of living A+, housing A+; Watch: crime D-, amenities D-, employment F.
- Mansfield City (urban): math 24% / reading 33% proficiency, ranked #590 of 656 in OH (top 90%) — low school quality limits family demand, transient renter base, plan for 1-2y turnover; 80% free/reduced lunch — lower-income household profile, screen leases tightly.
- Zoned schools: Malabar Intermediate School (math 17% / reading 29%, grade F, #1,233 of 1,584 statewide, top 78%, 762 students, 0% FRL); Mansfield Middle School (math 18% / reading 30%, grade F, #593 of 654 statewide, top 91%, 427 students, 0% FRL); Mansfield Senior High School (math 22% / reading 32%, grade F, #632 of 781 statewide, top 81%, 815 students, 0% FRL) — zoned schools average 0% FRL vs 80% district-wide (80 pts lower); this property's tenant base skews higher-income than the district average.
- Market conditions: 31 active listings in the ZIP; 5 comparable units currently listed for rent nearby; rentals lingering (median 46d on market — plan ~5-8 weeks vacancy on turnover, expect pricing pressure); 100% of comp listings sitting > 30 days — soft ceiling on asking rent; lower-income renter base — watch delinquency; 145 units permitted in Richland County in 2024 (0 in 5+ unit buildings).
- This rent runs 38% of the median local income ($32k/yr) — at the standard rent-burdened threshold; future hikes will face affordability resistance.
Forward outlook
- In year one you build about $10k of equity ($760 loan paydown + $9k appreciation (8.4% local appreciation)).
- Richland County population projected at -18% by 2050 — secular population decline; favor cash flow + early exit over multi-decade hold.
- At projected returns (8.4% appreciation + 3.0% rent growth), your $31k cash investment doubles in ~3 years — after that, you're playing with house money.
- By year 4, paydown + projected appreciation supports a ~$35k cash-out refi (75% LTV) — recoverable capital for the next deal without selling this one.
Negotiation context
- Only 6 days on market — expect competitive offers; lowballing is unlikely to land.
Questions for the listing agent
- Built in 1971 — when were the roof, HVAC, electrical panel, plumbing, and water heater last replaced?
- Is there a deadline driving the sale (1031 exchange, divorce, estate, relocation)? That informs how much negotiation room exists.
- Crime grade is D in this area — have there been break-ins, vandalism, or insurance claims at this property in the last 3 years? What carrier currently insures it and at what premium?
- What's the average days-on-market for RENTAL listings here right now (not sales)? A rising rental-DOM trend means longer vacancies and softer asking-rent achievability than the comps imply.
- What's the recent tenant-quality profile in this submarket — average credit score on applications, eviction rate, late-payment / NSF rate, and stable-employment percentage? A property-management company in the area should have these aggregated.
- How much new for-sale + rental construction is in the pipeline within 1–3 miles? Heavy new supply typically softens prices + rents 12–24 months out; constrained supply supports both.
Investment metrics
- 1% rule
- 0.92% ✗
- Cap rate
- 7.81%
- Cash-on-cash
- 5.42%
- DSCR
- 1.24
- GRM
- 9.0
CMA / ARV
- ARV (on-the-fly)
- $90,272
- Comps found
- 12
Show comp detail 12 sales within ~0.75 mi
| Address | Dist | Beds/Ba | Sqft | Sold | Price | $/sf | Match |
|---|---|---|---|---|---|---|---|
| 410 Birdcage Walk | 0.00mi | 3/1.0 | 992 (0%) | 1mo | $90,000 | $91 | 100 |
| 260 Dale Ave | 0.28mi | 3/1.0 | 1,008 (+2%) | 2mo | $65,000 | $64 | 82 |
| 323 E 1st St | 0.46mi | 2/1.0 (-1) | 984 (-1%) | 3mo | $148,000 | $150 | 70 |
| 309 Superior St | 0.41mi | 3/1.0 | 986 (-1%) | 12mo | $49,000 | $50 | 70 |
| 353 Home Ave | 0.19mi | 3/1.0 | 864 (-13%) | 6mo | $129,900 | $150 | 64 |
| 302 E First St | 0.46mi | 3/1.0 | 973 (-2%) | 13mo | $77,000 | $79 | 64 |
| 148 Dale Ave | 0.50mi | 2/1.0 (-1) | 988 (-0%) | 11mo | $58,000 | $59 | 62 |
| 445 Luther St | 0.42mi | 2/1.0 (-1) | 936 (-6%) | 13mo | $120,000 | $128 | 55 |
| 223 Reform St | 0.54mi | 3/1.0 | 1,092 (+10%) | 8mo | $135,000 | $124 | 51 |
| 273 Hammond Ave | 0.68mi | 3/1.0 | 1,092 (+10%) | 3mo | $134,900 | $124 | 49 |
| 146 E 1st St | 0.64mi | 3/1.5 | 1,112 (+12%) | 1mo | $41,000 | $37 | 47 |
| 606 Woodville Rd | 0.58mi | 2/1.0 (-1) | 854 (-14%) | 14mo | $51,500 | $60 | 34 |
Match score weights: distance 35% · size 25% · config 20% · recency 20%. Top-matched comps best support the ARV.
Projected returns pro-forma
8.45% appreciation · 3.0% rent growth · sell at horizon
- IRR
- 25.1%
- Equity multiple
- 2.86×
- Total profit
- $57,277
- Equity at exit
- $86,894
- IRR
- 22.5%
- Equity multiple
- 6.19×
- Total profit
- $159,727
- Equity at exit
- $175,831
Cash invested: $30,772 (down + closing). Projections, not guarantees.
Landlord ↔ Tenant lean methodology
- Overall (STATE)
- 73 Landlord-Friendly
- State Ohio
- 73 Landlord-Friendly · R+6
- County
- — inherits STATE
- City
- — inherits STATE
ZIP-level market 44902
- Home prices YoY
- 2.9%
- Active inventory
- 31
- Price-to-rent
- 9.0×
Monthly cashflow live
- Estimated rent
- $1,012 high interval (Pro) →
- Mortgage (P&I)
- −$576
- Tax from tax record
- −$38 /mo · $460/yr
- Insurance
- −$46
- HOA
- −$0
- Vacancy / Maint / Mgmt
- −$213
- Net cashflow
- $139
Break-even live
Sensitivity live
| Price | -10% $201 | -5% $170 | +0% $139 | +5% $108 | +10% $77 |
|---|---|---|---|---|---|
| Rent | -10% $59 | -5% $99 | +0% $139 | +5% $179 | +10% $219 |
| Rate | -1.0pp $194 | -0.5pp $167 | base $139 | +0.5pp $111 | +1.0pp $82 |
UW: 25.0% down · 7.5% · 30yr · 1.5% tax · 5.0% vac · 8.0% maint · 8.0% mgmt
Financing live
Cash to close
- Down payment
- $27,475
- Closing costs
- $3,297
- Reserves months
- —
- Total cash needed
- —
Loan-product check · same deal, 3 products live
Conventional
25% down · 7.5% · 30yr
- Down + closing
- —
- Monthly P&I
- —
- Monthly cashflow
- —
- DSCR
- —
- Eligible?
- —
Personal DTI + credit; lowest rate.
DSCR
20% down · 8.5% · 30yr
- Down + closing
- —
- Monthly P&I
- —
- Monthly cashflow
- —
- DSCR
- —
- Eligible?
- —
No personal income docs; deal must DSCR.
Hard money
10% down · 12.0% · 12mo
- Down + closing
- —
- Monthly P&I
- —
- Monthly cashflow
- —
- DSCR
- —
- Eligible?
- —
Short-term bridge; refi at stabilization.
Rent comps 5 comps
| Address | Beds | Baths | Sqft | Rent | $/sqft | DOM | Units | Dist |
|---|---|---|---|---|---|---|---|---|
| 19 State St Mansfield, OH | 3.0 | 1.0 | 1040 | $995 | $0.96 | 45d | 1 | 0.83mi |
| 282 Cliffbrook Dr Mansfield, OH | 3.0 | 1.0 | 912 | $1,395 | $1.53 | 45d | 1 | 0.84mi |
| 100 Winwood Dr Mansfield, OH | 2.0 | 1.0 | 700 | $725 | $1.04 | 45d | 1 | 1.11mi |
| 135 E Cook Rd Mansfield, OH | 1.0–2.0 | 1.0 | 554 | $850 | $1.53 | 45d | 10 | 1.14mi |
| 896 Brookfield Dr Mansfield, OH | 2.0 | 1.0 | 770 | $795 | $1.03 | 45d | 1 | 1.24mi |
Listing history 2 events
-
2026-03-30status Pending
-
2026-03-24$109,900 Active
ⓘ Source: listings_history table (triggers on properties + properties_extension) + one-shot
backfill from property_details.listing_events for pre-trigger history.
Tax reassessment forecast OH · Partial reset (capped growth)
- Current annual tax
- $460 · $38/mo
- Projected year-2 tax
- $1,087 · $91/mo
- Expected delta
- +$627/yr (+$52/mo · 136.3%)
ⓘ Screening estimate from a state-policy table — verify with the county assessor before closing.
Climate risk First Street
- Flood 1/10 Low FEMA zone X (unshaded) · 0% chance over 30 yrs
- Wildfire 1/10 Low
- Heat 3/10 Moderate 7 d/yr ≥96°F today · 17 d/yr by 30 yrs out
- Wind 2/10 Low 0% chance of damaging wind over 30 yrs
- Air quality 2/10 Low 1 unhealthy d/yr today · 1 by 30 yrs out
Nearby sold comps map
Loading sold comps map…
Walkable amenities ~0.75 mi
Loading nearby amenities…
Taxation est. · year 1
- Rental income
- $12,144
- − Mortgage interest
- −$6,156
- − Property taxes
- −$460
- − Insurance
- −$550
- − Repairs & maintenance
- −$972
- − Management
- −$972
- − Depreciation
- −$3,197
- Taxable loss
- −$162
- Est. tax savings @ 24.0%
- +$39
- After-tax cash flow
- $1,707/yr
For passive investors: Depreciation is non-cash, so a rental often shows a tax loss while cash-flowing — sheltering income. Rental losses are passive: they offset passive income freely, and up to $25,000/yr can offset ordinary (W-2) income if you actively participate and your MAGI is under $100k (phasing out to $0 by $150k); unused losses carry forward. On sale, claimed depreciation is recaptured at up to 25%, and gains may owe capital-gains tax (a 1031 exchange can defer both). Figures are a year-1 estimate at your 24.0% rate — not tax advice; consult a CPA.
Schools (NCES district)
- District
- Mansfield City
- NCES district ID
- 3904429
- Math proficiency
- 24% ▼ -19.00%
- Reading proficiency
- 33% ▼ -12.00%
- Median HH income
- $32,435
- Composite
- 23.25/100
- National rank
- #7934
- State rank
- #590 of 656 in OH
Livability — Mansfield
- Score
- 76/100
- State rank
- #224
- US rank
- #3525
Category grades
Schools grade is shown separately in the Schools card above.
Census & demographics
- Census place
- Mansfield, OH
- County
- Richland · 128,966 people
- City population
- 16,349
- Metro
- Mansfield, OH
- Population (ZIP)
- 4,876
- Household income
- $31,619
- Rent vs Own
- Severe rent burden
- 13.2
Population outlook (Richland County) Hauer SSP2
- Today (2025)
- 115,577 people
- By 2030
- 111,669 · -3.4%
- By 2040
- 103,323 · -10.6%
- By 2050
- 95,135 · -17.7%
- By 2075
- 76,719 · -33.6%
- By 2100
- 57,188 · -50.5%
Race, ethnicity, and origin ACS 2023
- Neighborhood character
- Diverse neighborhood (Simpson 0.61)
- Race & ethnicity
- White 52% Black 35% Two or more races 10% Hispanic / Latino 5%
- Common ancestry
- Italian 2% Serbian 2% Iranian 1%
- Foreign-born
- 1% · Canada
- Languages at home
- 95% English-only · Spanish 4% Other Indo-European 1%
Political lean MEDSL · Richland
- 2024 margin
- Solid R (+42.3) · D 28.4% · R 70.8%
- 2008→2024 swing
- -28.8pp toward R · 2008: -13.6pp · 2024: -42.3pp
- All cycles
- 2024: R+42.3 2020: R+39.7 2016: R+37.5 2012: R+20.1 2008: R+13.6
Not yet ingested
- Civics
- —
Market trends
- HPI YoY
- ▲ 8.45%
- Current HPI
- 302.035
- Rent YoY
- —
- Metro
- —
- State GDP YoY
- ▲ 1.98%
- F500 in state
- 48
Industry mix (Fortune 500 HQ in OH)
| Industry | F500 HQs | Revenue |
|---|---|---|
| Insurance | 3 | $145B |
|
||
| Industrial Machinery | 3 | $49B |
|
||
| Financial Services | 3 | $24B |
|
||
| Consumer Goods | 2 | $93B |
|
||
| Aerospace / Defense | 2 | $47B |
|
||
| Utilities | 2 | $33B |
|
||
Price history
2 events — show timeline
- 2026-03-30 Pending — MARMLS
- 2026-03-24 Listed $109,900 MARMLS
Property tax history
+7.6%/yrLatest (2025): $460 · +0.0% YoY. Source: county tax records.
Cash-flow waterfall
monthlySold comps — $/sqft
last 12 mo · ≤1 miLoading sold comps…