 🏷️ Likely Rental
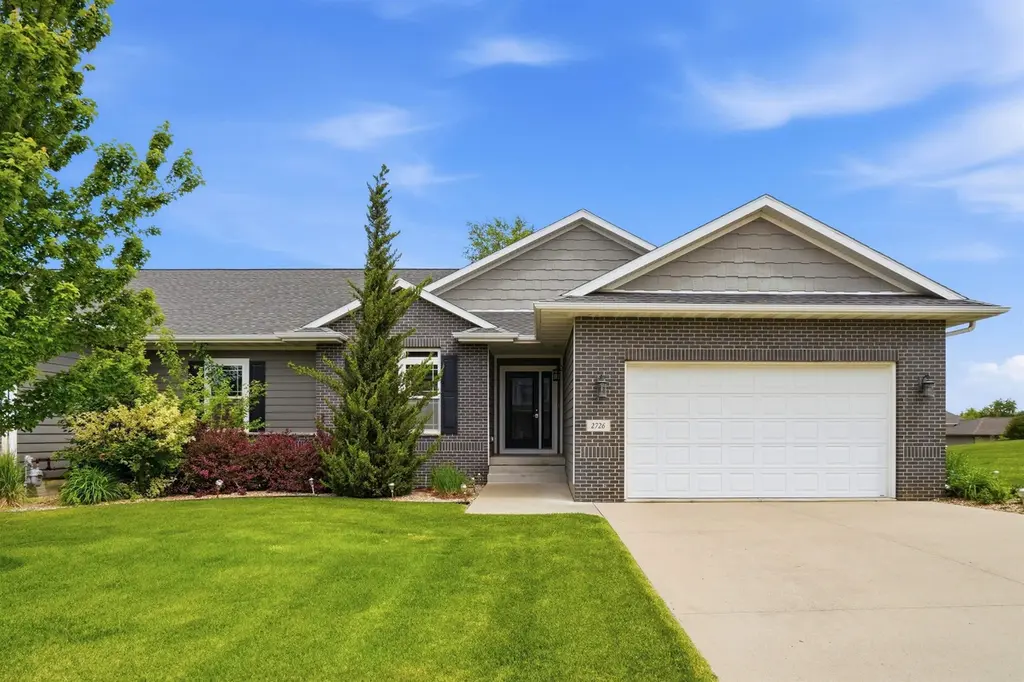
2726 Northview Ln · Cedar Falls, IA
Flood risk 1/10 · Minimal
- FEMA flood zone
- X (unshaded)
- Chance of flooding over 30 yrs
- 0.0%
- Est. flood insurance / yr
- $473 – $860
Fire risk 3/10 · Minor
- Est. fire insurance / yr
- $902 – $1,676
Heat risk 3/10 · Minor
- Hot days now (above 101°F)
- 7 days/yr
- Hot days in 30 yrs
- 15 days/yr
Wind risk 2/10 · Minimal
- Chance of severe wind over 30 yrs
- —
Air-quality risk 1/10 · Minimal
- Unhealthy air days now
- 0 days/yr
- Unhealthy air days in 30 yrs
- 0 days/yr
Risk factors via First Street. Map © Google.
Why this score? — see what drove the D+ grade
The composite is a weighted blend of 9 inputs, each scored 0–100. Each bar is that input's sub-score; the figure is the points it added to the 100-point composite (weight × sub-score).
- Cash flow +15.0/30.0
- ARV discount +7.5/15.0
- Schools +6.6/10.0
- 1% rule +5.0/10.0
- DSCR +5.0/10.0
- Livability +4.0/5.0
- Rent growth +3.0/5.0
- Condition / age +2.5/5.0
- Appreciation +0.0/10.0
$2,800
🖨 Deal sheet 📄 Offer letter ✓ Due diligence
Listing remarks
LOOKING FOR LOCATION , QUALITY AND EASE OF LIVING? Check out this "FOR LEASE ONLY" 3 bedroom 3 bath, double garage home with high end finishes, spacious open floorplan and fully finished lower level with expansive rec room/ game room and full bar area, perfect for entertaining ! Enjoy the exquisite main level primary suite with dual sinks, and walk-in closet. Added bonus is the pool/clubhouse amenities for outdoor activities, all situated in the established and high demand RIDGES SUBDIVISION. Main level laundry, all appliances included. Immediate possession!
Key facts
- Full bar area
- High end finishes
- Expansive rec room
Tags
Property features AI
Finance
- HOA & community: Homeowners association with an annual fee of $500 (about $41.67/month)
Exterior
- Parking: Attached garage; Carport with 2 spaces
- Utilities: Public water; Public sewer
- Home design: Single-family residence; Residential property
- Construction: Shingle (asphalt) roof; Below-grade finished living area
- Exterior features: Concrete road/drive surface; Lot dimensions approximately 90 x 84; Subdivision: The Ridges; Zoned R-2
Interior
- Kitchen: Dishwasher; Disposal; Refrigerator
- Bathrooms: Three full bathrooms
- Heating & cooling: Central air conditioning; Forced air heating; Natural gas heating
- Interior features: Crown molding; Pantry; Wet bar; Finished basement with sump pump; Fireplace in family room
- Laundry & utility: Main-level laundry room; Washer; Dryer; Gas water heater; Water softener
Neighborhood map
What this means for you Summary
Snapshot
- This is a 3-bed/3.0-bath single-family listed at $3k.
Deal economics
- At list price, monthly cash flow is $1k ($15k/yr) — positive.
- The deal already cash-flows at list — no discount required.
- Meets the 1% rule at list price ($2k rent vs $3k).
- Recommended offer: $3k (1.5% below list) — sets the bar for market timing.
- Cap rate 544.7% vs local median 3.1% in Cedar Falls — top-decile yield for the area; either an underpriced asset or a hidden risk that comps aren't pricing in. Stress-test before assuming the spread holds.
Location & tenants
- Location reads 81/100 on livability (#60 in IA, #1,357 nationally) — a professional / high-income tenant draw. Strengths: cost of living A+, housing A+, health & safety A+; Watch: amenities D, commute F.
- Cedar Falls Community School District (urban): math 76% / reading 79% proficiency, ranked #45 of 289 in IA (top 16%) — strong family-tenant draw, lease renewals of 3-5y typical; only 18% free/reduced lunch — higher-income household profile.
- Zoned schools: Helen A Hansen Elementary School (math 84% / reading 87%, grade A+, #28 of 616 statewide, top 5%, 591 students, 16% FRL); Holmes Junior High School (math 79% / reading 78%, grade A+, #44 of 246 statewide, top 19%, 639 students, 28% FRL); Cedar Falls High School (math 74% / reading 78%, grade A-, #75 of 336 statewide, top 23%, 1,302 students, 24% FRL).
- Market conditions: Rents rising (+2.0%/yr); 387 active listings in the ZIP; solid renter incomes; 287 units permitted in Black Hawk County in 2024 (67 in 5+ unit buildings).
Forward outlook
- Local home prices are declining (-3.0%/yr); year-one equity from $19 of loan paydown is wiped out by about $84 of value loss. Plan a longer hold.
- Black Hawk County population projected at +10% by 2050 — modest demand growth; plan on rents tracking national, not racing it.
- At projected returns (-3.0% appreciation + 2.0% rent growth), your $784 cash investment doubles in ~1 year — after that, you're playing with house money.
Negotiation context
- It's been on market 20 days — a 2% lower offer ($3k) is reasonable based on typical stale-listing flexibility.
Questions for the listing agent
- What does the HOA fee cover, when was the last increase, and are there any pending special assessments or reserve-fund shortfalls?
- Is there a deadline driving the sale (1031 exchange, divorce, estate, relocation)? That informs how much negotiation room exists.
- Schools are A-rated — typically a magnet for longer-tenancy family renters. What's the average tenant stay here, and is there a school-zone premium baked into asking?
- The area grade is low — what's the realistic commute time and amenity access for the typical tenant pool here? Any planned neighborhood developments (good or bad) we should know about?
- What's the average days-on-market for RENTAL listings here right now (not sales)? A rising rental-DOM trend means longer vacancies and softer asking-rent achievability than the comps imply.
- What's the recent tenant-quality profile in this submarket — average credit score on applications, eviction rate, late-payment / NSF rate, and stable-employment percentage? A property-management company in the area should have these aggregated.
- How much new for-sale + rental construction is in the pipeline within 1–3 miles? Heavy new supply typically softens prices + rents 12–24 months out; constrained supply supports both.
Investment metrics
- 1% rule
- 59.56% ✓
- Cap rate
- 544.67%
- Cash-on-cash
- 1922.77%
- DSCR
- 86.55
- GRM
- 0.1
CMA / ARV
- ARV (on-the-fly)
- $378,900
- Comps found
- 12
Show comp detail 12 sales within ~0.75 mi
| Address | Dist | Beds/Ba | Sqft | Sold | Price | $/sf | Match |
|---|---|---|---|---|---|---|---|
| 916 Oak Park Blvd | 0.38mi | 3/2.5 | 2,392 (-5%) | 5mo | $375,000 | $157 | 67 |
| 928 Lakeview Dr | 0.12mi | 4/3.5 (+1) | 2,786 (+10%) | 13mo | $417,000 | $150 | 60 |
| 18 River Ridge Rd | 0.61mi | 4/2.0 (+1) | 2,460 (-3%) | 11mo | $436,000 | $177 | 49 |
| 2701 Minnetonka Dr | 0.30mi | 4/2.5 (+1) | 2,818 (+12%) | 14mo | $345,000 | $122 | 48 |
| 2927 Apollo St | 0.66mi | 4/3.0 (+1) | 2,551 (+1%) | 19mo | $439,900 | $172 | 46 |
| 132 River Ridge Rd | 0.51mi | 4/3.0 (+1) | 2,677 (+6%) | 18mo | $396,000 | $148 | 46 |
| 1221 Oak Park Blvd | 0.40mi | 4/3.0 (+1) | 2,192 (-13%) | 11mo | $325,000 | $148 | 45 |
| 1916 Cottage Row Rd | 0.55mi | 3/2.5 | 2,736 (+8%) | 19mo | $500,000 | $183 | 43 |
| 113 Cedar Crest Dr | 0.69mi | 4/2.5 (+1) | 2,420 (-4%) | 14mo | $305,000 | $126 | 42 |
| 114 Parkgate Rd | 0.65mi | 3/2.5 | 2,160 (-14%) | 2mo | $314,900 | $146 | 42 |
| 905 Oak Park Blvd | 0.42mi | 4/3.0 (+1) | 2,900 (+15%) | 11mo | $515,000 | $178 | 42 |
| 209 Parkgate Rd | 0.69mi | 4/3.0 (+1) | 2,328 (-8%) | 18mo | $316,000 | $136 | 34 |
Match score weights: distance 35% · size 25% · config 20% · recency 20%. Top-matched comps best support the ARV.
Projected returns pro-forma
-3.0% appreciation · 1.97% rent growth · sell at horizon
- IRR
- —
- Equity multiple
- 100.36×
- Total profit
- $77,895
- Equity at exit
- $417
- IRR
- —
- Equity multiple
- 210.42×
- Total profit
- $164,184
- Equity at exit
- $242
Cash invested: $784 (down + closing). Projections, not guarantees.
Landlord ↔ Tenant lean methodology
- Overall (STATE)
- 83 Strongly Landlord-Friendly
- State Iowa
- 83 Strongly Landlord-Friendly · R+6
- County
- — inherits STATE
- City
- — inherits STATE
ZIP-level market 50613
- Rents YoY
- 2.0%
- Active inventory
- 387
- Price-to-rent
- 0.1×
Monthly cashflow live
- Estimated rent
- $1,668 medium interval (Pro) →
- Mortgage (P&I)
- −$15
- Tax est. 1.5%
- −$4 /mo · $42/yr
- Insurance
- −$1
- HOA
- −$42
- Vacancy / Maint / Mgmt
- −$350
- Net cashflow
- $1,256
Break-even live
UW: 25.0% down · 7.5% · 30yr · 1.5% tax · 5.0% vac · 8.0% maint · 8.0% mgmt
Financing live
Cash to close
- Down payment
- $700
- Closing costs
- $84
- Reserves months
- —
- Total cash needed
- —
Loan-product check · same deal, 3 products live
Conventional
25% down · 7.5% · 30yr
- Down + closing
- —
- Monthly P&I
- —
- Monthly cashflow
- —
- DSCR
- —
- Eligible?
- —
Personal DTI + credit; lowest rate.
DSCR
20% down · 8.5% · 30yr
- Down + closing
- —
- Monthly P&I
- —
- Monthly cashflow
- —
- DSCR
- —
- Eligible?
- —
No personal income docs; deal must DSCR.
Hard money
10% down · 12.0% · 12mo
- Down + closing
- —
- Monthly P&I
- —
- Monthly cashflow
- —
- DSCR
- —
- Eligible?
- —
Short-term bridge; refi at stabilization.
HOA detail
- Monthly dues
- $42 · $504/yr
- Likely covers
- pool
Listing history 18 events
-
2026-06-19days on market $2,800 Active 20 DOM
-
2026-06-18days on market $2,800 Active 19 DOM
-
2026-06-17days on market $2,800 Active 18 DOM
-
2026-06-16days on market $2,800 Active 17 DOM
-
2026-06-15days on market $2,800 Active 16 DOM
-
2026-06-14days on market $2,800 Active 14 DOM
-
2026-06-13days on market $2,800 Active 13 DOM
-
2026-06-10days on market $2,800 Active 11 DOM
-
2026-06-09days on market $2,800 Active 10 DOM
-
2026-06-08days on market $2,800 Active 9 DOM
-
2026-06-07days on market $2,800 Active 8 DOM
-
2026-06-05days on market $2,800 Active 5 DOM
-
2026-06-03days on market $2,800 Active 4 DOM
-
2026-06-02days on market $2,800 Active 3 DOM
-
2026-06-01days on market $2,800 Active 2 DOM
-
2026-05-31remarks 568-char remark
-
2026-05-30remarks 550-char remark
-
2026-05-30$2,800 Active 1 DOM
ⓘ Source: listings_history table (triggers on properties + properties_extension) + one-shot
backfill from property_details.listing_events for pre-trigger history.
Climate risk First Street
- Flood 1/10 Low FEMA zone X (unshaded) · 0% chance over 30 yrs
- Wildfire 3/10 Moderate
- Heat 3/10 Moderate 7 d/yr ≥101°F today · 15 d/yr by 30 yrs out
- Wind 2/10 Low
- Air quality 1/10 Low 0 unhealthy d/yr today · 0 by 30 yrs out
Nearby sold comps map
Loading sold comps map…
Walkable amenities ~0.75 mi
Loading nearby amenities…
Taxation est. · year 1
- Rental income
- $20,014
- − Mortgage interest
- −$157
- − Property taxes
- −$42
- − Insurance
- −$14
- − Repairs & maintenance
- −$1,601
- − Management
- −$1,601
- − HOA
- −$504
- − Depreciation
- −$81
- Taxable income
- $16,013
- Est. tax owed @ 24.0%
- −$3,843
- After-tax cash flow
- $11,231/yr
For passive investors: Depreciation is non-cash, so a rental often shows a tax loss while cash-flowing — sheltering income. Rental losses are passive: they offset passive income freely, and up to $25,000/yr can offset ordinary (W-2) income if you actively participate and your MAGI is under $100k (phasing out to $0 by $150k); unused losses carry forward. On sale, claimed depreciation is recaptured at up to 25%, and gains may owe capital-gains tax (a 1031 exchange can defer both). Figures are a year-1 estimate at your 24.0% rate — not tax advice; consult a CPA.
Schools (NCES district)
- District
- Cedar Falls Community School District
- NCES district ID
- 1906510
- Math proficiency
- 76% ▼ -6.00%
- Reading proficiency
- 79% ▼ -2.00%
- Median HH income
- $53,634
- Composite
- 65.93/100
- National rank
- #443
- State rank
- #45 of 289 in IA
Livability — Cedar Falls
- Score
- 81/100
- State rank
- #60
- US rank
- #1357
Category grades
Schools grade is shown separately in the Schools card above.
Census & demographics
- Census place
- Cedar Falls, IA
- County
- Black Hawk County · 112,933 people
- City population
- 43,867
- Metro
- Waterloo-Cedar Falls, IA
- Population (ZIP)
- 43,867
- Household income
- $78,503
- Rent vs Own
- Severe rent burden
- 1514.0
Population outlook (Black Hawk County) Hauer SSP2
- Today (2025)
- 139,716 people
- By 2030
- 142,853 · +2.2%
- By 2040
- 147,843 · +5.8%
- By 2050
- 153,247 · +9.7%
- By 2075
- 167,977 · +20.2%
- By 2100
- 177,320 · +26.9%
Race, ethnicity, and origin ACS 2023
- Neighborhood character
- Predominantly White (90%)
- Race & ethnicity
- White 90% Asian 3% Two or more races 3% Hispanic / Latino 3% Black 1%
- Common ancestry
- Portuguese 6% Italian 3% Iranian 3%
- Foreign-born
- 4% · Canada, South Korea
- Languages at home
- 95% English-only · Spanish 2% Russian/Polish/Slavic 1% Other Indo-European 1%
Political lean MEDSL · Black Hawk
- 2024 margin
- Toss-up / Even · D 50.0% · R 48.8% · Other 1.2%
- 2008→2024 swing
- -21.3pp toward R · 2008: 22.4pp · 2024: 1.2pp
- All cycles
- 2024: D+1.2 2020: D+9.0 2016: D+7.3 2012: D+20.0 2008: D+22.4
Not yet ingested
- Civics
- —
Market trends
- HPI YoY
- ▼ -175.51%
- Current HPI
- 169.0591
- Rent YoY
- ▲ 1.97%
- Metro
- Waterloo-Cedar Falls, IA
- State GDP YoY
- ▲ 2.48%
- F500 in state
- 4
Industry mix (Fortune 500 HQ in IA)
| Industry | F500 HQs | Revenue |
|---|---|---|
| Financial Services | 1 | $16B |
|
||
| Retail / Convenience | 1 | $15B |
|
||
Price history
1 event — show timeline
- 2026-05-29 Listed $2,800 NEIRBR as distributed by MLS GRID
Cash-flow waterfall
monthlySold comps — $/sqft
last 12 mo · ≤1 miLoading sold comps…