4028 Avenue N 1/2 · Santa Fe, TX
Flood risk 1/10 · Minimal
- FEMA flood zone
- X (unshaded)
- Chance of flooding over 30 yrs
- 0.0%
- Est. flood insurance / yr
- $507 – $1,088
Fire risk 2/10 · Minimal
- Est. fire insurance / yr
- $1,222 – $2,270
Heat risk 10/10 · Severe
- Hot days now (above 110°F)
- 7 days/yr
- Hot days in 30 yrs
- 26 days/yr
Wind risk 9/10 · Severe
- Chance of severe wind over 30 yrs
- 99.0%
Air-quality risk 2/10 · Minimal
- Unhealthy air days now
- 1 days/yr
- Unhealthy air days in 30 yrs
- 1 days/yr
Risk factors via First Street. Map © Google.
Why this score? — see what drove the D+ grade
The composite is a weighted blend of 9 inputs, each scored 0–100. Each bar is that input's sub-score; the figure is the points it added to the 100-point composite (weight × sub-score).
- Cash flow +15.0/30.0
- ARV discount +11.7/15.0
- 1% rule +5.0/10.0
- DSCR +5.0/10.0
- Schools +3.5/10.0
- Livability +3.4/5.0
- Rent growth +2.5/5.0
- Condition / age +2.5/5.0
- Appreciation +0.0/10.0
$195,000
🖨 Deal sheet 📄 Offer letter ✓ Due diligence
Listing remarks MLS
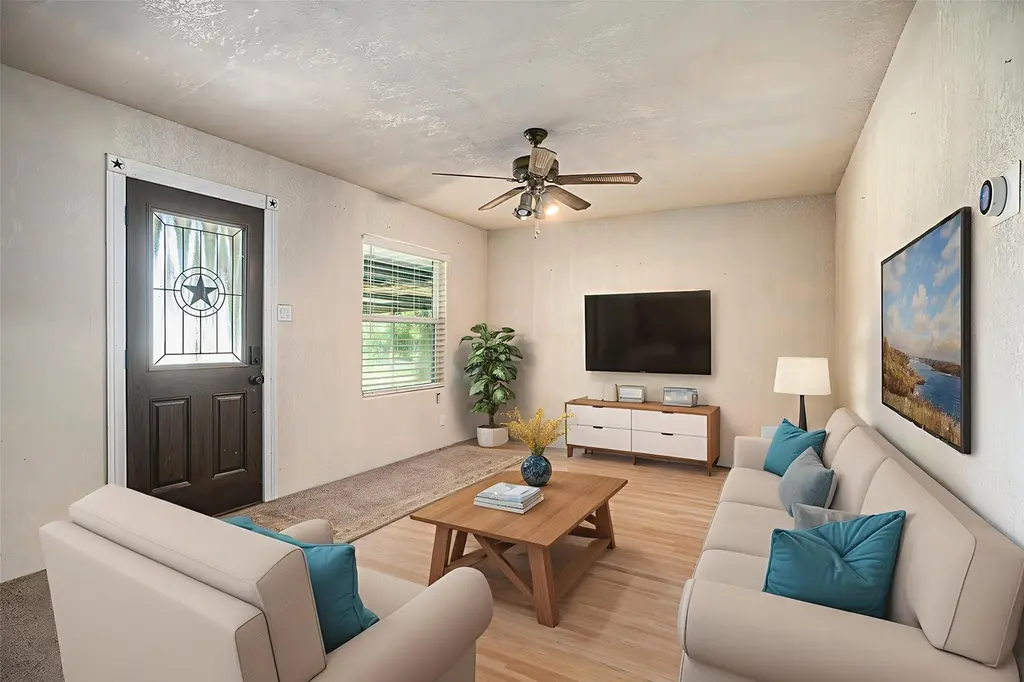
This home features a comfortable layout with a spacious living area that flows into the kitchen and dining space, creating a practical setup for everyday living. The kitchen offers ample cabinet and counter space for cooking and storage. The bedrooms provide flexibility for a variety of needs, whether for sleeping, a home office, or additional living space. Conveniently located near local amenities and major roadways, the property offers easy access to everyday essentials.
Key facts
- Spacious living area
- Covered patio
- Ample cabinet space
Tags
Neighborhood map
What this means for you Summary
Snapshot
- This is a 3-bed/2.0-bath single-family listed at $195k.
Deal economics
- At list price, monthly cash flow is $52k ($627k/yr) — positive.
- The deal already cash-flows at list — no discount required.
- Meets the 1% rule at list price ($68k rent vs $195k).
- Cap rate 327.9% vs local median 4.5% in Santa Fe — top-decile yield for the area; either an underpriced asset or a hidden risk that comps aren't pricing in. Stress-test before assuming the spread holds.
Location & tenants
- Location reads 67/100 on livability (#550 in TX) — a middle-class / working-renter tenant base. Strengths: crime A+, cost of living A+, housing A+; Watch: amenities F, commute F, health & safety F.
- Santa Fe ISD (suburban): math 38% / reading 39% proficiency, ranked #385 of 826 in TX (top 47%) — families likely to look elsewhere, expect single-tenant / working-renter base with shorter leases.
- Market conditions: 233 active listings in the ZIP; 2 comparable units currently listed for rent nearby; 3,258 units permitted in Galveston County in 2024 (0 in 5+ unit buildings).
Forward outlook
- Local home prices are declining (-3.0%/yr); year-one equity from $1k of loan paydown is wiped out by about $6k of value loss. Plan a longer hold.
- Galveston County population projected at +43% by 2050 — long-run rental-demand tailwind backs the buy-and-hold thesis.
- At projected returns (-3.0% appreciation + 3.0% rent growth), your $55k cash investment doubles in ~1 year — after that, you're playing with house money.
Negotiation context
- Only 8 days on market — expect competitive offers; lowballing is unlikely to land.
- 5 sale attempts since 14y ago; this cycle's ask has dropped $15k (7%) from the opening price — seller is motivated, your offer sets the floor, not the list.
Risks & watch-outs
- Watch-outs: built in 1925 — expect roof / HVAC / electrical / plumbing capex.
- Climate carrying-cost: severe wind risk, 99% chance of damaging wind over 30y; extreme-heat days projected 7→26/yr by 2055 (HVAC capex compounding) — expect insurance premiums to compound above CPI over the hold.
Questions for the listing agent
- Built in 1925 — when were the roof, HVAC, electrical panel, plumbing, and water heater last replaced?
- Is there a deadline driving the sale (1031 exchange, divorce, estate, relocation)? That informs how much negotiation room exists.
- The area grade is low — what's the realistic commute time and amenity access for the typical tenant pool here? Any planned neighborhood developments (good or bad) we should know about?
- What's the average days-on-market for RENTAL listings here right now (not sales)? A rising rental-DOM trend means longer vacancies and softer asking-rent achievability than the comps imply.
- What's the recent tenant-quality profile in this submarket — average credit score on applications, eviction rate, late-payment / NSF rate, and stable-employment percentage? A property-management company in the area should have these aggregated.
- How much new for-sale + rental construction is in the pipeline within 1–3 miles? Heavy new supply typically softens prices + rents 12–24 months out; constrained supply supports both.
Investment metrics
- 1% rule
- 34.83% ✓
- Cap rate
- 327.88%
- Cash-on-cash
- 1148.52%
- DSCR
- 52.10
- GRM
- 0.2
CMA / ARV
- ARV (median comp)
- $215,000
- List price
- $195,000
- Delta
- -2.33%
- Verdict
- FAIR
- Comps
- 20 within 1.0 mi
Show comp detail 3 sales within ~0.75 mi
| Address | Dist | Beds/Ba | Sqft | Sold | Price | $/sf | Match |
|---|---|---|---|---|---|---|---|
| 12732 7th St | 0.13mi | 2/1.5 (-1) | 940 (-8%) | 7mo | $124,900 | $133 | 68 |
| 12235 6th St | 0.44mi | 2/1.0 (-1) | 876 (-14%) | 6mo | $195,000 | $223 | 41 |
| 4150 Avenue Q 1/2 | 0.57mi | 2/1.0 (-1) | 934 (-9%) | 16mo | $129,999 | $139 | 36 |
Match score weights: distance 35% · size 25% · config 20% · recency 20%. Top-matched comps best support the ARV.
Projected returns pro-forma
-3.0% appreciation · 3.0% rent growth · sell at horizon
- IRR
- —
- Equity multiple
- 61.40×
- Total profit
- $3,297,768
- Equity at exit
- $29,075
- IRR
- —
- Equity multiple
- 132.17×
- Total profit
- $7,161,648
- Equity at exit
- $16,860
Cash invested: $54,600 (down + closing). Projections, not guarantees.
Landlord ↔ Tenant lean methodology
- Overall (STATE)
- 87 Strongly Landlord-Friendly
- State Texas
- 87 Strongly Landlord-Friendly · R+5
- County
- — inherits STATE
- City
- — inherits STATE
ZIP-level market 77510
- Home prices YoY
- -15.3%
- Active inventory
- 233
- Price-to-rent
- 0.2×
Monthly cashflow live
- Estimated rent
- $67,911 medium interval (Pro) →
- Mortgage (P&I)
- −$1,023
- Tax from tax record
- −$288 /mo · $3,461/yr
- Insurance
- −$81
- HOA
- −$0
- Vacancy / Maint / Mgmt
- −$14,261
- Net cashflow
- $52,258
Break-even live
UW: 25.0% down · 7.5% · 30yr · 1.5% tax · 5.0% vac · 8.0% maint · 8.0% mgmt
Financing live
Cash to close
- Down payment
- $48,750
- Closing costs
- $5,850
- Reserves months
- —
- Total cash needed
- —
Loan-product check · same deal, 3 products live
Conventional
25% down · 7.5% · 30yr
- Down + closing
- —
- Monthly P&I
- —
- Monthly cashflow
- —
- DSCR
- —
- Eligible?
- —
Personal DTI + credit; lowest rate.
DSCR
20% down · 8.5% · 30yr
- Down + closing
- —
- Monthly P&I
- —
- Monthly cashflow
- —
- DSCR
- —
- Eligible?
- —
No personal income docs; deal must DSCR.
Hard money
10% down · 12.0% · 12mo
- Down + closing
- —
- Monthly P&I
- —
- Monthly cashflow
- —
- DSCR
- —
- Eligible?
- —
Short-term bridge; refi at stabilization.
Rent comps 2 comps
| Address | Beds | Baths | Sqft | Rent | $/sqft | DOM | Units | Dist |
|---|---|---|---|---|---|---|---|---|
| 4120 Avenue O #10 Santa Fe, TX | 3.0 | 2.0 | 1280 | $74,621 | $58.30 | 43d | 1 | 0.13mi |
| 11844 13th St Santa Fe, TX | 3.0 | 2.0 | 1472 | $1,750 | $1.19 | 22d | 1 | 1.12mi |
Listing history 29 events
-
2026-06-18days on market $195,000 Active 8 DOM
-
2026-06-17days on market $195,000 Active 7 DOM
-
2026-06-16days on market $195,000 Active 6 DOM
-
2026-06-15days on market $195,000 Active 5 DOM
-
2026-06-13remarks 699-char remark
-
2026-06-13pricedays on market $195,000 Active 3 DOM
-
2026-06-09days on market $210,000 Active 95 DOM
-
2026-06-08days on market $210,000 Active 94 DOM
-
2026-06-07days on market $210,000 Active 93 DOM
-
2026-06-04days on market $210,000 Active 90 DOM
-
2026-06-03days on market $210,000 Active 89 DOM
-
2026-06-02days on market $210,000 Active 88 DOM
-
2026-06-01days on market $210,000 Active 87 DOM
-
2026-05-31days on market $210,000 Active 86 DOM
-
2026-03-06$210,000 Active 477-char remark
Show marketing remark (477 chars)
This home features a comfortable layout with a spacious living area that flows into the kitchen and dining space, creating a practical setup for everyday living. The kitchen offers ample cabinet and counter space for cooking and storage. The bedrooms provide flexibility for a variety of needs, whether for sleeping, a home office, or additional living space. Conveniently located near local amenities and major roadways, the property offers easy access to everyday essentials.
-
2025-12-31historical
-
2025-09-03price $210,000
-
2025-07-04$220,000 Active
-
2025-06-30historical
-
2025-04-04price $224,000
-
2025-02-10$234,000 Active
-
2025-02-10historical
-
2024-12-28$249,000 Active
-
2024-12-26historical
-
2012-12-11soldstatus
-
2012-12-11soldstatus
-
2012-09-03historical
-
2012-06-15$63,000
-
1991-09-23soldstatus
ⓘ Source: listings_history table (triggers on properties + properties_extension) + one-shot
backfill from property_details.listing_events for pre-trigger history.
Tax reassessment forecast TX · Resets to sale price
- Current annual tax
- $3,461 · $288/mo
- Projected year-2 tax
- $3,568 · $297/mo
- Expected delta
- +$107/yr (+$9/mo · 3.1%)
ⓘ Screening estimate from a state-policy table — verify with the county assessor before closing.
Climate risk First Street
- Flood 1/10 Low FEMA zone X (unshaded) · 0% chance over 30 yrs
- Wildfire 2/10 Low
- Heat 10/10 Extreme 7 d/yr ≥110°F today · 26 d/yr by 30 yrs out
- Wind 9/10 Extreme 99% chance of damaging wind over 30 yrs
- Air quality 2/10 Low 1 unhealthy d/yr today · 1 by 30 yrs out
Nearby sold comps map
Loading sold comps map…
Walkable amenities ~0.75 mi
Loading nearby amenities…
Taxation est. · year 1
- Rental income
- $814,935
- − Mortgage interest
- −$10,923
- − Property taxes
- −$3,461
- − Insurance
- −$975
- − Repairs & maintenance
- −$65,195
- − Management
- −$65,195
- − Depreciation
- −$5,673
- Taxable income
- $663,513
- Est. tax owed @ 24.0%
- −$159,243
- After-tax cash flow
- $467,848/yr
For passive investors: Depreciation is non-cash, so a rental often shows a tax loss while cash-flowing — sheltering income. Rental losses are passive: they offset passive income freely, and up to $25,000/yr can offset ordinary (W-2) income if you actively participate and your MAGI is under $100k (phasing out to $0 by $150k); unused losses carry forward. On sale, claimed depreciation is recaptured at up to 25%, and gains may owe capital-gains tax (a 1031 exchange can defer both). Figures are a year-1 estimate at your 24.0% rate — not tax advice; consult a CPA.
Schools (NCES district)
- District
- Santa Fe ISD
- NCES district ID
- 4839270
- Math proficiency
- 38% ▼ -10.00%
- Reading proficiency
- 39% ▼ -2.00%
- Median HH income
- $66,769
- Composite
- 34.86/100
- National rank
- #5091
- State rank
- #385 of 826 in TX
Livability — Santa Fe
- Score
- 67/100
- State rank
- #550
- US rank
- #10637
Category grades
Schools grade is shown separately in the Schools card above.
Census & demographics
- Census place
- Santa Fe, TX
- Population (ZIP)
- 13,938
Population outlook (Galveston County) Hauer SSP2
- Today (2025)
- 390,640 people
- By 2030
- 425,226 · +8.9%
- By 2040
- 493,765 · +26.4%
- By 2050
- 559,698 · +43.3%
- By 2075
- 719,260 · +84.1%
- By 2100
- 819,628 · +109.8%
Race, ethnicity, and origin ACS 2023
- Neighborhood character
- Predominantly White (72%)
- Race & ethnicity
- White 72% Hispanic / Latino 21% Two or more races 17% Asian 2%
- Hispanic origin (detail)
- Mexican 14% Puerto Rican 3% Cuban 1%
- Common ancestry
- Lithuanian 4% Italian 3% Slovak 1%
- Foreign-born
- 5% · Canada
- Languages at home
- 89% English-only · Spanish 10% Tagalog/Filipino 1%
Political lean MEDSL · Galveston
- 2024 margin
- Strong R (+27.4) · D 35.7% · R 63.1% · Other 1.2%
- 2008→2024 swing
- -7.9pp toward R · 2008: -19.5pp · 2024: -27.4pp
- All cycles
- 2024: R+27.4 2020: R+22.6 2016: R+22.6 2012: R+26.9 2008: R+19.5
Not yet ingested
- Civics
- —
Market trends
- HPI YoY
- ▼ -54.15%
- Current HPI
- 299.2228
- Rent YoY
- —
- Metro
- —
- State GDP YoY
- ▲ 3.95%
- F500 in state
- 110
Industry mix (Fortune 500 HQ in TX)
| Industry | F500 HQs | Revenue |
|---|---|---|
| Energy | 16 | $1,198B |
|
||
| Technology | 5 | $198B |
|
||
| Engineering / Construction | 4 | $72B |
|
||
| Energy Services | 3 | $60B |
|
||
| Utilities | 3 | $41B |
|
||
| Healthcare | 2 | $330B |
|
||
Price history
+233.3% since first listed15 events — show timeline
- 2026-03-06 Listed $210,000 HARMLS
- 2025-12-31 Listing Removed — HARMLS
- 2025-09-03 Price Changed $210,000 HARMLS
- 2025-07-04 Listed $220,000 HARMLS
- 2025-06-30 Listing Removed — HARMLS
- 2025-04-04 Price Changed $224,000 HARMLS
- 2025-02-10 Listing Removed — HARMLS
- 2025-02-10 Listed $234,000 HARMLS
- 2024-12-28 Listed $249,000 HARMLS
- 2024-12-26 Coming Soon — HARMLS
- 2012-12-11 Sold (Public Records) — Public Records
- 2012-12-11 Sold (MLS) — HARMLS
- 2012-09-03 Listing Removed — HARMLS
- 2012-06-15 Listed $63,000 HARMLS
- 1991-09-23 Sold (Public Records) — Public Records
Property tax history
+6.8%/yrLatest (2025): $3,461 · +7.0% YoY. Source: county tax records.
Cash-flow waterfall
monthlySold comps — $/sqft
last 12 mo · ≤1 miLoading sold comps…