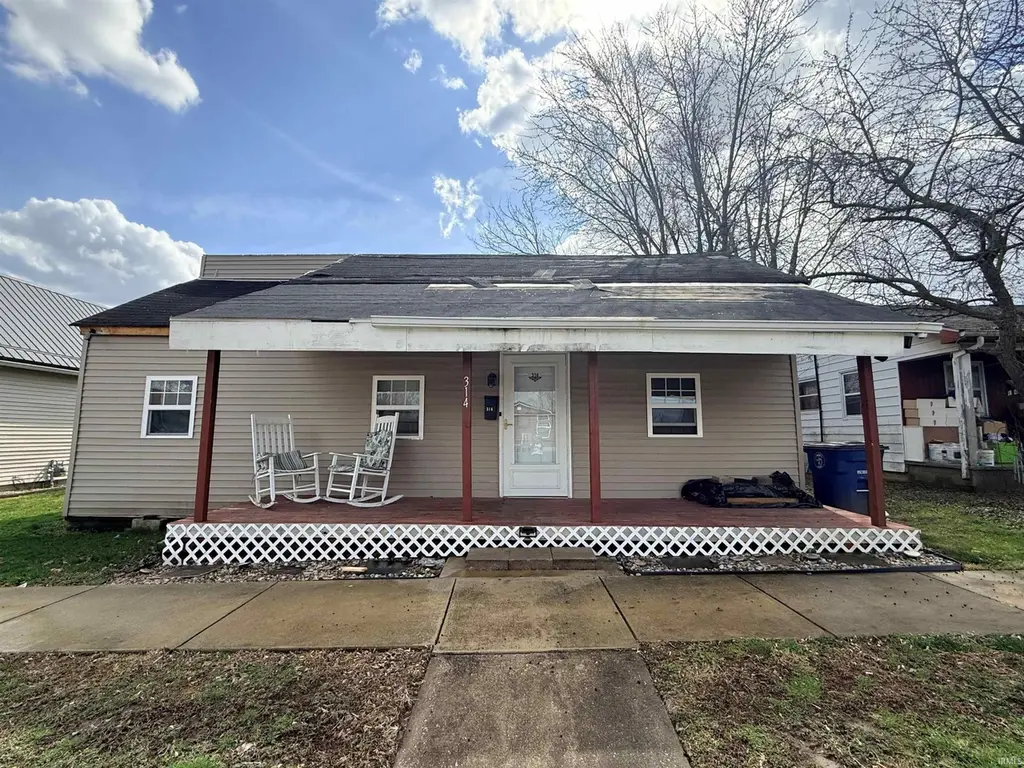
314 W Warren St · Mitchell, IN
Flood risk 1/10 · Minimal
- FEMA flood zone
- X (unshaded)
- Chance of flooding over 30 yrs
- 0.0%
- Est. flood insurance / yr
- $507 – $1,088
Fire risk 2/10 · Minimal
- Est. fire insurance / yr
- $717 – $1,331
Heat risk 5/10 · Moderate
- Hot days now (above 104°F)
- 7 days/yr
- Hot days in 30 yrs
- 20 days/yr
Wind risk 2/10 · Minimal
- Chance of severe wind over 30 yrs
- 1.0%
Air-quality risk 2/10 · Minimal
- Unhealthy air days now
- 1 days/yr
- Unhealthy air days in 30 yrs
- 2 days/yr
Risk factors via First Street. Map © Google.
Why this score? — see what drove the A- grade
The composite is a weighted blend of 9 inputs, each scored 0–100. Each bar is that input's sub-score; the figure is the points it added to the 100-point composite (weight × sub-score).
- Cash flow +30.0/30.0
- ARV discount +15.0/15.0
- 1% rule +10.0/10.0
- DSCR +10.0/10.0
- Appreciation +5.3/10.0
- Livability +3.5/5.0
- Schools +2.7/10.0
- Rent growth +2.5/5.0
- Condition / age +2.5/5.0
$79,900
🖨 Deal sheet 📄 Offer letter ✓ Due diligence
Listing remarks MLS
This ranch-style home is a fantastic opportunity for a rental, flip, or first home. With 3 bedrooms and 1 bathroom, it offers 1,158 square feet of living space on a . 15-acre lot, conveniently located near amenities. The property is being sold AS IS, so bring your vision and TLC to make it your dream space!
Key facts
- Ranch-style home
- 15-acre lot
- 6,534 sq ft lot
Tags
Neighborhood map
What this means for you Summary
Snapshot
- This is a 2-bed/1.0-bath single-family listed at $80k.
Deal economics
- At list price, monthly cash flow is $620 ($7k/yr) — positive.
- The deal already cash-flows at list — no discount required.
- Meets the 1% rule at list price ($1k rent vs $80k).
- Recommended offer: $70k (12.0% below list) — sets the bar for market timing.
- Cap rate 15.6% vs local median 5.6% in Mitchell — top-decile yield for the area; either an underpriced asset or a hidden risk that comps aren't pricing in. Stress-test before assuming the spread holds.
Location & tenants
- Location reads 69/100 on livability (#187 in IN) — a middle-class / working-renter tenant base. Strengths: cost of living A+, housing A+, crime B; Watch: schools D, employment D, amenities F.
- Mitchell Community Schools (town): math 26% / reading 37% proficiency, ranked #230 of 301 in IN (top 76%) — families likely to look elsewhere, expect single-tenant / working-renter base with shorter leases.
- Market conditions: 61 active listings in the ZIP; 8 units permitted in Lawrence County in 2024 (0 in 5+ unit buildings).
Forward outlook
- In year one you build about $1k of equity ($552 loan paydown + $492 appreciation (0.6% local appreciation)).
- Lawrence County population projected at -14% by 2050 — secular population decline; favor cash flow + early exit over multi-decade hold.
- At projected returns (0.6% appreciation + 3.0% rent growth), your $22k cash investment doubles in ~3 years — after that, you're playing with house money.
Negotiation context
- It's been on market 140 days — a 12% lower offer ($70k) is reasonable based on typical stale-listing flexibility.
Risks & watch-outs
- Watch-outs: built in 1861 — expect roof / HVAC / electrical / plumbing capex.
- Climate carrying-cost: extreme-heat days projected 7→20/yr by 2055 (HVAC capex compounding) — expect insurance premiums to compound above CPI over the hold.
Questions for the listing agent
- It's been on market 140 days. Have you received any prior offers? Is the seller open to a 12% concession, seller financing, or rate buy-down credit?
- Built in 1861 — when were the roof, HVAC, electrical panel, plumbing, and water heater last replaced?
- Why hasn't it sold? Are there any deal-killer items the seller is aware of (foundation, flood, title, zoning, code violations)?
- Is there a deadline driving the sale (1031 exchange, divorce, estate, relocation)? That informs how much negotiation room exists.
- Schools are D-rated, which usually means shorter tenancies and higher turnover. Who's the typical renter profile here, and what's been the actual vacancy rate?
- What's the average days-on-market for RENTAL listings here right now (not sales)? A rising rental-DOM trend means longer vacancies and softer asking-rent achievability than the comps imply.
- What's the recent tenant-quality profile in this submarket — average credit score on applications, eviction rate, late-payment / NSF rate, and stable-employment percentage? A property-management company in the area should have these aggregated.
- How much new for-sale + rental construction is in the pipeline within 1–3 miles? Heavy new supply typically softens prices + rents 12–24 months out; constrained supply supports both.
Investment metrics
- 1% rule
- 1.74% ✓
- Cap rate
- 15.61%
- Cash-on-cash
- 33.26%
- DSCR
- 2.48
- GRM
- 4.8
CMA / ARV
- ARV (median comp)
- $140,202
- List price
- $79,900
- Delta
- -43.01%
- Verdict
- UNDERPRICED
- Comps
- 20 within 1.0 mi
Show comp detail 12 sales within ~0.75 mi
| Address | Dist | Beds/Ba | Sqft | Sold | Price | $/sf | Match |
|---|---|---|---|---|---|---|---|
| 610 W Frank St | 0.30mi | 2/1.5 | 1,200 (+4%) | 4mo | $174,000 | $145 | 75 |
| 515 W Vine St | 0.35mi | 3/1.0 (+1) | 1,111 (-4%) | 11mo | $80,000 | $72 | 63 |
| 503 College Ave | 0.43mi | 3/2.0 (+1) | 1,200 (+4%) | 2mo | $220,000 | $183 | 63 |
| 910 W Oak St | 0.44mi | 2/1.0 | 1,024 (-12%) | 1mo | $149,000 | $146 | 60 |
| 1336 N 9th St | 0.63mi | 3/1.0 (+1) | 1,164 (+0%) | 6mo | $75,000 | $64 | 60 |
| 818 W Oak St | 0.39mi | 3/1.0 (+1) | 1,065 (-8%) | 8mo | $162,900 | $153 | 56 |
| 507 College Ave | 0.43mi | 3/2.0 (+1) | 1,200 (+4%) | 12mo | $212,000 | $177 | 55 |
| 509 N 8th St | 0.46mi | 2/1.0 | 1,057 (-9%) | 12mo | $93,350 | $88 | 54 |
| 714 W Curry St | 0.71mi | 3/1.0 (+1) | 1,164 (+0%) | 10mo | $90,000 | $77 | 53 |
| 104 Rabbitsville Rd | 0.48mi | 3/1.5 (+1) | 1,040 (-10%) | 6mo | $163,000 | $157 | 48 |
| 1016 Orchard St St | 0.63mi | 2/2.0 | 1,068 (-8%) | 6mo | $169,000 | $158 | 48 |
| 1206 W Brook St | 0.69mi | 3/1.0 (+1) | 1,044 (-10%) | 7mo | $90,000 | $86 | 40 |
Match score weights: distance 35% · size 25% · config 20% · recency 20%. Top-matched comps best support the ARV.
Projected returns pro-forma
0.62% appreciation · 3.0% rent growth · sell at horizon
- IRR
- 35.0%
- Equity multiple
- 2.76×
- Total profit
- $39,473
- Equity at exit
- $25,691
- IRR
- 37.6%
- Equity multiple
- 5.40×
- Total profit
- $98,326
- Equity at exit
- $32,946
Cash invested: $22,372 (down + closing). Projections, not guarantees.
Landlord ↔ Tenant lean methodology
- Overall (STATE)
- 90 Strongly Landlord-Friendly
- State Indiana
- 90 Strongly Landlord-Friendly · R+11
- County
- — inherits STATE
- City
- — inherits STATE
ZIP-level market 47446
- Home prices YoY
- 0.2%
- Active inventory
- 61
- Price-to-rent
- 4.8×
Monthly cashflow live
- Estimated rent
- $1,391 medium interval (Pro) →
- Mortgage (P&I)
- −$419
- Tax from tax record
- −$26 /mo · $314/yr
- Insurance
- −$33
- HOA
- −$0
- Vacancy / Maint / Mgmt
- −$292
- Net cashflow
- $620
Break-even live
UW: 25.0% down · 7.5% · 30yr · 1.5% tax · 5.0% vac · 8.0% maint · 8.0% mgmt
Financing live
Cash to close
- Down payment
- $19,975
- Closing costs
- $2,397
- Reserves months
- —
- Total cash needed
- —
Loan-product check · same deal, 3 products live
Conventional
25% down · 7.5% · 30yr
- Down + closing
- —
- Monthly P&I
- —
- Monthly cashflow
- —
- DSCR
- —
- Eligible?
- —
Personal DTI + credit; lowest rate.
DSCR
20% down · 8.5% · 30yr
- Down + closing
- —
- Monthly P&I
- —
- Monthly cashflow
- —
- DSCR
- —
- Eligible?
- —
No personal income docs; deal must DSCR.
Hard money
10% down · 12.0% · 12mo
- Down + closing
- —
- Monthly P&I
- —
- Monthly cashflow
- —
- DSCR
- —
- Eligible?
- —
Short-term bridge; refi at stabilization.
Listing history 20 events
-
2026-06-19days on market $79,900 Active 140 DOM
-
2026-06-18price $79,900 Active 139 DOM
-
2026-06-18days on market $84,900 Active 139 DOM
-
2026-06-17days on market $84,900 Active 138 DOM
-
2026-06-16days on market $84,900 Active 137 DOM
-
2026-06-15days on market $84,900 Active 136 DOM
-
2026-06-14days on market $84,900 Active 134 DOM
-
2026-06-12days on market $84,900 Active 133 DOM
-
2026-06-09days on market $84,900 Active 130 DOM
-
2026-06-08days on market $84,900 Active 129 DOM
-
2026-06-07days on market $84,900 Active 128 DOM
-
2026-06-05days on market $84,900 Active 126 DOM
-
2026-06-03days on market $84,900 Active 124 DOM
-
2026-06-02days on market $84,900 Active 123 DOM
-
2026-06-01days on market $84,900 Active 122 DOM
-
2026-05-31days on market $84,900 Active 121 DOM
-
2026-05-30days on market $84,900 Active 120 DOM
-
2026-04-21price $84,900 308-char remark
Show marketing remark (308 chars)
This ranch-style home is a fantastic opportunity for a rental, flip, or first home. With 3 bedrooms and 1 bathroom, it offers 1,158 square feet of living space on a . 15-acre lot, conveniently located near amenities. The property is being sold AS IS, so bring your vision and TLC to make it your dream space!
-
2026-02-13price $89,900 308-char remark
Show marketing remark (308 chars)
This ranch-style home is a fantastic opportunity for a rental, flip, or first home. With 3 bedrooms and 1 bathroom, it offers 1,158 square feet of living space on a . 15-acre lot, conveniently located near amenities. The property is being sold AS IS, so bring your vision and TLC to make it your dream space!
-
2026-01-30$94,900 Active 308-char remark
Show marketing remark (308 chars)
This ranch-style home is a fantastic opportunity for a rental, flip, or first home. With 3 bedrooms and 1 bathroom, it offers 1,158 square feet of living space on a . 15-acre lot, conveniently located near amenities. The property is being sold AS IS, so bring your vision and TLC to make it your dream space!
ⓘ Source: listings_history table (triggers on properties + properties_extension) + one-shot
backfill from property_details.listing_events for pre-trigger history.
Tax reassessment forecast IN · Partial reset (capped growth)
- Current annual tax
- $314 · $26/mo
- Projected year-2 tax
- $496 · $41/mo
- Expected delta
- +$183/yr (+$15/mo · 58.2%)
ⓘ Screening estimate from a state-policy table — verify with the county assessor before closing.
Climate risk First Street
- Flood 1/10 Low FEMA zone X (unshaded) · 0% chance over 30 yrs
- Wildfire 2/10 Low
- Heat 5/10 Major 7 d/yr ≥104°F today · 20 d/yr by 30 yrs out
- Wind 2/10 Low 100% chance of damaging wind over 30 yrs
- Air quality 2/10 Low 1 unhealthy d/yr today · 2 by 30 yrs out
Nearby sold comps map
Loading sold comps map…
Walkable amenities ~0.75 mi
Loading nearby amenities…
Taxation est. · year 1
- Rental income
- $16,687
- − Mortgage interest
- −$4,476
- − Property taxes
- −$314
- − Insurance
- −$400
- − Repairs & maintenance
- −$1,335
- − Management
- −$1,335
- − Depreciation
- −$2,324
- Taxable income
- $6,503
- Est. tax owed @ 24.0%
- −$1,561
- After-tax cash flow
- $5,880/yr
For passive investors: Depreciation is non-cash, so a rental often shows a tax loss while cash-flowing — sheltering income. Rental losses are passive: they offset passive income freely, and up to $25,000/yr can offset ordinary (W-2) income if you actively participate and your MAGI is under $100k (phasing out to $0 by $150k); unused losses carry forward. On sale, claimed depreciation is recaptured at up to 25%, and gains may owe capital-gains tax (a 1031 exchange can defer both). Figures are a year-1 estimate at your 24.0% rate — not tax advice; consult a CPA.
Schools (NCES district)
- District
- Mitchell Community Schools
- NCES district ID
- 1806900
- Math proficiency
- 26% ▼ -16.00%
- Reading proficiency
- 37% ▼ -10.00%
- Median HH income
- $43,994
- Composite
- 26.83/100
- National rank
- #7113
- State rank
- #230 of 301 in IN
Livability — Mitchell
- Score
- 69/100
- State rank
- #187
- US rank
- #8606
Category grades
Schools grade is shown separately in the Schools card above.
Census & demographics
- Census place
- Mitchell, IN
- Population (ZIP)
- 9,259
Population outlook (Lawrence County) Hauer SSP2
- Today (2025)
- 44,347 people
- By 2030
- 43,331 · -2.3%
- By 2040
- 40,887 · -7.8%
- By 2050
- 38,297 · -13.6%
- By 2075
- 32,479 · -26.8%
- By 2100
- 26,051 · -41.3%
Race, ethnicity, and origin ACS 2023
- Neighborhood character
- Predominantly White (93%)
- Race & ethnicity
- White 93% Two or more races 4% Asian 2% Hispanic / Latino 1%
- Common ancestry
- Italian 3% Slovak 2% Serbian 1%
- Foreign-born
- 3% · Canada
- Languages at home
- 96% English-only · Other Indo-European 2% Spanish 1%
Political lean MEDSL · Lawrence
- 2024 margin
- Solid R (+51.0) · D 23.6% · R 74.6% · Other 1.7%
- 2008→2024 swing
- -30.5pp toward R · 2008: -20.6pp · 2024: -51.0pp
- All cycles
- 2024: R+51.0 2020: R+50.6 2016: R+51.5 2012: R+32.8 2008: R+20.6
Not yet ingested
- Civics
- —
Market trends
- HPI YoY
- ▲ 0.62%
- Current HPI
- 248.9604
- Rent YoY
- —
- Metro
- —
- State GDP YoY
- ▲ 2.90%
- F500 in state
- 18
Industry mix (Fortune 500 HQ in IN)
| Industry | F500 HQs | Revenue |
|---|---|---|
| Industrial Machinery | 2 | $37B |
|
||
| Healthcare | 1 | $177B |
|
||
| Pharmaceuticals | 1 | $45B |
|
||
| Metals / Steel | 1 | $18B |
|
||
| Agriculture | 1 | $17B |
|
||
| Packaging | 1 | $12B |
|
||
Price history
-10.5% since first listed3 events — show timeline
- 2026-04-21 Price Changed $84,900 IRMLS
- 2026-02-13 Price Changed $89,900 IRMLS
- 2026-01-30 Listed $94,900 IRMLS
Property tax history
-7.3%/yrLatest (2025): $314 · -37.4% YoY. Source: county tax records.
Cash-flow waterfall
monthlySold comps — $/sqft
last 12 mo · ≤1 miLoading sold comps…