510 W Marion St · Kershaw, SC
Flood risk 1/10 · Minimal
- FEMA flood zone
- X (unshaded)
- Chance of flooding over 30 yrs
- 0.0%
- Est. flood insurance / yr
- $507 – $1,088
Fire risk 3/10 · Minor
- Est. fire insurance / yr
- $783 – $1,453
Heat risk 6/10 · Moderate
- Hot days now (above 106°F)
- 7 days/yr
- Hot days in 30 yrs
- 16 days/yr
Wind risk 6/10 · Moderate
- Chance of severe wind over 30 yrs
- 60.0%
Air-quality risk 2/10 · Minimal
- Unhealthy air days now
- 1 days/yr
- Unhealthy air days in 30 yrs
- 1 days/yr
Risk factors via First Street. Map © Google.
Why this score? — see what drove the C grade
The composite is a weighted blend of 9 inputs, each scored 0–100. Each bar is that input's sub-score; the figure is the points it added to the 100-point composite (weight × sub-score).
- Cash flow +22.5/30.0
- ARV discount +7.5/15.0
- DSCR +7.2/10.0
- 1% rule +5.9/10.0
- Appreciation +5.0/10.0
- Schools +3.7/10.0
- Livability +3.4/5.0
- Rent growth +2.5/5.0
- Condition / age +1.5/5.0
$124,900
🖨 Deal sheet 📄 Offer letter ✓ Due diligence
Listing remarks
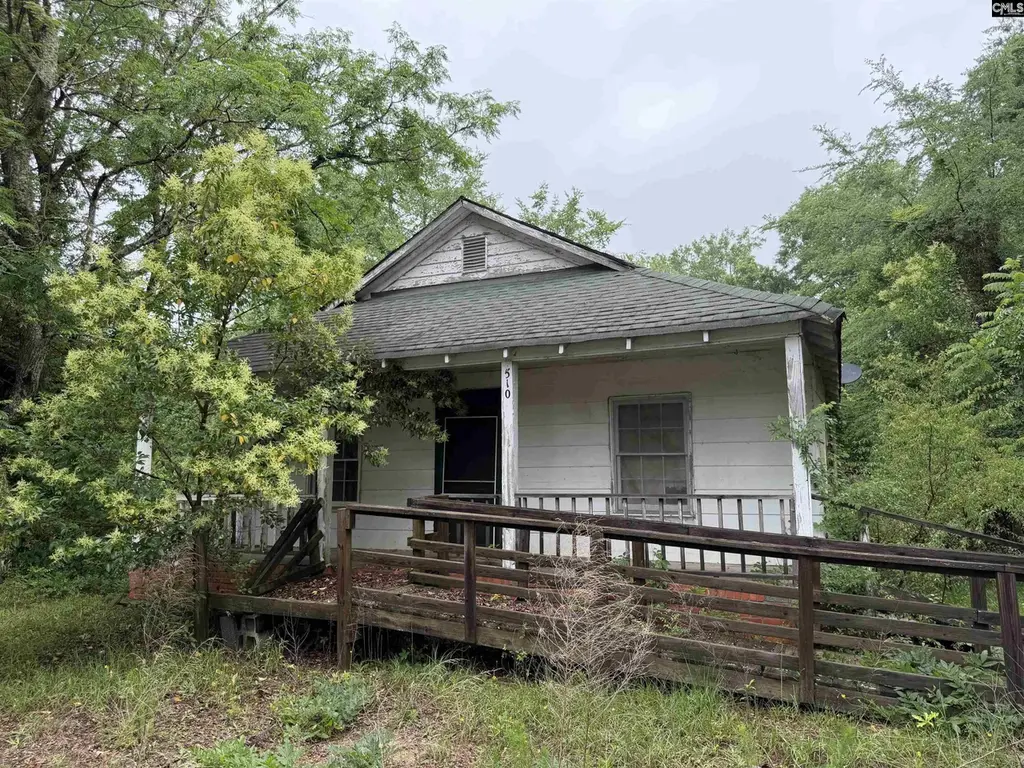
Investor opportunity in the Town of Kershaw featuring three permitted residential structures on one parcel, including two single-family homes and one duplex. The property currently produces $1,600 per month in rental income, with one single-family home vacant and ready for renovation. Situated on a 2+ acre lot with paved road frontage, the property offers separate meters, existing rental income, paid septic hookups available at the street, and flexible ownership potential. Additional upside is available through renovation, stabilization, rent increases, and possible future expansion or additional units. Demand for affordable rental housing in Kershaw remains active as lower-cost housing opt
Key facts
- One duplex
- Paved road frontage
- 2+ acre lot
Tags
Property features AI
Exterior
- Parking: 8 parking spaces
- Utilities: Public water; Septic sewer
- Home design: Single-story home
- Construction: Crawlspace foundation
- Exterior features: Vinyl and wood exterior; Paved road access; Property of approximately 2.18 acres
Interior
- Kitchen: Wood cabinets; Non-standard countertops
- Bedrooms: All bedrooms on the main level with private closets; Master bedroom shares a bath
- Flooring: Hardwood and carpet flooring
- Bathrooms: Three full bathrooms
- Heating & cooling: Other heating (see remarks); Other cooling (see remarks)
- Interior features: Attic access
Neighborhood map
What this means for you Summary
Snapshot
- This is a 6-bed/3.0-bath single-family listed at $125k. Condition is rated poor.
Deal economics
- At list price, monthly cash flow is $210 ($3k/yr) — positive.
- The deal already cash-flows at list — no discount required.
- Meets the 1% rule at list price ($1k rent vs $125k).
Location & tenants
- Location reads 68/100 on livability (#80 in SC) — a middle-class / working-renter tenant base. Strengths: cost of living A+, housing A+, crime A; Watch: schools D, amenities F, commute F.
- Lancaster 01 (rural): math 41% / reading 47% proficiency, ranked #26 of 80 in SC (top 32%) — families likely to look elsewhere, expect single-tenant / working-renter base with shorter leases.
- Market conditions: 1 active listings in the ZIP; 976 units permitted in Lancaster County in 2024 (0 in 5+ unit buildings).
Forward outlook
- In year one you build about $5k of equity ($864 loan paydown + $4k appreciation (3.0% local appreciation)).
- Lancaster County population projected at +40% by 2050 — long-run rental-demand tailwind backs the buy-and-hold thesis.
- At projected returns (3.0% appreciation + 3.0% rent growth), your $35k cash investment doubles in ~5 years — after that, you're playing with house money.
- By year 8, paydown + projected appreciation supports a ~$34k cash-out refi (75% LTV) — recoverable capital for the next deal without selling this one.
Negotiation context
- Only 13 days on market — expect competitive offers; lowballing is unlikely to land.
Risks & watch-outs
- Watch-outs: built in 1950 — expect roof / HVAC / electrical / plumbing capex.
- Climate carrying-cost: major wind risk, 60% chance of damaging wind over 30y; extreme-heat days projected 7→16/yr by 2055 (HVAC capex compounding) — expect insurance premiums to compound above CPI over the hold.
Questions for the listing agent
- Have any recent inspections been done? Can we get a copy of the seller's disclosures and any deferred-maintenance estimates?
- Built in 1950 — when were the roof, HVAC, electrical panel, plumbing, and water heater last replaced?
- Is there a deadline driving the sale (1031 exchange, divorce, estate, relocation)? That informs how much negotiation room exists.
- Schools are D-rated, which usually means shorter tenancies and higher turnover. Who's the typical renter profile here, and what's been the actual vacancy rate?
- What's the average days-on-market for RENTAL listings here right now (not sales)? A rising rental-DOM trend means longer vacancies and softer asking-rent achievability than the comps imply.
- What's the recent tenant-quality profile in this submarket — average credit score on applications, eviction rate, late-payment / NSF rate, and stable-employment percentage? A property-management company in the area should have these aggregated.
- How much new for-sale + rental construction is in the pipeline within 1–3 miles? Heavy new supply typically softens prices + rents 12–24 months out; constrained supply supports both.
Investment metrics
- 1% rule
- 1.09% ✓
- Cap rate
- 8.31%
- Cash-on-cash
- 7.21%
- DSCR
- 1.32
- GRM
- 7.7
CMA / ARV
No comps found within radius.
Projected returns pro-forma
3.0% appreciation · 3.0% rent growth · sell at horizon
- IRR
- 14.2%
- Equity multiple
- 1.81×
- Total profit
- $28,456
- Equity at exit
- $56,160
- IRR
- 16.1%
- Equity multiple
- 3.36×
- Total profit
- $82,584
- Equity at exit
- $86,550
Cash invested: $34,972 (down + closing). Projections, not guarantees.
Landlord ↔ Tenant lean methodology
- Overall (STATE)
- 90 Strongly Landlord-Friendly
- State South Carolina
- 90 Strongly Landlord-Friendly · R+6
- County
- — inherits STATE
- City
- — inherits STATE
ZIP-level market 29067-0000
- Active inventory
- 1
- Price-to-rent
- 7.7×
Monthly cashflow live
- Estimated rent
- $1,359 medium interval (Pro) →
- Mortgage (P&I)
- −$655
- Tax est. 1.5%
- −$156 /mo · $1,874/yr
- Insurance
- −$52
- HOA
- −$0
- Vacancy / Maint / Mgmt
- −$285
- Net cashflow
- $210
Break-even live
UW: 25.0% down · 7.5% · 30yr · 1.5% tax · 5.0% vac · 8.0% maint · 8.0% mgmt
Financing live
Cash to close
- Down payment
- $31,225
- Closing costs
- $3,747
- Reserves months
- —
- Total cash needed
- —
Loan-product check · same deal, 3 products live
Conventional
25% down · 7.5% · 30yr
- Down + closing
- —
- Monthly P&I
- —
- Monthly cashflow
- —
- DSCR
- —
- Eligible?
- —
Personal DTI + credit; lowest rate.
DSCR
20% down · 8.5% · 30yr
- Down + closing
- —
- Monthly P&I
- —
- Monthly cashflow
- —
- DSCR
- —
- Eligible?
- —
No personal income docs; deal must DSCR.
Hard money
10% down · 12.0% · 12mo
- Down + closing
- —
- Monthly P&I
- —
- Monthly cashflow
- —
- DSCR
- —
- Eligible?
- —
Short-term bridge; refi at stabilization.
Listing history 9 events
-
2026-06-18days on market $124,900 Active 13 DOM
-
2026-06-17days on market $124,900 Active 12 DOM
-
2026-06-16days on market $124,900 Active 11 DOM
-
2026-06-15days on market $124,900 Active 10 DOM
-
2026-06-13days on market $124,900 Active 8 DOM
-
2026-06-09days on market $124,900 Active 4 DOM
-
2026-06-08days on market $124,900 Active 3 DOM
-
2026-06-07remarks 699-char remark
-
2026-06-07$124,900 Active 2 DOM
ⓘ Source: listings_history table (triggers on properties + properties_extension) + one-shot
backfill from property_details.listing_events for pre-trigger history.
Climate risk First Street
- Flood 1/10 Low FEMA zone X (unshaded) · 0% chance over 30 yrs
- Wildfire 3/10 Moderate
- Heat 6/10 Major 7 d/yr ≥106°F today · 16 d/yr by 30 yrs out
- Wind 6/10 Major 60% chance of damaging wind over 30 yrs
- Air quality 2/10 Low 1 unhealthy d/yr today · 1 by 30 yrs out
Nearby sold comps map
Loading sold comps map…
Walkable amenities ~0.75 mi
Loading nearby amenities…
Taxation est. · year 1
- Rental income
- $16,305
- − Mortgage interest
- −$6,996
- − Property taxes
- −$1,874
- − Insurance
- −$624
- − Repairs & maintenance
- −$1,304
- − Management
- −$1,304
- − Depreciation
- −$3,633
- Taxable income
- $568
- Est. tax owed @ 24.0%
- −$136
- After-tax cash flow
- $2,386/yr
For passive investors: Depreciation is non-cash, so a rental often shows a tax loss while cash-flowing — sheltering income. Rental losses are passive: they offset passive income freely, and up to $25,000/yr can offset ordinary (W-2) income if you actively participate and your MAGI is under $100k (phasing out to $0 by $150k); unused losses carry forward. On sale, claimed depreciation is recaptured at up to 25%, and gains may owe capital-gains tax (a 1031 exchange can defer both). Figures are a year-1 estimate at your 24.0% rate — not tax advice; consult a CPA.
Condition & rehab AI · 11 photos
This property requires extensive repairs and renovations to bring it up to a livable condition. Significant improvements in the roof, siding, flooring, and landscaping will greatly increase its resale and rental value.
Repairs flagged
- Major Roof — Severe damage and missing shingles require full replacement.
- Major Siding — Weathered and peeling paint, indicating extensive damage.
- Major Flooring — Damaged and uneven, requiring full replacement.
- Major Paint — Peeling and damaged paint, indicating extensive wear.
- Major Bathroom Fixtures — Dirty and outdated, requiring full replacement.
- Major Landscaping — Overgrown vegetation and unkempt appearance.
- Major Fencing — Sections missing or broken, requiring full repair or replacement.
Value-add opportunities
- Both New roof — A new roof will significantly improve the home's appearance and functionality, attracting both buyers and renters.
- Both New siding and paint — Fresh siding and paint will enhance the home's curb appeal and make it more attractive to potential buyers and renters.
- Both New flooring — Replacing the damaged flooring will improve the home's functionality and make it more appealing to potential buyers and renters.
- Both New bathroom fixtures — Upgrading the outdated bathroom fixtures will make the home more attractive and functional for both buyers and renters.
- Both Landscaping and fencing repair — A well-maintained and aesthetically pleasing exterior will enhance the home's curb appeal and attract potential buyers and renters.
Renovation cost estimate screening
| Repair item | Severity | Est. cost |
|---|---|---|
| Roof · Severe damage and missing shingles require full replacement. | Major | $15,000–50,000 |
| Siding · Weathered and peeling paint, indicating extensive damage. | Major | $15,000–50,000 |
| Flooring · Damaged and uneven, requiring full replacement. | Major | $15,000–50,000 |
| Paint · Peeling and damaged paint, indicating extensive wear. | Major | $15,000–50,000 |
| Bathroom Fixtures · Dirty and outdated, requiring full replacement. | Major | $15,000–50,000 |
| Landscaping · Overgrown vegetation and unkempt appearance. | Major | $15,000–50,000 |
| Fencing · Sections missing or broken, requiring full repair or replacement. | Major | $15,000–50,000 |
| Total estimated repair cost · 7 items | $105,000–350,000 |
Value-add ROI direction
- Both New roof — A new roof will significantly improve the home's appearance and functionality, attracting both buyers and renters. ↑
- Both New siding and paint — Fresh siding and paint will enhance the home's curb appeal and make it more attractive to potential buyers and renters. ↑
- Both New flooring — Replacing the damaged flooring will improve the home's functionality and make it more appealing to potential buyers and renters. ↑
- Both New bathroom fixtures — Upgrading the outdated bathroom fixtures will make the home more attractive and functional for both buyers and renters. ↑
- Both Landscaping and fencing repair — A well-maintained and aesthetically pleasing exterior will enhance the home's curb appeal and attract potential buyers and renters. ↑
ⓘ Cost ranges are severity-bucket heuristics (US national rule-of-thumb). Get contractor quotes + a written scope before underwriting a rehab budget.
Schools (NCES district)
- District
- Lancaster 01
- NCES district ID
- 4502580
- Math proficiency
- 41% ▼ -7.00%
- Reading proficiency
- 47% ▼ -1.00%
- Median HH income
- $44,165
- Composite
- 37.23/100
- National rank
- #4462
- State rank
- #26 of 80 in SC
Livability — Kershaw
- Score
- 68/100
- State rank
- #80
- US rank
- #9162
Category grades
Schools grade is shown separately in the Schools card above.
Census & demographics
- Census place
- Kershaw, SC
Population outlook (Lancaster County) Hauer SSP2
- Today (2025)
- 105,572 people
- By 2030
- 114,865 · +8.8%
- By 2040
- 132,268 · +25.3%
- By 2050
- 148,252 · +40.4%
- By 2075
- 182,540 · +72.9%
- By 2100
- 202,237 · +91.6%
Not yet ingested
- Political lean
- —
- Race & ethnicity
- —
- Common origin
- —
- Civics
- —
Market trends
- HPI YoY
- —
- Current HPI
- —
- Rent YoY
- —
- Metro
- —
- State GDP YoY
- ▲ 4.51%
- F500 in state
- 2
Industry mix (Fortune 500 HQ in SC)
| Industry | F500 HQs | Revenue |
|---|---|---|
| Packaging | 1 | $7B |
|
||
Price history
1 event — show timeline
- 2026-06-05 Listed $124,900 Consolidated MLS
Cash-flow waterfall
monthlySold comps — $/sqft
last 12 mo · ≤1 miLoading sold comps…