 🏢 Co-op
6010 Kennedy Blvd E · West New York, NJ
Flood risk 1/10 · Minimal
- FEMA flood zone
- X (unshaded)
- Chance of flooding over 30 yrs
- 0.0%
- Est. flood insurance / yr
- $507 – $1,088
Fire risk 1/10 · Minimal
- Est. fire insurance / yr
- $526 – $976
Heat risk 6/10 · Moderate
- Hot days now (above 99°F)
- 7 days/yr
- Hot days in 30 yrs
- 15 days/yr
Wind risk 6/10 · Moderate
- Chance of severe wind over 30 yrs
- 27.0%
Air-quality risk 4/10 · Minor
- Unhealthy air days now
- 5 days/yr
- Unhealthy air days in 30 yrs
- 6 days/yr
Risk factors via First Street. Map © Google.
Why this score? — see what drove the D grade
The composite is a weighted blend of 9 inputs, each scored 0–100. Each bar is that input's sub-score; the figure is the points it added to the 100-point composite (weight × sub-score).
- Cash flow +14.6/30.0
- ARV discount +7.5/15.0
- DSCR +4.5/10.0
- 1% rule +4.1/10.0
- Livability +3.9/5.0
- Rent growth +3.2/5.0
- Condition / age +2.5/5.0
- Schools +1.9/10.0
- Appreciation +0.0/10.0
$290,000
🖨 Deal sheet (PDF) 📄 Offer letter ✓ Due diligence
Multi-family units
County records classify this as Multi-Family (5+ Unit). Listing-text estimate: 1 unit. estimate disagrees with records
5+ unit building — per-unit beds/baths from public records are typically unavailable; the breakdown below (if shown) is an estimate from the listing text.
Listing remarks
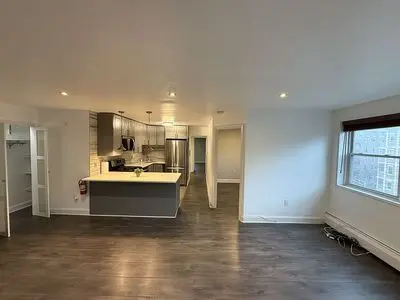
Come be part of a small and wonderful Co-Op community! Stunning Two Bedroom and One Bath in Blvd East. View this modern, open kitchen, hardwood floor, and versatile bedroom layout apartment. Added features include granite counter tops, stainless steel appliances, and a view of NYC. Close to many parks that take you away from city life. First floor laundry room and 24/7 on-site superintendent All utilities are included in the maintenance fees including Water, Heat, Real Estate Taxes; except electric. Fios and Optimum are available. Parking Garage is currently being fixed and should be available in September for a nominal fee. Public Transportation to NYC is just a few steps away. This is a
Key facts
- Hardwood floor
- View of nyc
- Granite counter tops
Tags
Neighborhood map
What this means for you Summary
Snapshot
- This is a 2-bed/1.0-bath multifamily listed at $290k.
Deal economics
- At list price, monthly cash flow is $72 ($860/yr) — positive.
- The deal already cash-flows at list — no discount required.
- To meet the 1% rule (rent ≥ 1% of price), the offer needs to be $263k (9.4% below list).
- Recommended offer: $263k (9.4% below list) — sets the bar for 1% rule.
- Cap rate 6.6% vs local median 1.6% in West New York — top-decile yield for the area; either an underpriced asset or a hidden risk that comps aren't pricing in. Stress-test before assuming the spread holds.
Location & tenants
- Location reads 77/100 on livability (#119 in NJ, #3,034 nationally) — a middle-class / working-renter tenant base. Strengths: amenities A+, commute A+, health & safety A; Watch: cost of living F.
- West New York Board Of Education (suburban): math 10% / reading 34% proficiency, ranked #420 of 472 in NJ (top 89%) — low school quality limits family demand, transient renter base, plan for 1-2y turnover; 75% free/reduced lunch — lower-income household profile, screen leases tightly.
- Zoned schools: Harry L Bain (math 7% / reading 26%, grade F, #1,094 of 1,303 statewide, top 85%, 650 students, 82% FRL); West New York Middle School (math 8% / reading 41%, grade F, #365 of 431 statewide, top 86%, 1,096 students, 87% FRL); Memorial High School (math 15% / reading 43%, grade F, #298 of 399 statewide, top 75%, 2,251 students, 80% FRL).
- Market conditions: Rents rising (+2.7%/yr); 265 active listings in the ZIP; 5,310 units permitted in Hudson County in 2024 (4,154 in 5+ unit buildings).
- This rent runs 43% of the median local income ($73k/yr) — at the standard rent-burdened threshold; future hikes will face affordability resistance.
Forward outlook
- Local home prices are declining (-3.0%/yr); year-one equity from $2k of loan paydown is wiped out by about $9k of value loss. Plan a longer hold.
- Hudson County population projected at +29% by 2050 — long-run rental-demand tailwind backs the buy-and-hold thesis.
Negotiation context
- It's been on market 26 days — a 2% lower offer ($286k) is reasonable based on typical stale-listing flexibility.
- 2 sale attempts with the ask held roughly flat each time — persistent listings suggest the price (not the market) is what's stuck; bring a comps-based counter.
Risks & watch-outs
- Climate carrying-cost: major wind risk, 27% chance of damaging wind over 30y; extreme-heat days projected 7→15/yr by 2055 (HVAC capex compounding) — expect insurance premiums to compound above CPI over the hold.
Questions for the listing agent
- Built in 1960 — when were the roof, HVAC, electrical panel, plumbing, and water heater last replaced?
- Is there a deadline driving the sale (1031 exchange, divorce, estate, relocation)? That informs how much negotiation room exists.
- Schools are D-rated, which usually means shorter tenancies and higher turnover. Who's the typical renter profile here, and what's been the actual vacancy rate?
- The area grade is low — what's the realistic commute time and amenity access for the typical tenant pool here? Any planned neighborhood developments (good or bad) we should know about?
- What's the average days-on-market for RENTAL listings here right now (not sales)? A rising rental-DOM trend means longer vacancies and softer asking-rent achievability than the comps imply.
- What's the recent tenant-quality profile in this submarket — average credit score on applications, eviction rate, late-payment / NSF rate, and stable-employment percentage? A property-management company in the area should have these aggregated.
- How much new apartment / multifamily construction is in the pipeline within 1–3 miles? Heavy new supply (>2% of stock underway) typically softens rents 12–24 months out; light construction supports rent growth.
Investment metrics
- 1% rule
- 0.91% ✗
- Cap rate
- 6.59%
- Cash-on-cash
- 1.06%
- DSCR
- 1.05
- GRM
- 9.2
CMA / ARV
No comps found within radius.
Projected returns pro-forma
-3.0% appreciation · 2.71% rent growth · sell at horizon
- IRR
- -14.9%
- Equity multiple
- 0.47×
- Total profit
- $-43,155
- Equity at exit
- $43,240
- IRR
- -6.8%
- Equity multiple
- 0.57×
- Total profit
- $-34,662
- Equity at exit
- $25,074
Cash invested: $81,200 (down + closing). Projections, not guarantees.
Landlord ↔ Tenant lean methodology
- Overall (STATE)
- 21 Tenant-Leaning
- State New Jersey
- 21 Tenant-Leaning · D+6
- County
- — inherits STATE
- City
- — inherits STATE
ZIP-level market 07093
- Home prices YoY
- -7.6%
- Rents YoY
- 2.7%
- Active inventory
- 265
- Price-to-rent
- 9.2×
Monthly cashflow live
- Estimated rent
- $2,628 medium interval (Pro) →
- Mortgage (P&I)
- −$1,521
- Tax est. 1.5%
- −$362 /mo · $4,350/yr
- Insurance
- −$121
- HOA
- −$0
- Vacancy / Maint / Mgmt
- −$552
- Net cashflow
- $72
Break-even live
Sensitivity live
| Price | -10% $272 | -5% $172 | +0% $72 | +5% $-29 | +10% $-129 |
|---|---|---|---|---|---|
| Rent | -10% $-136 | -5% $-32 | +0% $72 | +5% $175 | +10% $279 |
| Rate | -1.0pp $218 | -0.5pp $145 | base $72 | +0.5pp $-4 | +1.0pp $-80 |
UW: 25.0% down · 7.5% · 30yr · 1.5% tax · 5.0% vac · 8.0% maint · 8.0% mgmt
Financing live
Cash to close
- Down payment
- $72,500
- Closing costs
- $8,700
- Reserves months
- —
- Total cash needed
- —
Loan-product check · same deal, 3 products live
Conventional
25% down · 7.5% · 30yr
- Down + closing
- —
- Monthly P&I
- —
- Monthly cashflow
- —
- DSCR
- —
- Eligible?
- —
Personal DTI + credit; lowest rate.
DSCR
20% down · 8.5% · 30yr
- Down + closing
- —
- Monthly P&I
- —
- Monthly cashflow
- —
- DSCR
- —
- Eligible?
- —
No personal income docs; deal must DSCR.
Hard money
10% down · 12.0% · 12mo
- Down + closing
- —
- Monthly P&I
- —
- Monthly cashflow
- —
- DSCR
- —
- Eligible?
- —
Short-term bridge; refi at stabilization.
Listing history 21 events
-
2026-06-21days on market $290,000 Active 26 DOM
-
2026-06-18days on market $290,000 Active 23 DOM
-
2026-06-17days on market $290,000 Active 22 DOM
-
2026-06-16days on market $290,000 Active 21 DOM
-
2026-06-15days on market $290,000 Active 20 DOM
-
2026-06-13days on market $290,000 Active 18 DOM
-
2026-06-13days on market $290,000 Active 17 DOM
-
2026-06-09days on market $290,000 Active 14 DOM
-
2026-06-08days on market $290,000 Active 13 DOM
-
2026-06-07days on market $290,000 Active 12 DOM
-
2026-06-04days on market $290,000 Active 9 DOM
-
2026-06-03days on market $290,000 Active 8 DOM
-
2026-06-02days on market $290,000 Active 7 DOM
-
2026-06-01days on market $290,000 Active 6 DOM
-
2026-05-31days on market $290,000 Active 5 DOM
-
2026-05-26$290,000 Active
-
2026-01-08price $325,000
-
2025-11-13$350,000 Active
-
2023-08-17historical
-
1982-10-01soldstatus $2,886,438
-
1982-10-01soldstatus $2,886,438
ⓘ Source: listings_history table (triggers on properties + properties_extension) + one-shot
backfill from property_details.listing_events for pre-trigger history.
Climate risk First Street
- Flood 1/10 Low FEMA zone X (unshaded) · 0% chance over 30 yrs
- Wildfire 1/10 Low
- Heat 6/10 Major 7 d/yr ≥99°F today · 15 d/yr by 30 yrs out
- Wind 6/10 Major 27% chance of damaging wind over 30 yrs
- Air quality 4/10 Moderate 5 unhealthy d/yr today · 6 by 30 yrs out
Nearby sold comps map
Loading sold comps map…
Walkable amenities ~0.75 mi
Loading nearby amenities…
Taxation est. · year 1
- Rental income
- $31,530
- − Mortgage interest
- −$16,245
- − Property taxes
- −$4,350
- − Insurance
- −$1,450
- − Repairs & maintenance
- −$2,522
- − Management
- −$2,522
- − Depreciation
- −$8,436
- Taxable loss
- −$3,995
- Est. tax savings @ 24.0%
- +$959
- After-tax cash flow
- $1,818/yr
For passive investors: Depreciation is non-cash, so a rental often shows a tax loss while cash-flowing — sheltering income. Rental losses are passive: they offset passive income freely, and up to $25,000/yr can offset ordinary (W-2) income if you actively participate and your MAGI is under $100k (phasing out to $0 by $150k); unused losses carry forward. On sale, claimed depreciation is recaptured at up to 25%, and gains may owe capital-gains tax (a 1031 exchange can defer both). Figures are a year-1 estimate at your 24.0% rate — not tax advice; consult a CPA.
Schools (NCES district)
- District
- West New York Board Of Education
- NCES district ID
- 3417580
- Math proficiency
- 10% ▼ -19.00%
- Reading proficiency
- 34% ▼ -9.00%
- Median HH income
- $46,745
- Composite
- 19.16/100
- National rank
- #8824
- State rank
- #420 of 472 in NJ
Livability — West New York
- Score
- 77/100
- State rank
- #119
- US rank
- #3034
Category grades
Schools grade is shown separately in the Schools card above.
Census & demographics
- Census place
- West New York, NJ
- County
- Hudson County · 718,323 people
- City population
- 63,758
- Metro
- New York-Newark-Jersey City, NY-NJ-PA
- Population (ZIP)
- 63,758
- Household income
- $73,174
- Rent vs Own
- Severe rent burden
- 5546.0
Population outlook (Hudson County) Hauer SSP2
- Today (2025)
- 771,834 people
- By 2030
- 818,028 · +6.0%
- By 2040
- 907,866 · +17.6%
- By 2050
- 994,480 · +28.8%
- By 2075
- 1,163,301 · +50.7%
- By 2100
- 1,254,703 · +62.6%
Race, ethnicity, and origin ACS 2023
- Neighborhood character
- Predominantly Hispanic (75%)
- Race & ethnicity
- Hispanic / Latino 75% Two or more races 27% White 15% Asian 7% Black 2% Native American 2%
- Hispanic origin (detail)
- Mexican 6% Puerto Rican 4% Cuban 12% Dominican 15%
- Common ancestry
- Romanian 1% Scotch-Irish 1% Lithuanian 1%
- Foreign-born
- 58% · Canada, Jamaica, China
- Languages at home
- 22% English-only · Spanish 67% Other Indo-European 2% Chinese 2%
Political lean MEDSL · Hudson
- 2024 margin
- Strong D (+28.1) · D 62.6% · R 34.6% · Other 2.8%
- 2008→2024 swing
- -18.7pp toward R · 2008: 46.7pp · 2024: 28.1pp
- All cycles
- 2024: D+28.1 2020: D+46.2 2016: D+51.8 2012: D+55.7 2008: D+46.7
Not yet ingested
- Civics
- —
Market trends
- HPI YoY
- ▼ -29.80%
- Current HPI
- 364.4128
- Rent YoY
- ▲ 2.71%
- Metro
- New York-Newark-Jersey City, NY-NJ-PA
- State GDP YoY
- ▲ 2.05%
- F500 in state
- 34
Industry mix (Fortune 500 HQ in NJ)
| Industry | F500 HQs | Revenue |
|---|---|---|
| Consumer Goods | 3 | $31B |
|
||
| Pharmaceuticals | 2 | $153B |
|
||
| Technology | 2 | $21B |
|
||
| Insurance | 2 | $20B |
|
||
| Healthcare | 2 | $19B |
|
||
| Financial Services | 1 | $70B |
|
||
Price history
-90.0% since first listed6 events — show timeline
- 2026-05-26 Listed $290,000 FSBO.com
- 2026-01-08 Price Changed $325,000 NJMLS
- 2025-11-13 Listed $350,000 NJMLS
- 2023-08-17 Rental Removed — NJMLS
- 1982-10-01 Sold (Public Records) $2,886,438 Public Records
- 1982-10-01 Sold (Public Records) $2,886,438 Public Records
Property tax history
+1.3%/yrLatest (2025): $328,254 · +5.4% YoY. Source: county tax records.
Cash-flow waterfall
monthlySold comps — $/sqft
last 12 mo · ≤1 miLoading sold comps…